The affinity diagram can be a useful tool whether you are brainstorming ideas, sorting through research data, improving a process or solving a problem.
In this quick guide, we’ll describe what is an affinity diagram, its many uses, and how to create one. A few affinity diagram templates are included in the post as well. You can edit these online instantly to kickstart your project.
- What is an Affinity Diagram?
- When to Use an Affinity Diagram? (Uses of Affinity Diagrams)
- How to Create an Affinity Diagram
- Affinity Diagram Templates
- Useful Tips for Creating Affinity Diagrams
- Affinity Diagram Examples
- Any Tips on Affinity Mapping?
What is an Affinity Diagram?
Also known as the K-J method, affinity chart, and affinity mapping, an affinity diagram is a tool that is used to organize data gathered from a brainstorming session, research, meeting, etc. under meaningful categories that are based on common relationships or themes. These themes are referred to as affinity sets or affinity groups.
It simplifies analyzing complex data by grouping them, which helps bring out connections among them and identify patterns.
When to Use an Affinity Diagram? (Uses of Affinity Diagrams)
Being one of the Seven Management and Planning Tools, the affinity diagram is commonly used in project management to organize, analyze and prioritize ideas and tasks. It also can be used to,
- Find creative solutions to difficult problems by involving people from diverse fields
- Sort through large volumes of confusing data and quickly organize them in a logical, easy-to-understand manner
- Encourage the participation of everyone involved, which leads to uncovering new patterns of thinking and unique solutions
- Generate useful discussions that will lead to innovation/ effective solutions etc.
- Present your analysis to others in the company in an easy-to-understand manner
How to Create an Affinity Diagram
Usually creating an affinity diagram is a group activity, and tends to produce more effective results with no more than 5-6 individuals who are experts in the subject, which is being analyzed. This way you can collect different and useful insights, opinions, and perspectives to help arrive at faster solutions or better innovations.
Following are the simple steps you need to go through when creating an affinity diagram. We have also included some best practices; stick to them for more effective results.
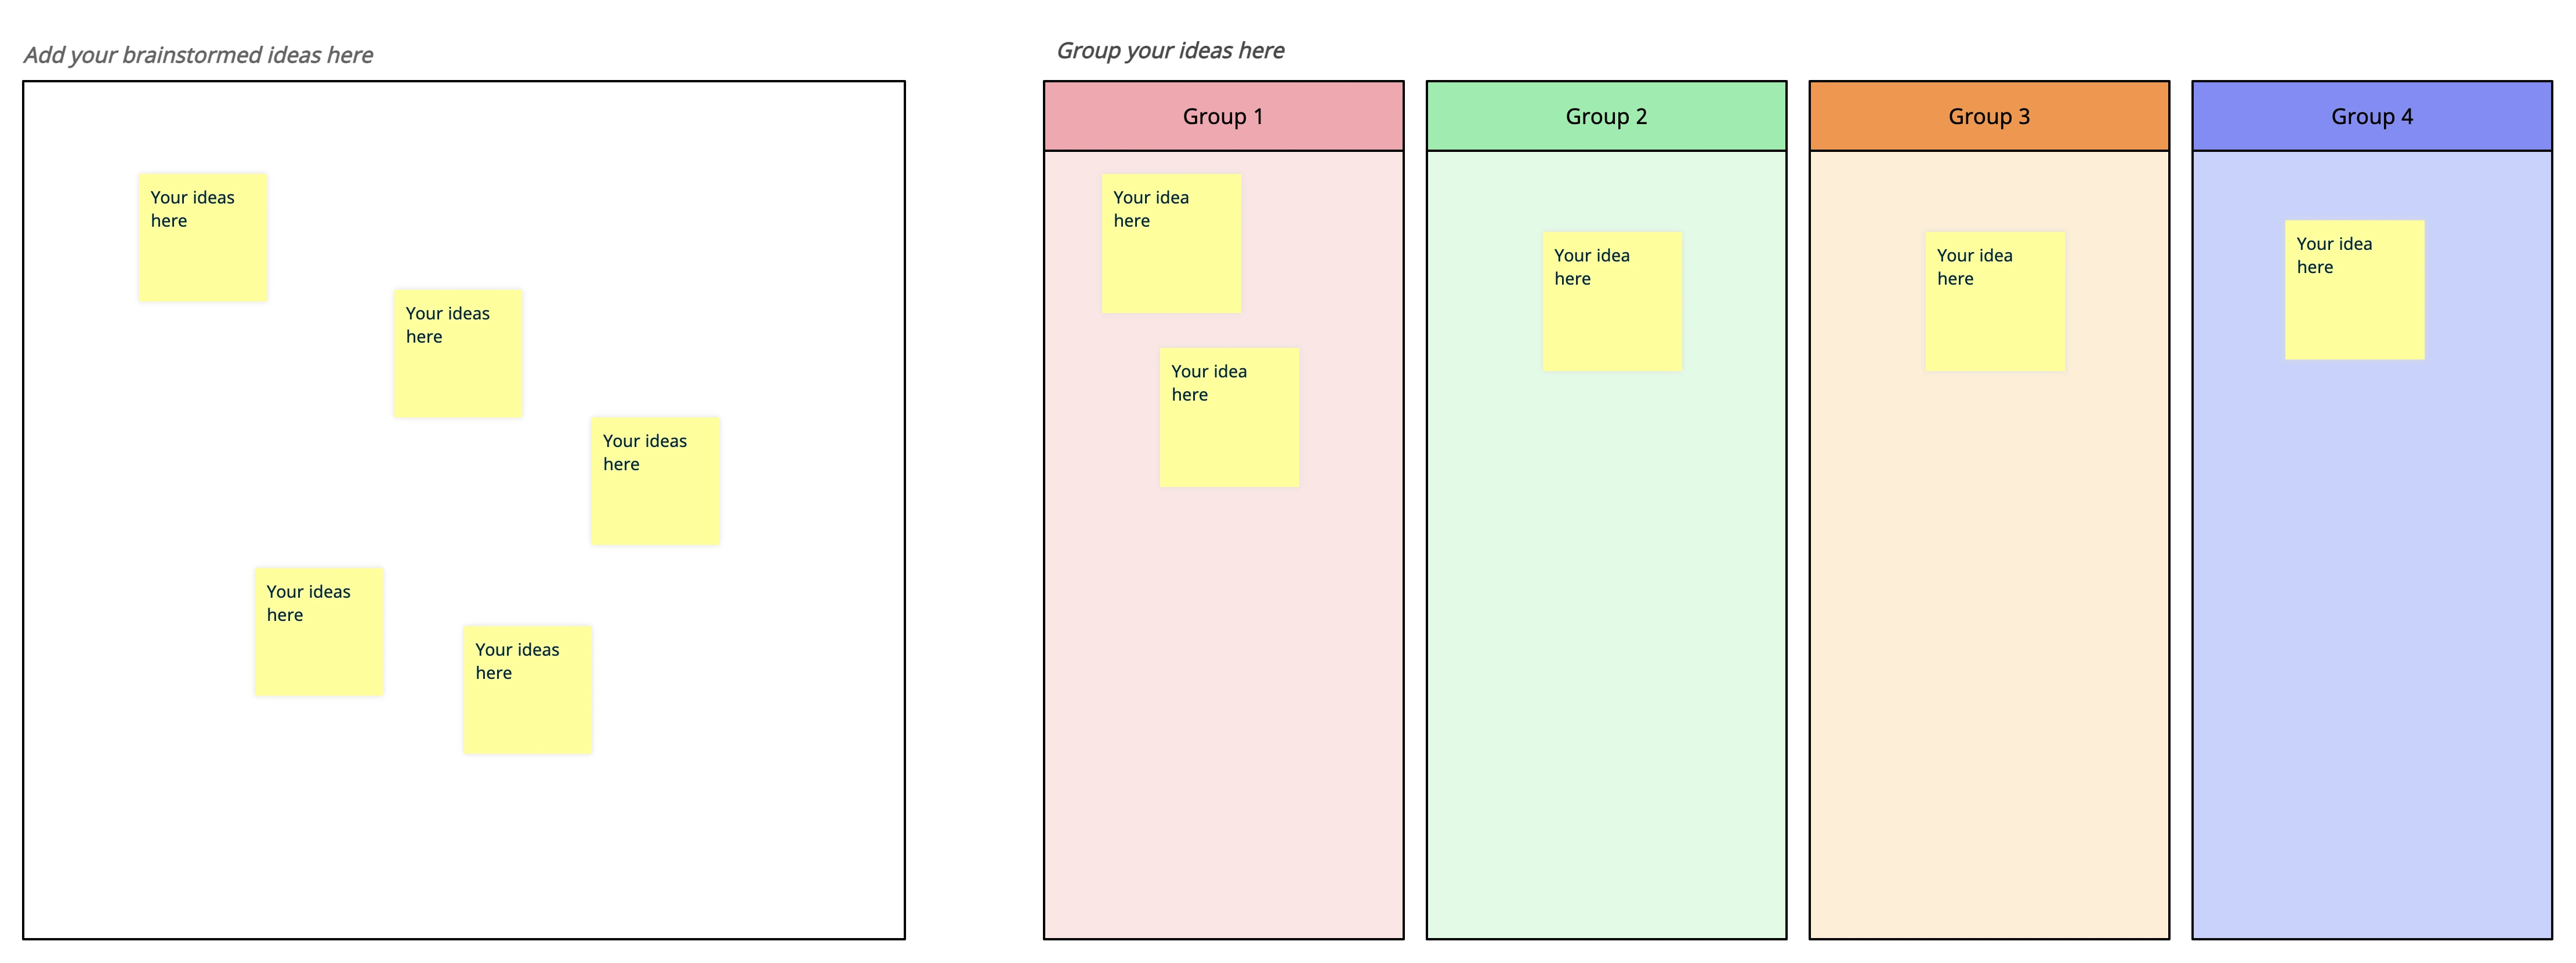
Step 1: Write down ideas from your brainstorming session
Write down the information you have gathered from your brainstorming session, research, surveys, etc. on separate cards.
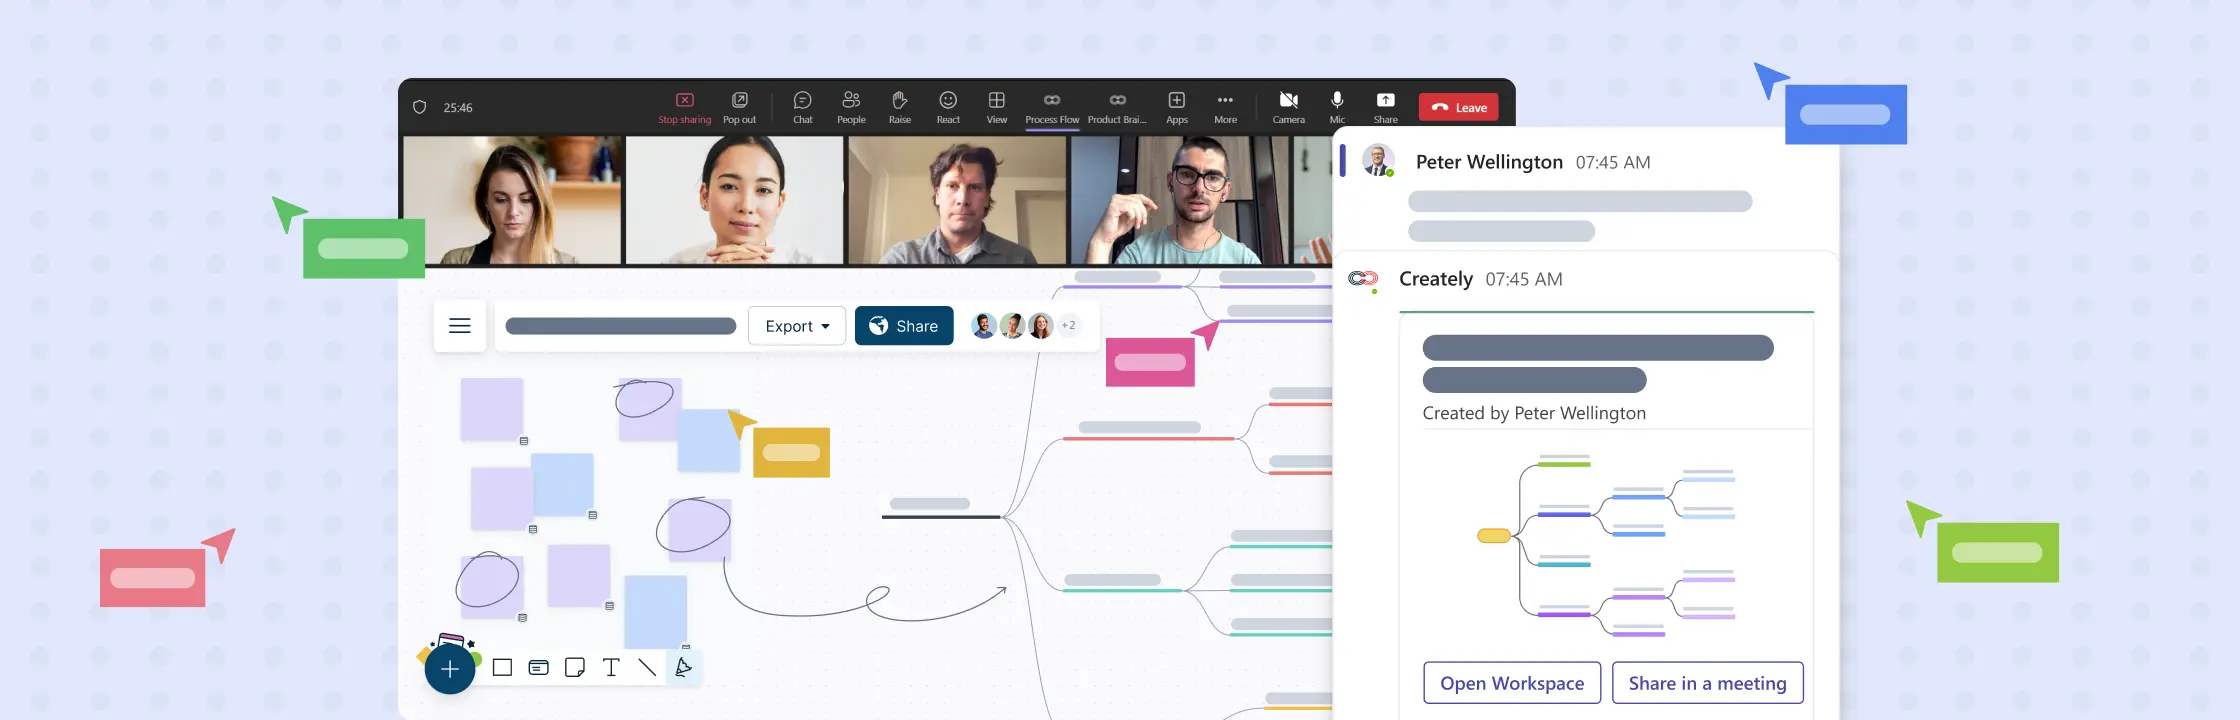
When using an online collaboration tool like Creately, you can use a square/ note shape to write them down and keep them aside on one side of the canvas. The placement of the cards doesn’t have to make sense, keep them at random. You get an infinite canvas area to collaborate with multiple team members in real-time.
Step 2: Review and group similar ideas
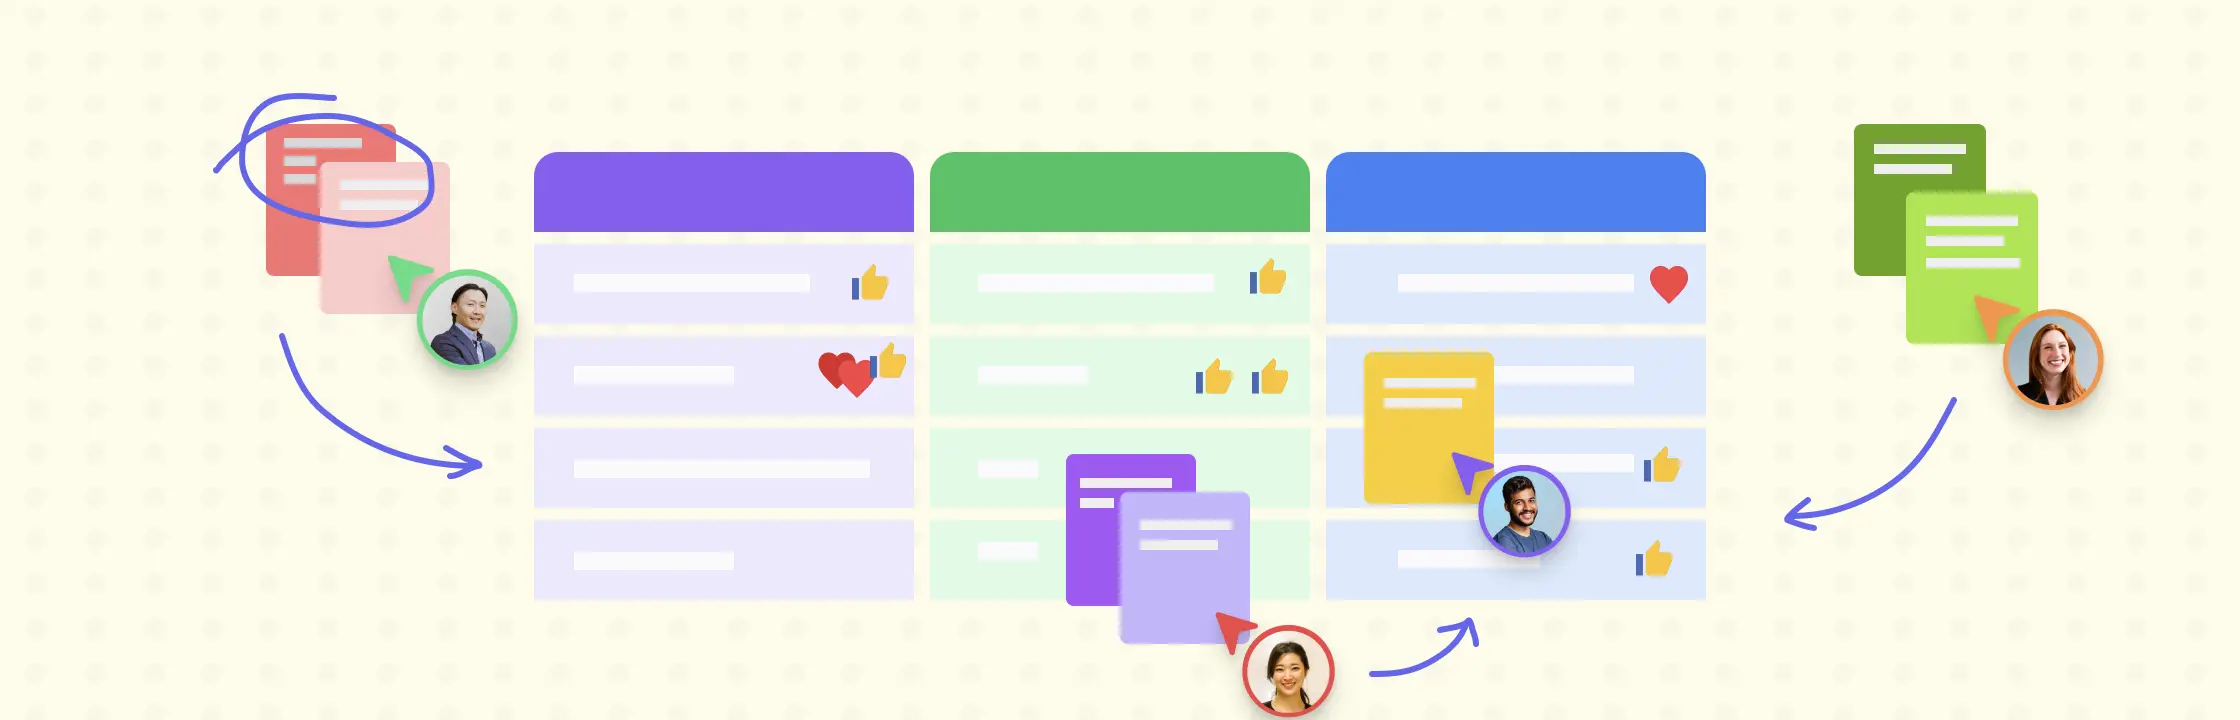
Review the ideas while looking for similarities or whether they are related to each other in some way.
Place these related ideas in one column of the table you have created. Don’t rely on the opinion of another when you are moving cards, do it at your own will, without talking. This will prevent any disagreements and allow everyone the freedom to follow their instincts.
Continue to group ideas based on their similarities until no cards are left. However, if you come across ideas that don’t fit into any of the categories, you can place them on their own.
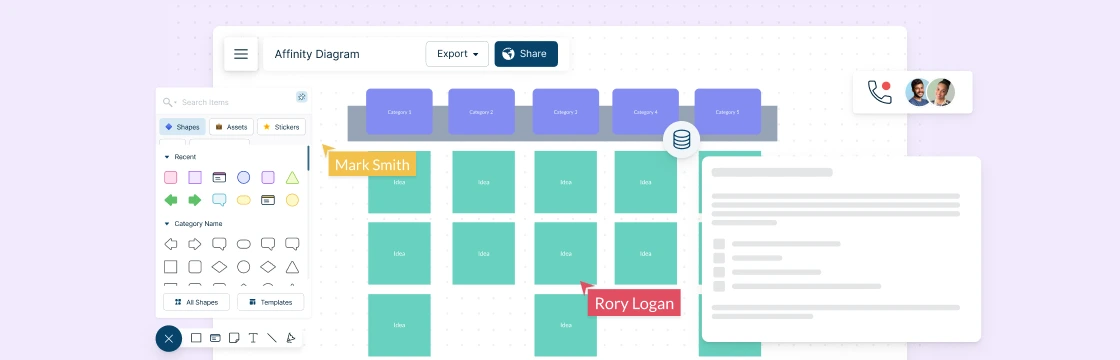
Creately has multiple pre-drawn affinity diagram templates that you can easily edit to fit your needs. Use plus create to add the next shape, and preset color themes to style your diagrams.
Step 3: Add titles to identified groups
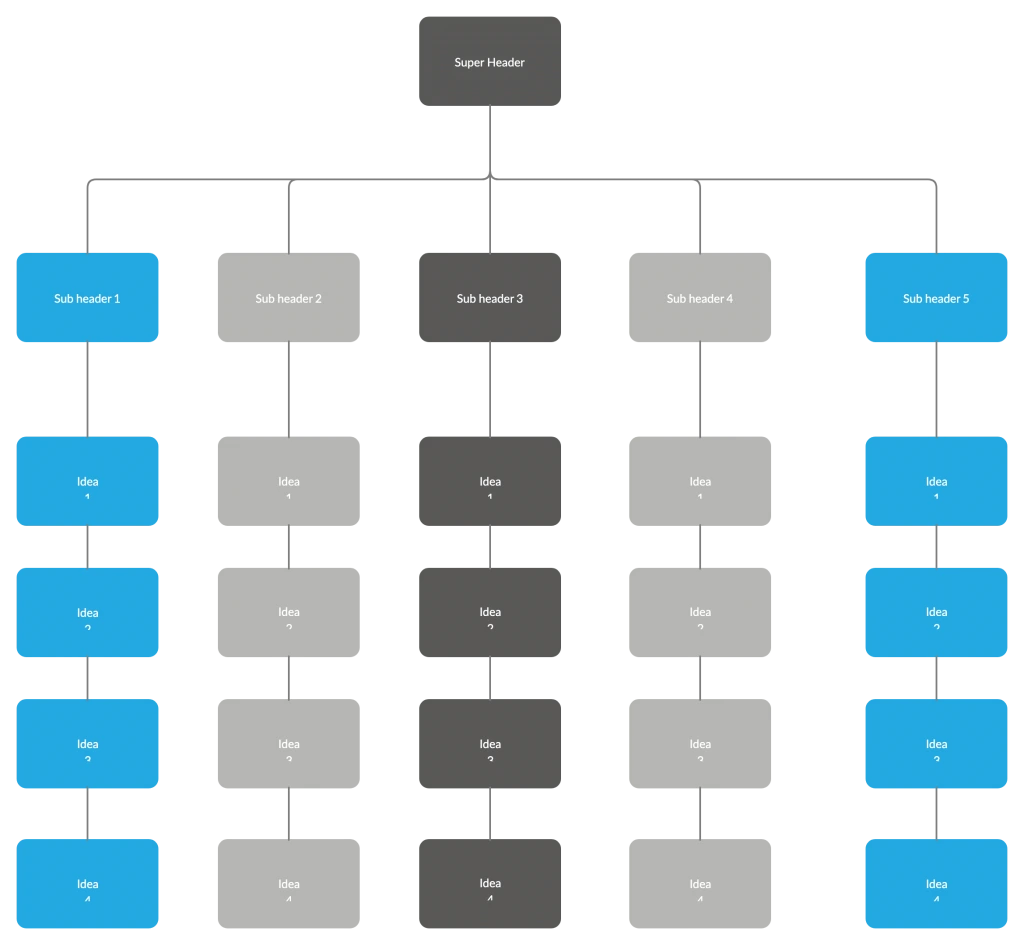
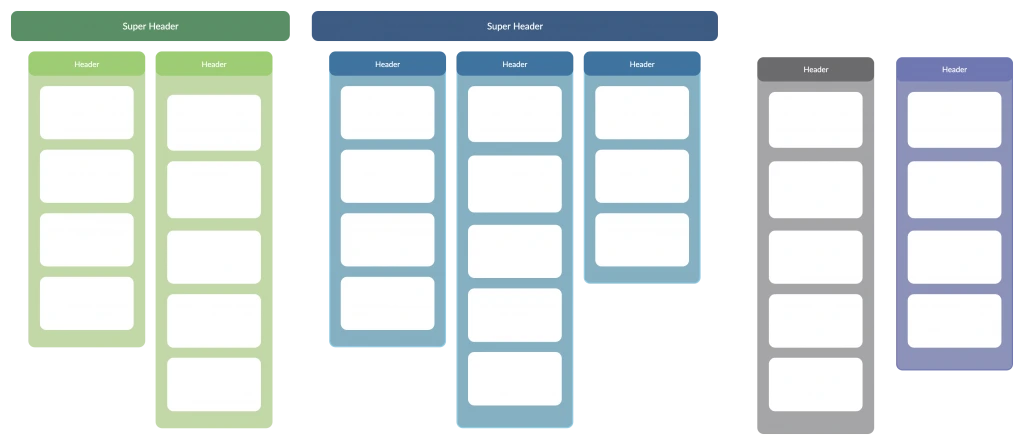
Based on the similarities you identified earlier, come up with header names for each group. The header should convey the relationship between the ideas in a single word or phrase. If you can discover relationships between separate groups, you can categorize them under a superheaders.
Step 4: Tweak your affinity diagram
Polish off your affinity diagram. Now that you have grouped the cards and given them headers, it’s time to make it look more presentable. Start by writing the problem statement at the top of the diagram. And you can add different colors to help different categories stand out.
Gather your team and review it to identify which ideas to prioritize. If you wish to share it with others outside your team, send them a view or edit link, or you can export them as SVGs or in several image formats and add them to company wikis, websites, presentations, or documents.
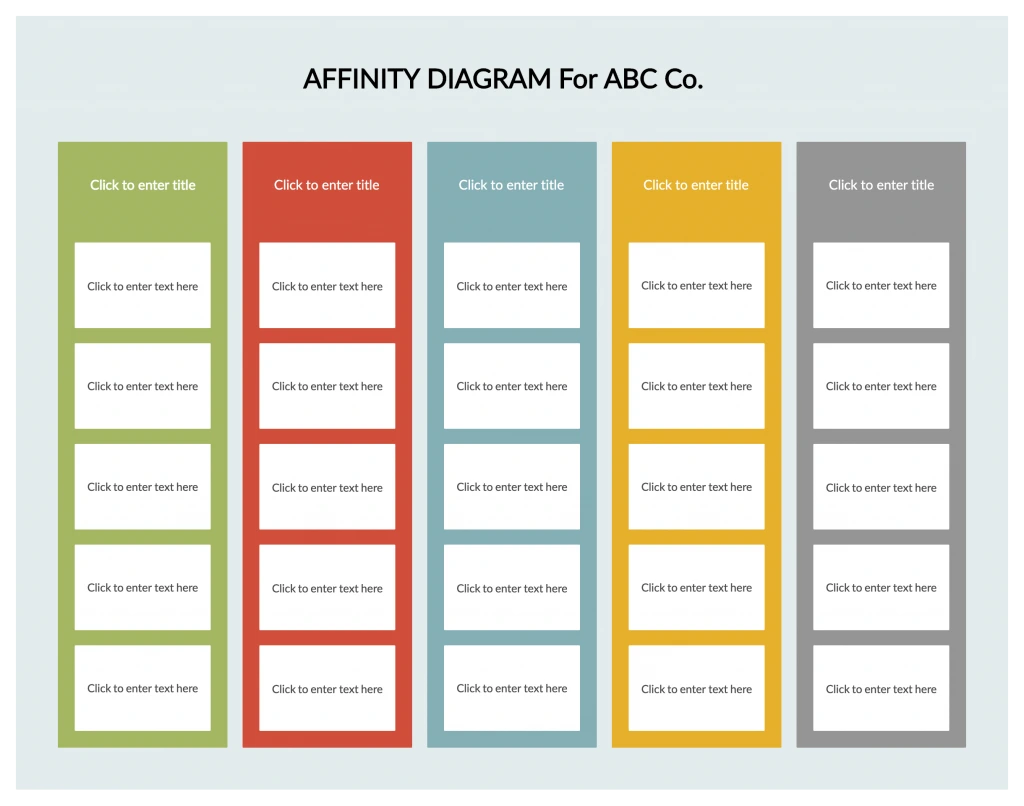
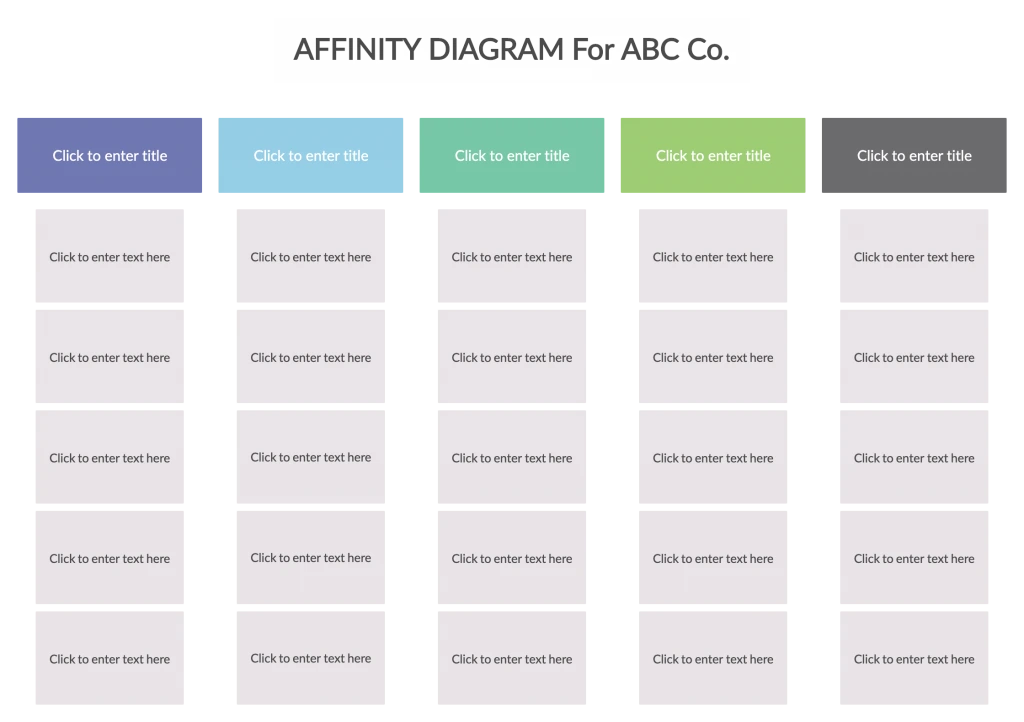
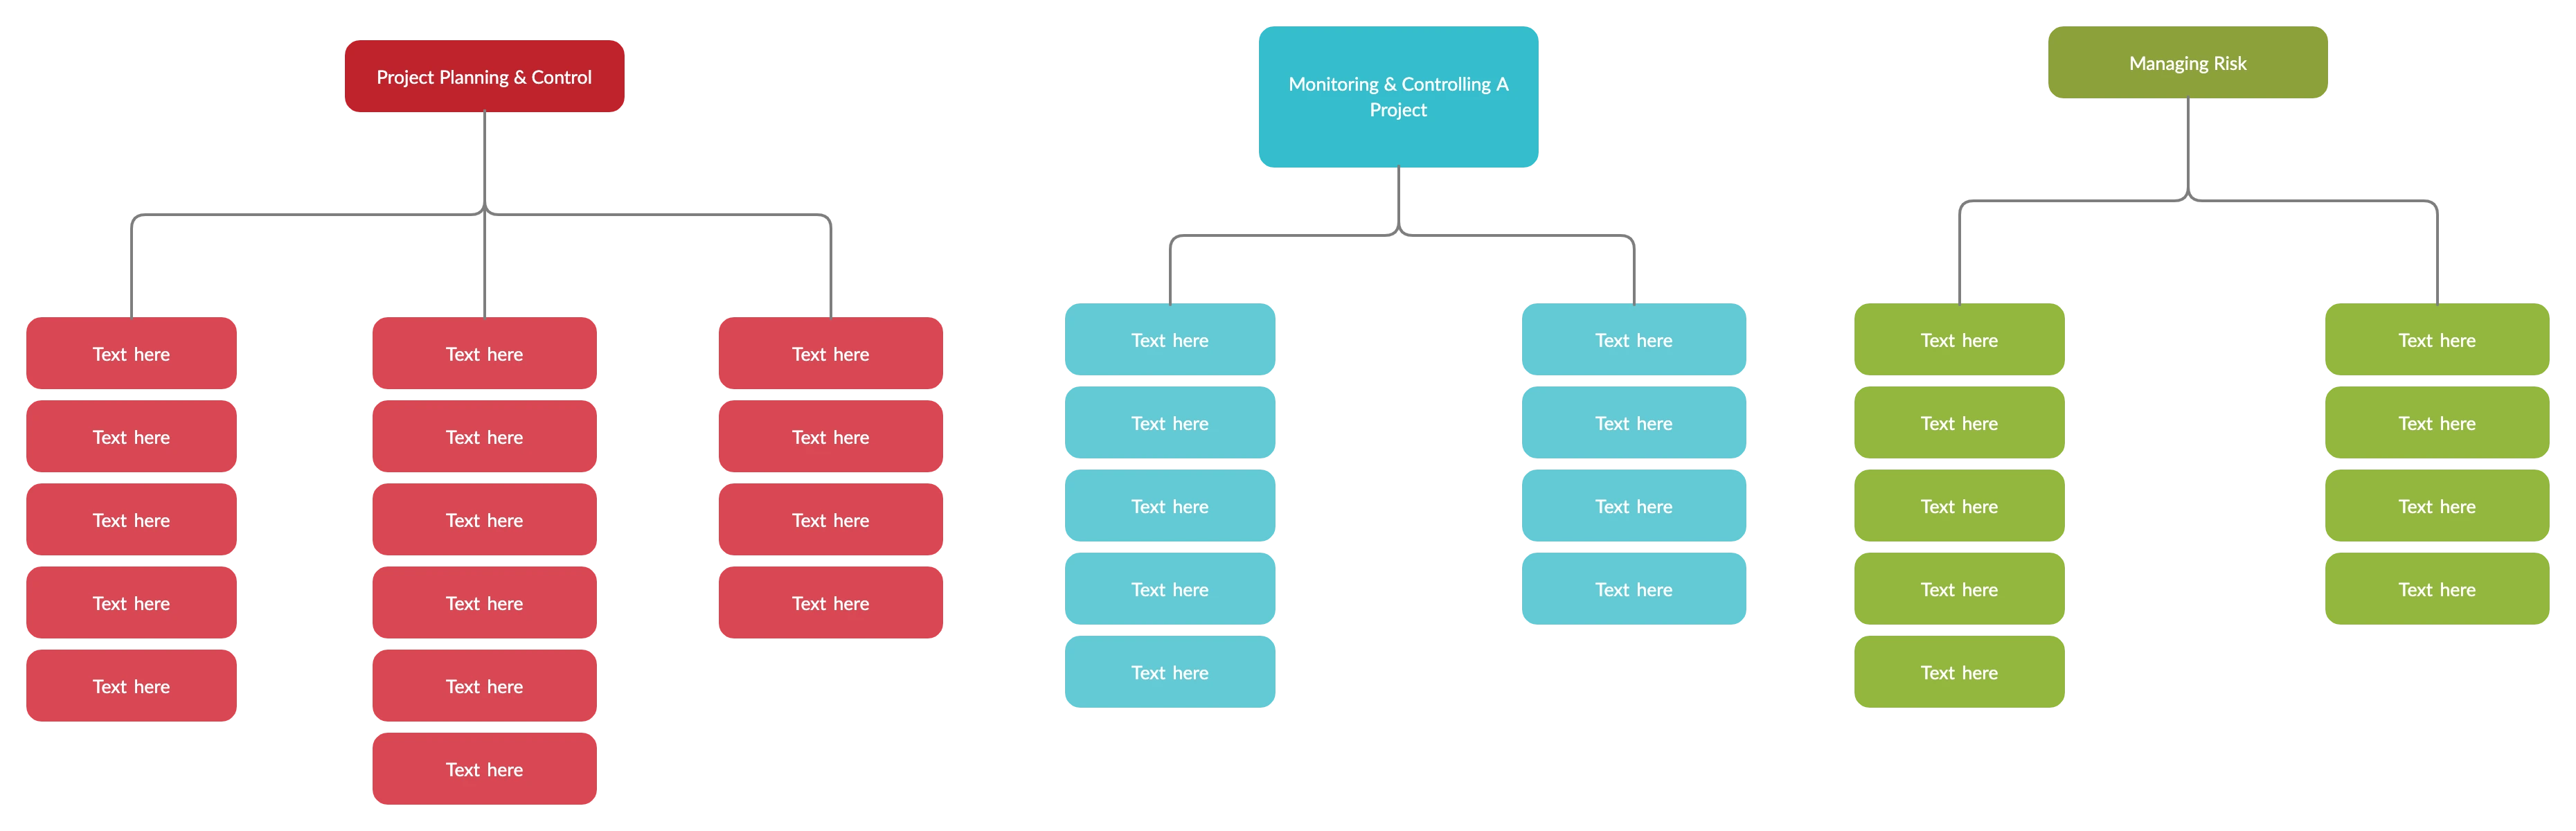
Affinity Diagram Templates
Affinity Diagram Examples
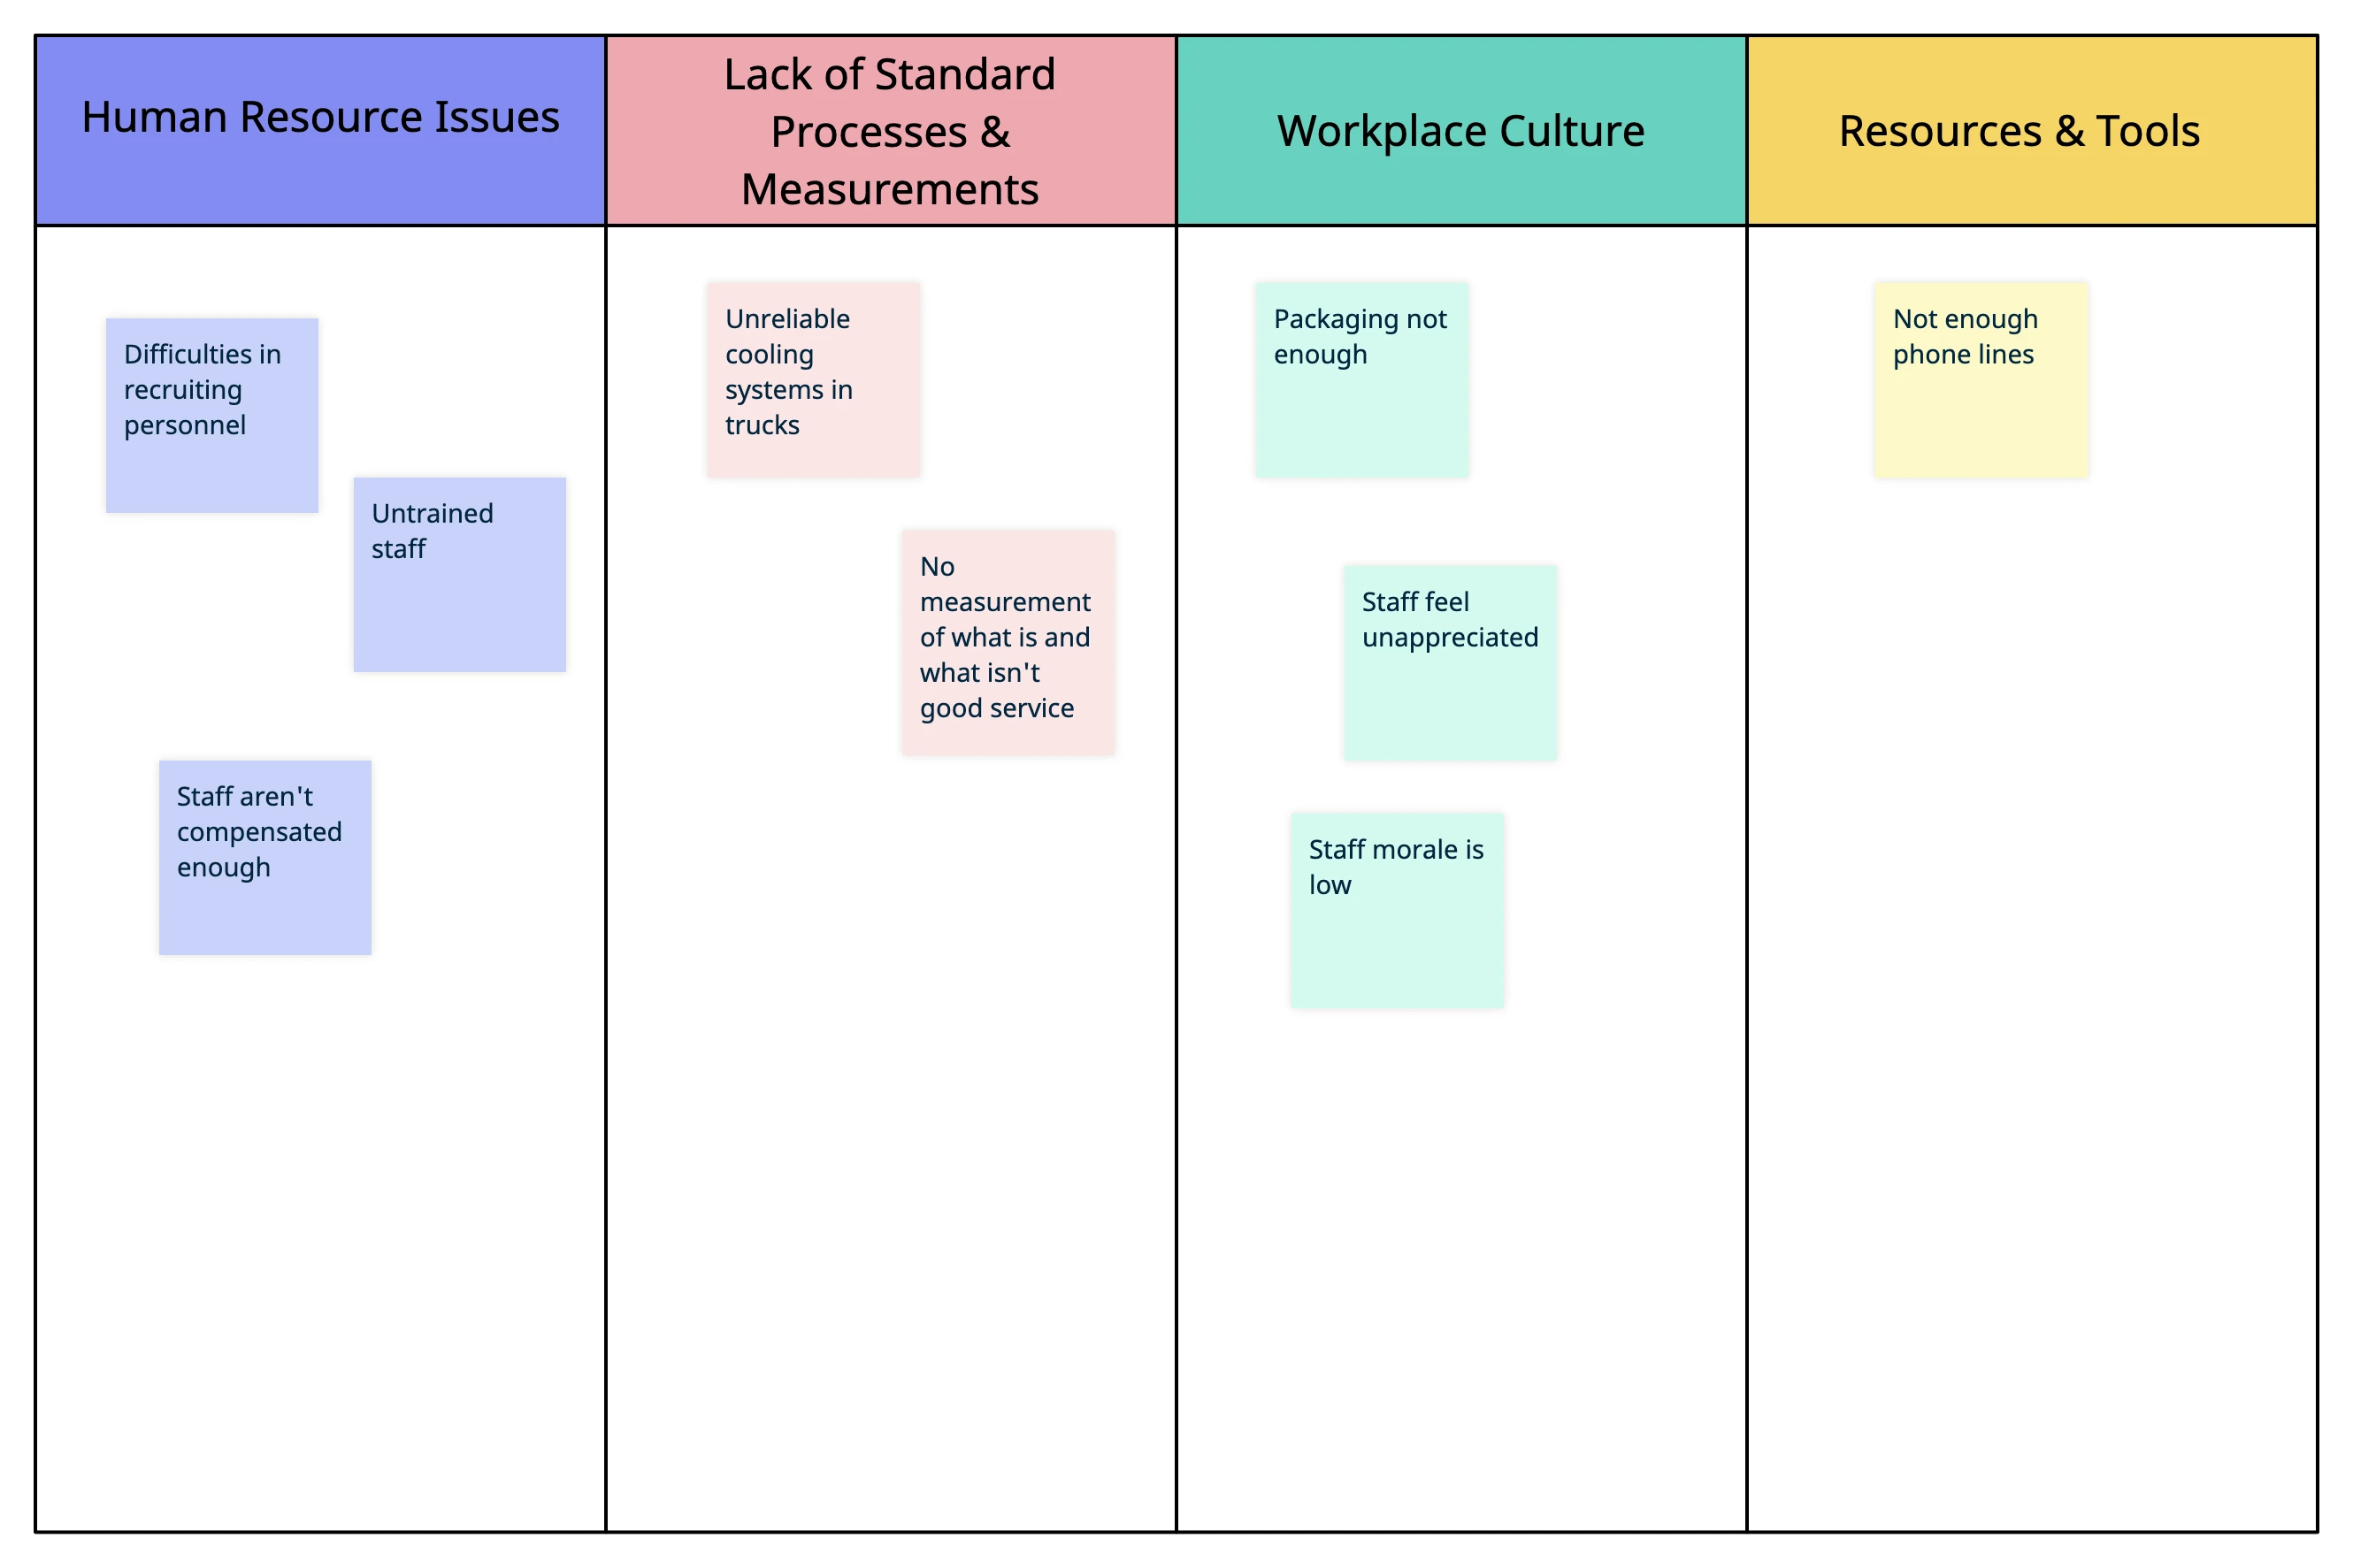
Affinity Diagram Example for Total Quality Management
This example shows how affinity diagrams can be used as a quality tool to identify challenges in management and planning. This specific affinity diagram example explores reasons for substandard customer service.
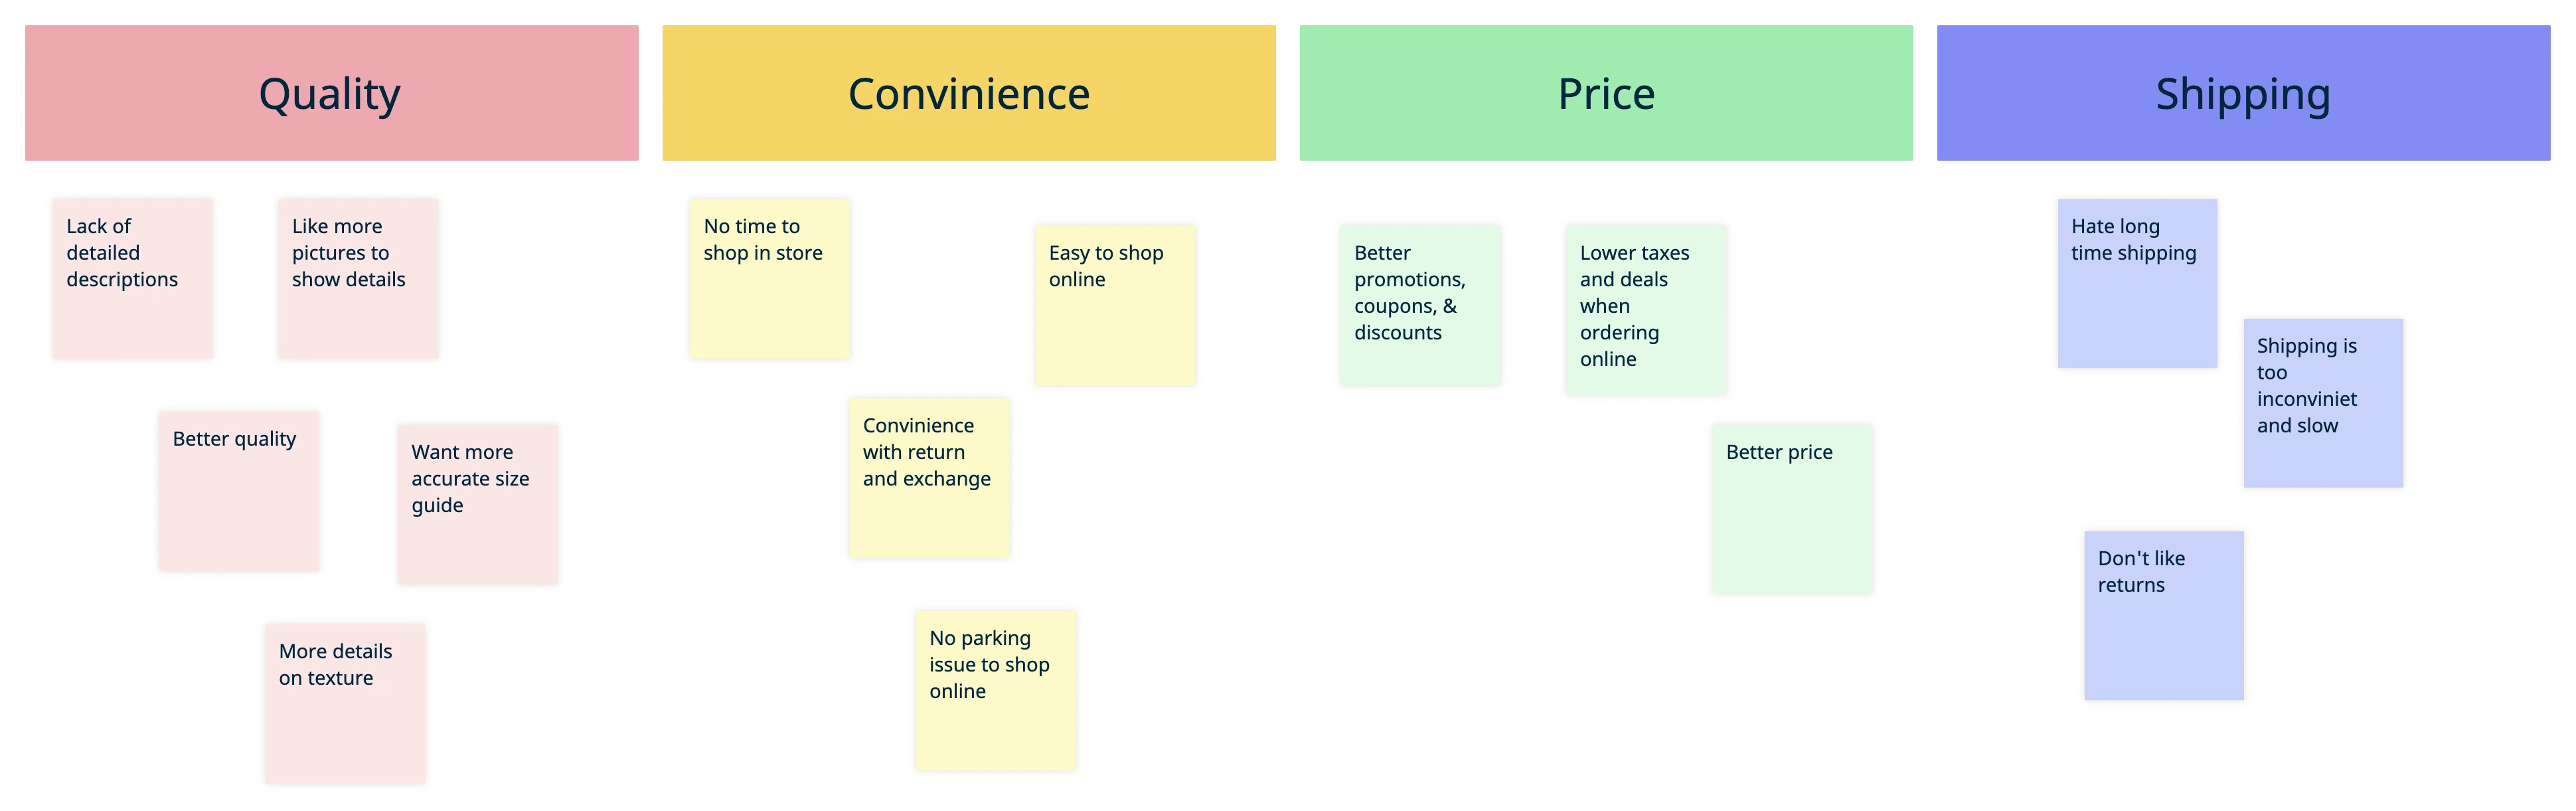
Affinity Diagram Example for User Research
This affinity diagram example groups insights and findings collected from user interviews. It has grouped information on the benefits of and the issues customers face while shopping for clothes online under different customer pain points.
Useful Tips for Creating Affinity Diagrams
- Set a clear goal prior to the brainstorming session as it is important to clearly define the goals and objectives of the affinity diagram. This will help you to focus your brainstorming and ensure that the final outcomes is relevant and useful.
- Include people with diverse backgrounds, perspectives, and experiences to ensure that a wide range of ideas and opinions are represented.
- Encourage open and free-flowing brainstorming by avoiding criticism and judgment, and by providing ample time for participants to generate ideas to increase the quality and quantity of ideas generated.
- The affinity diagram should be visually appealing and easy to read. Use color coding, shapes, and other visual aids to make it easier to identify patterns and themes.
- Too many groups in the affinity diagram can make it difficult to identify the most important themes or patterns. Aim for 5-7 groups, or as few as possible while still capturing all of the important ideas.
Any Tips on Affinity Mapping?
In this comprehensive guide, we have covered what affinity diagrams are and how to draw them with some pro tips that you can use along the way. We hope the affinity diagram examples & templates we have added here will help you get a head start.
Got more tips on drawing affinity diagrams? Share them with our readers in the comment section below.
FAQ on Affinity Diagrams
Affinity diagrams are used to generate, organize, and consolidate information related to a product, process, or problem. And they have multiple benefits for teams across industries. Affinity diagrams,
- Help teams, collaboratively analyze research findings.
- Help make better sense of qualitative research data by grouping similar information.
- Give everyone the opportunity to contribute and share their ideas, hence allowing to incorporate everyone’s perspectives in decision-making.
- Help generate innovative ideas and effective solutions to problems by discovering important patterns and trends in data.