Data integrated org chart based planning tools.
Agile project planning with integrated task.
IT and Cloud architecture tools for all platforms.
Product Management & Software Architecture.
Brainstorm, plan campaigns and organize assets.
Process, Value chain and System analysis tools.
A visual workspace for students and educators.
Run Meetings, Workshops or get feedback.
Document, plan and optimize business.
Idea to execution on a single collaborative.
Enterprise-grade security & team collaboration.
Log In
Sign Up Free
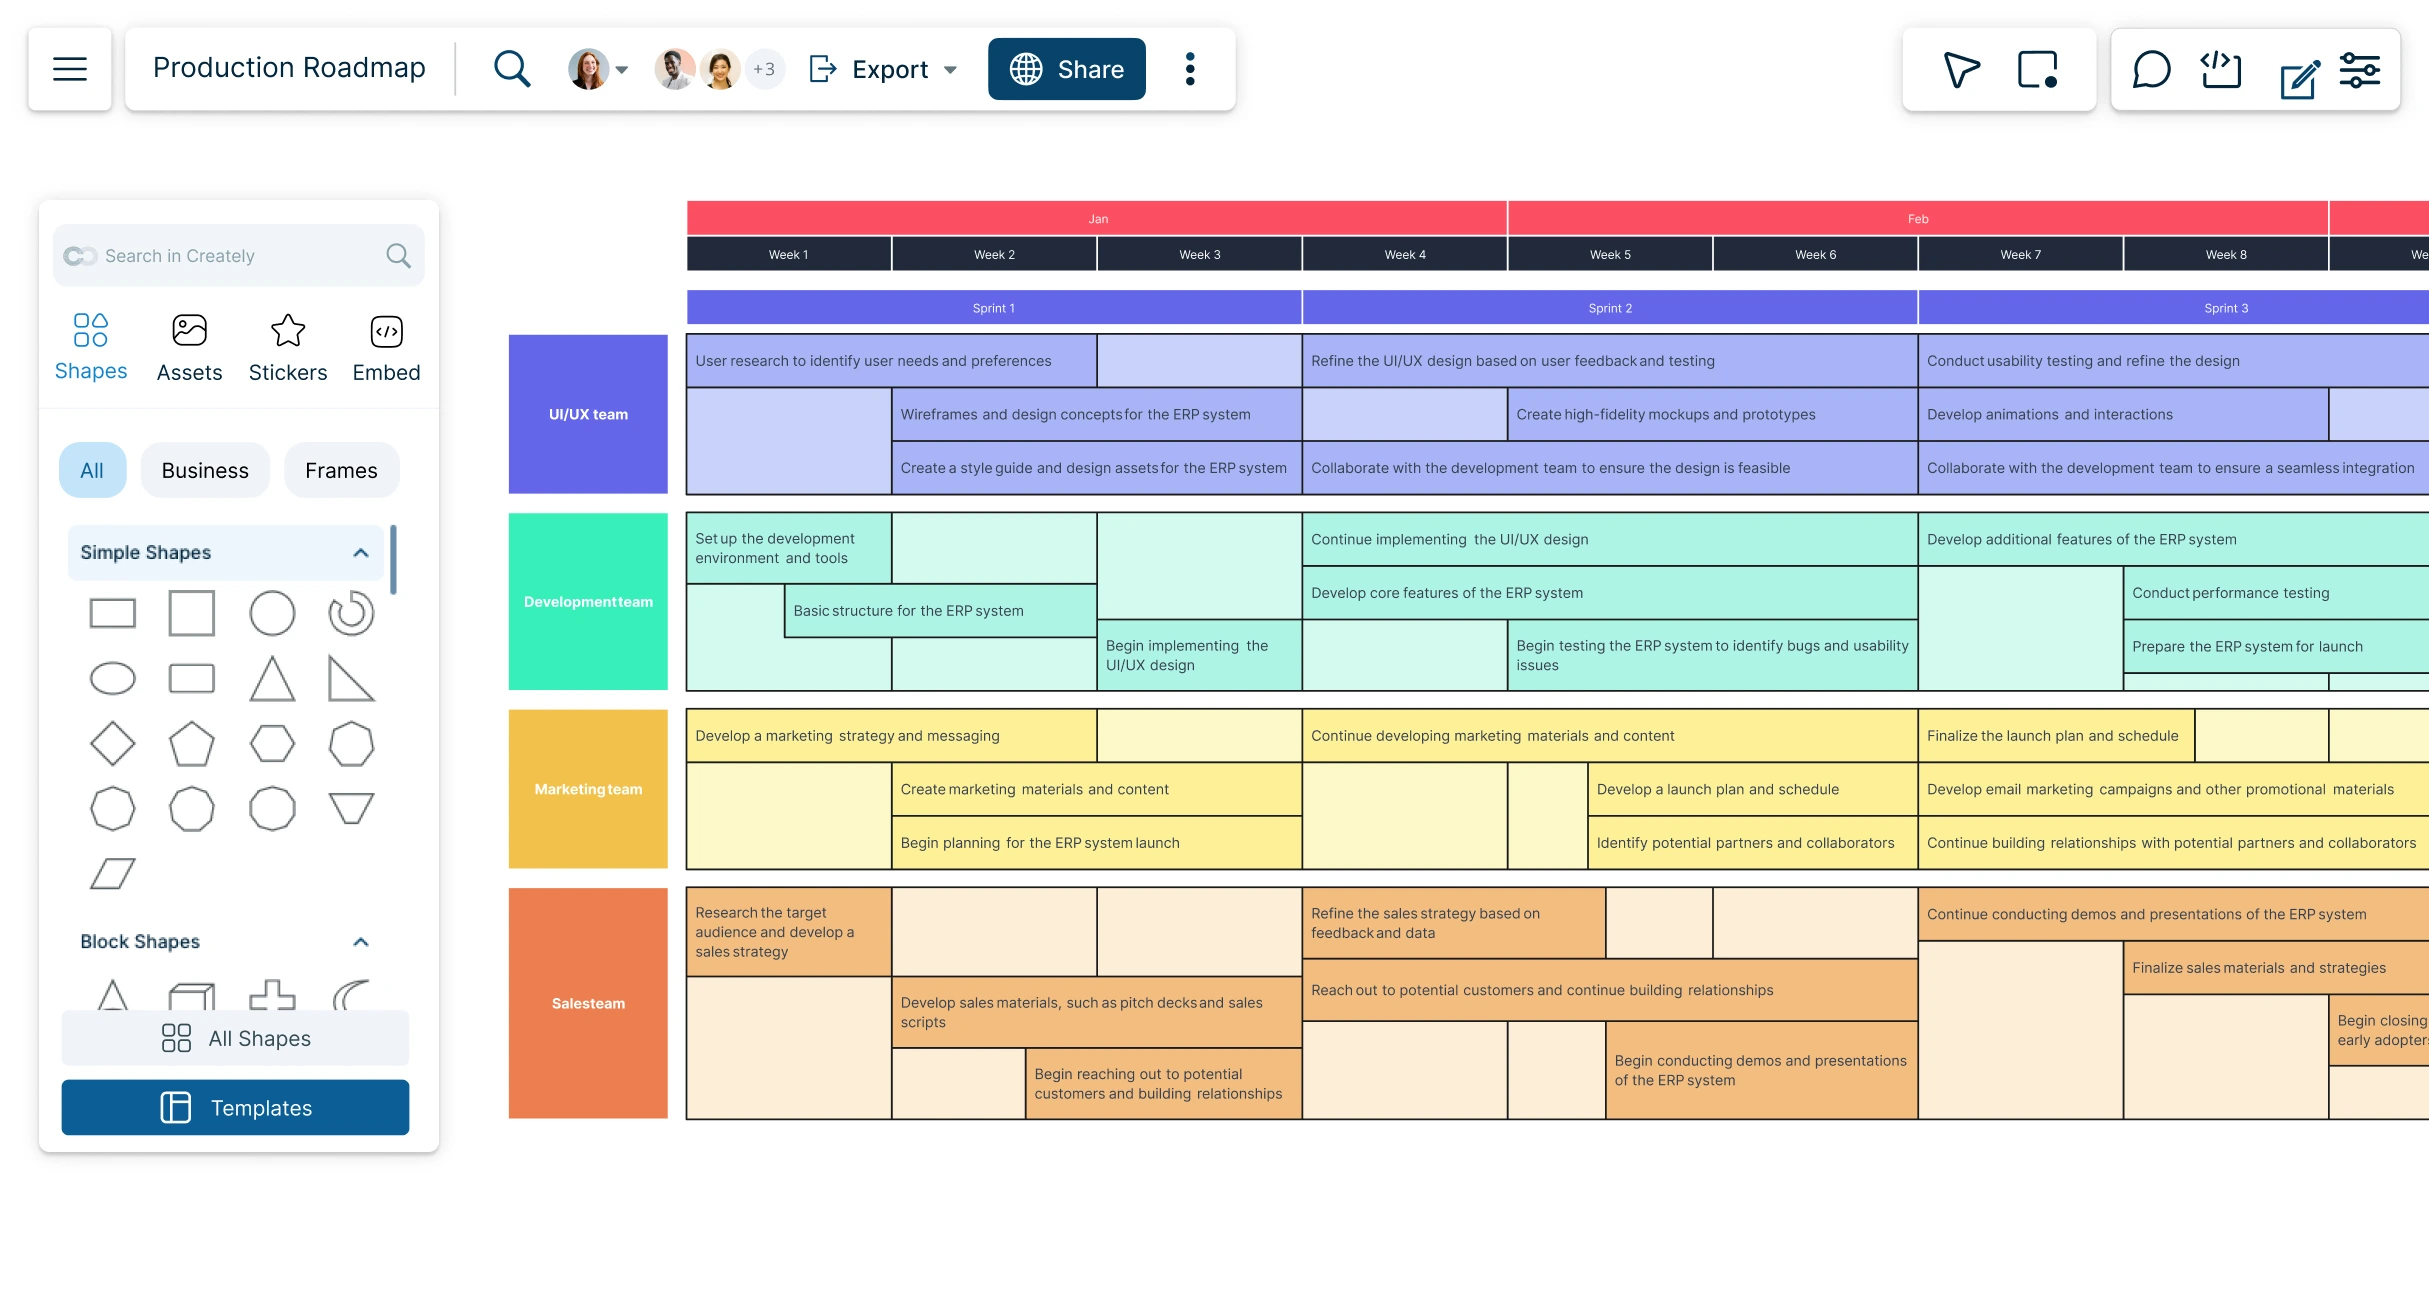
Effortlessly create a roadmap to clarify vision, enhance communication, and improve execution.
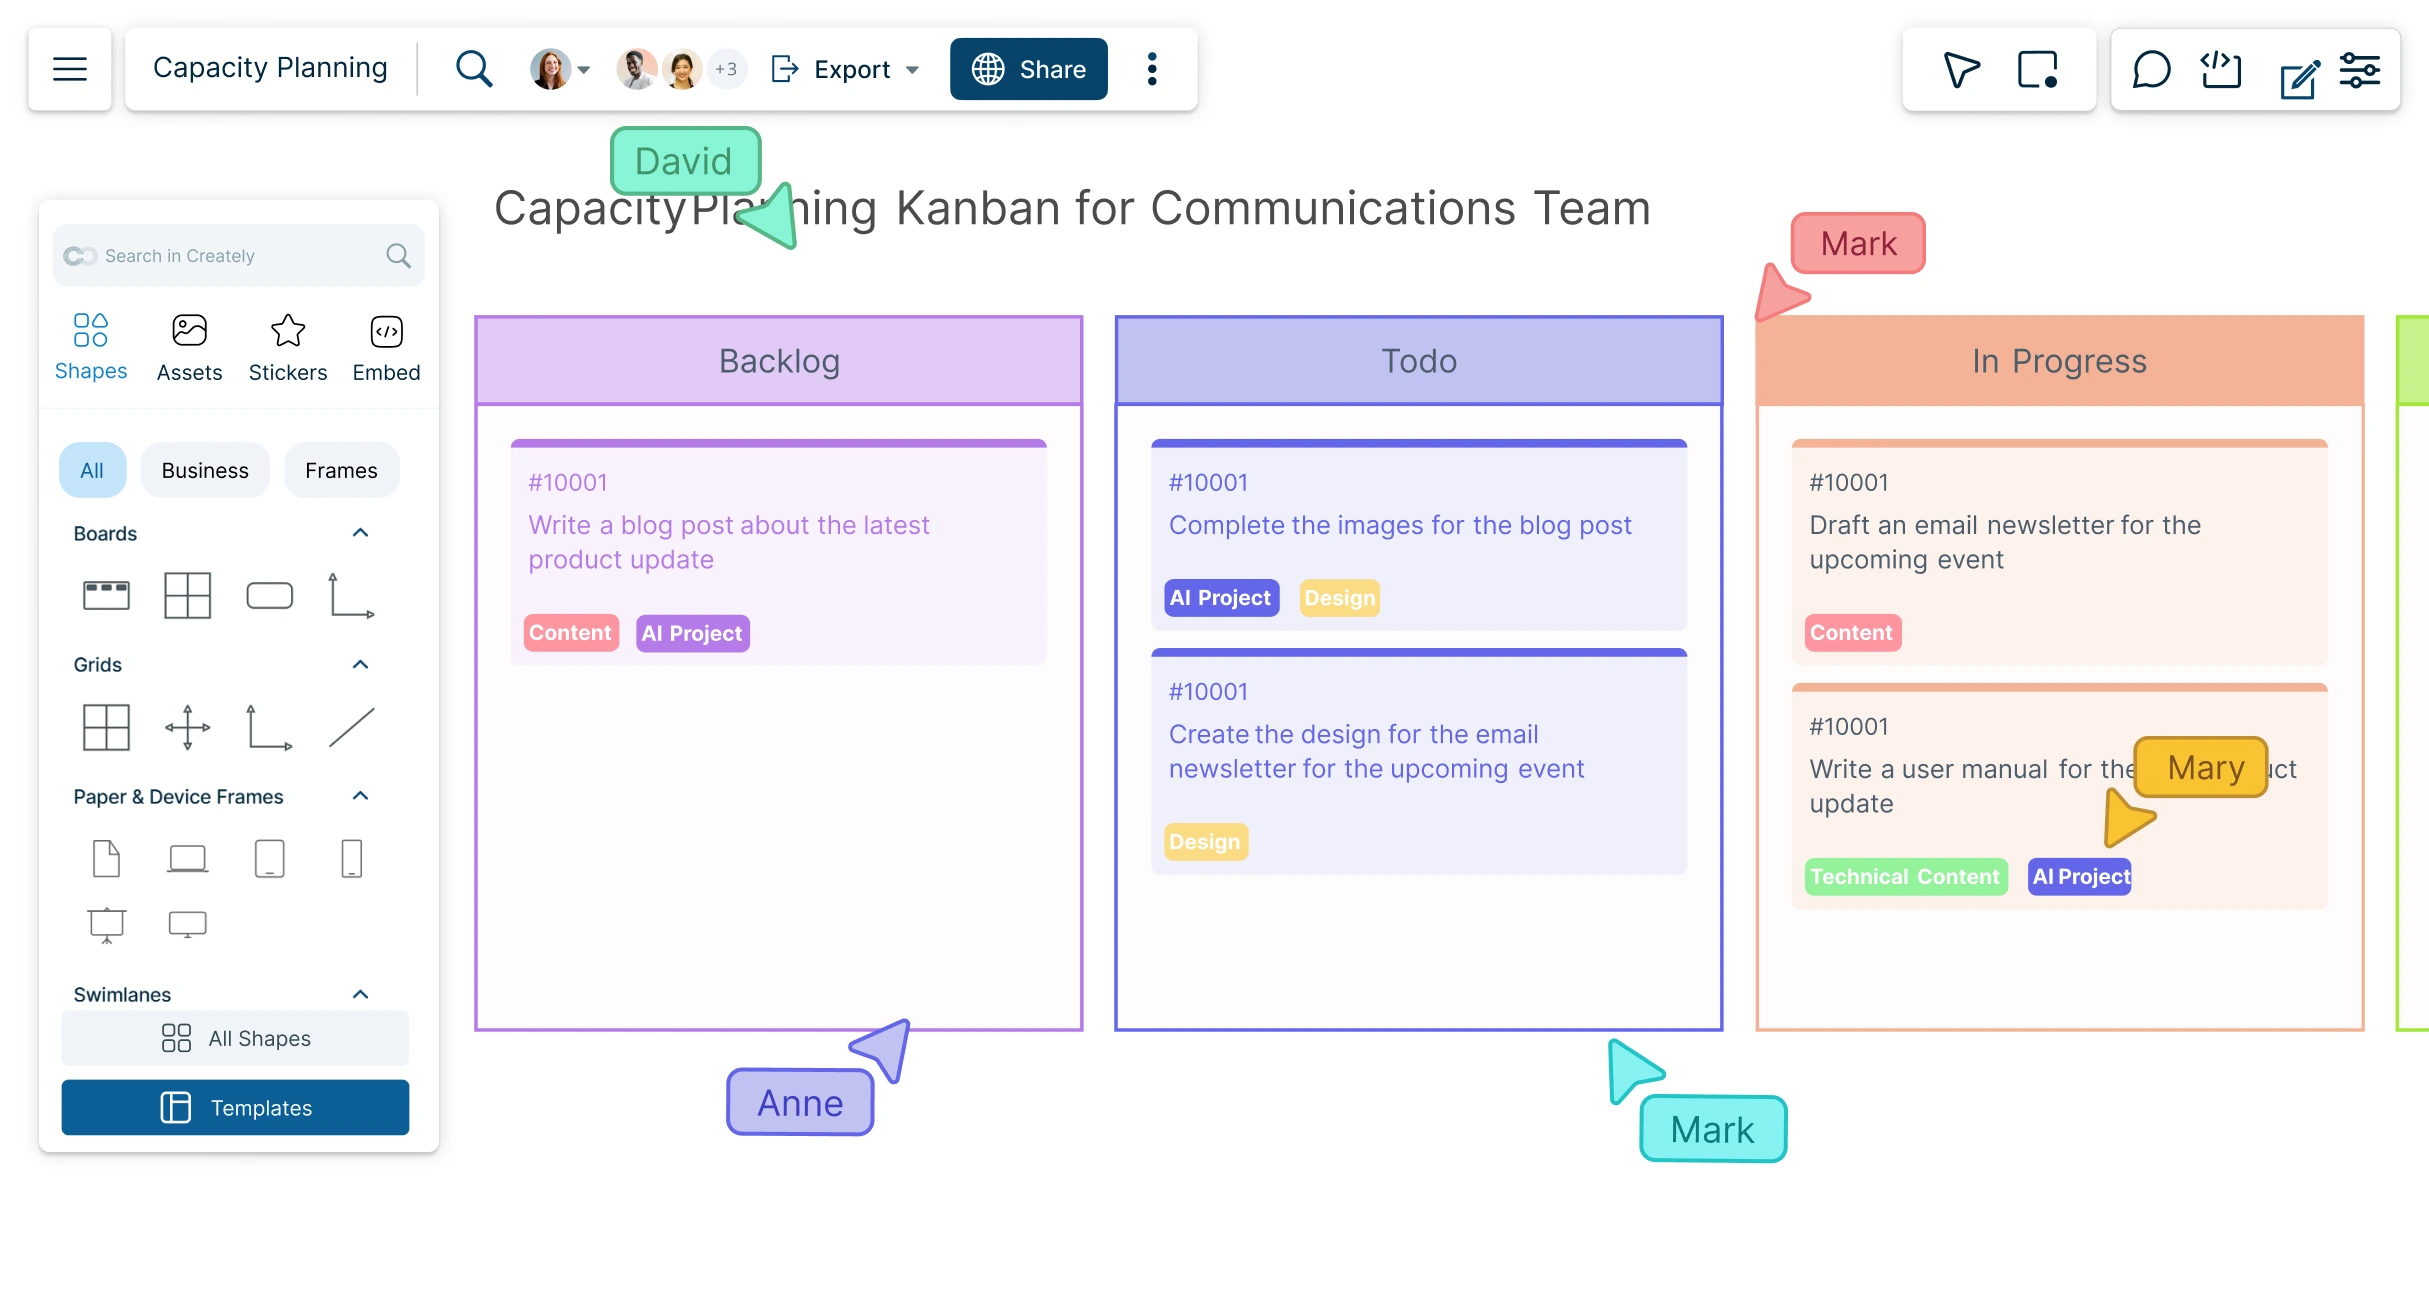
An online Kanban board to streamline projects, track task progress, and collaborate in real-time. Plan, prioritize, and get work done, visually and efficiently.
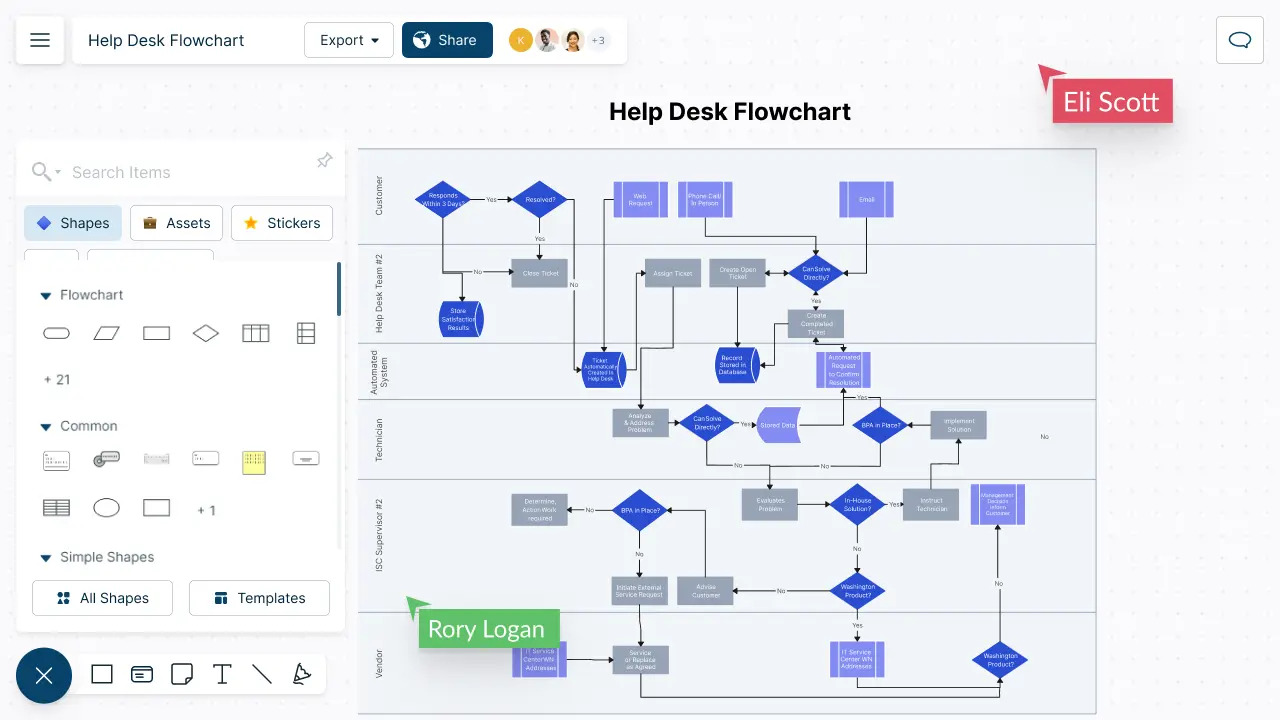
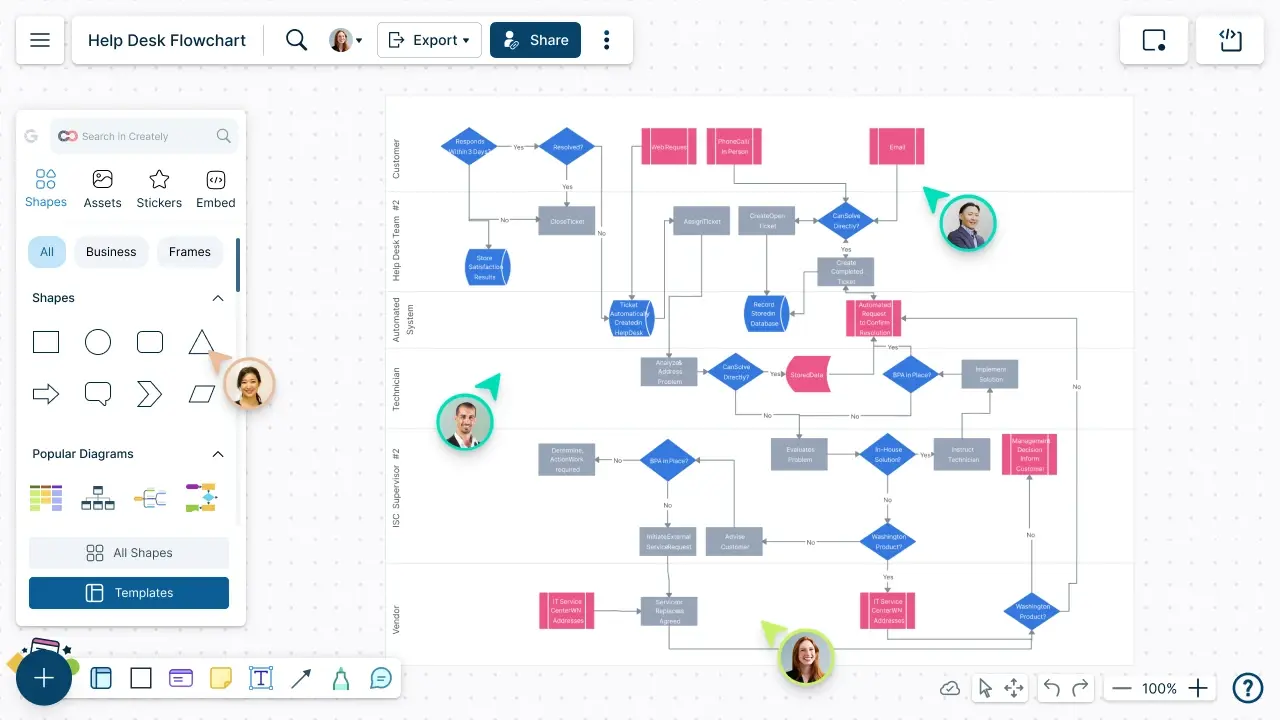
Visualize your workflows and processes to identify operational bottlenecks and areas for improvement with Creately’s Flowchart Creator.
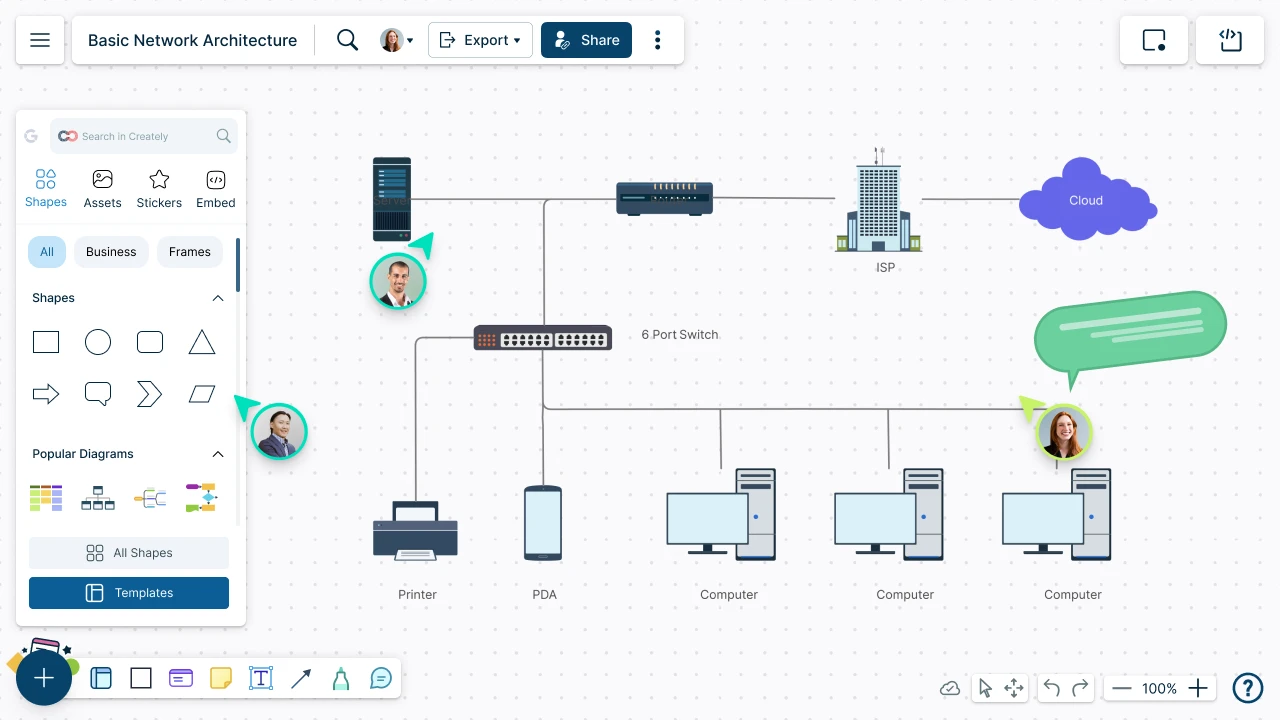
Network diagramming software that empowers you to create clear, professional network diagrams in minutes.
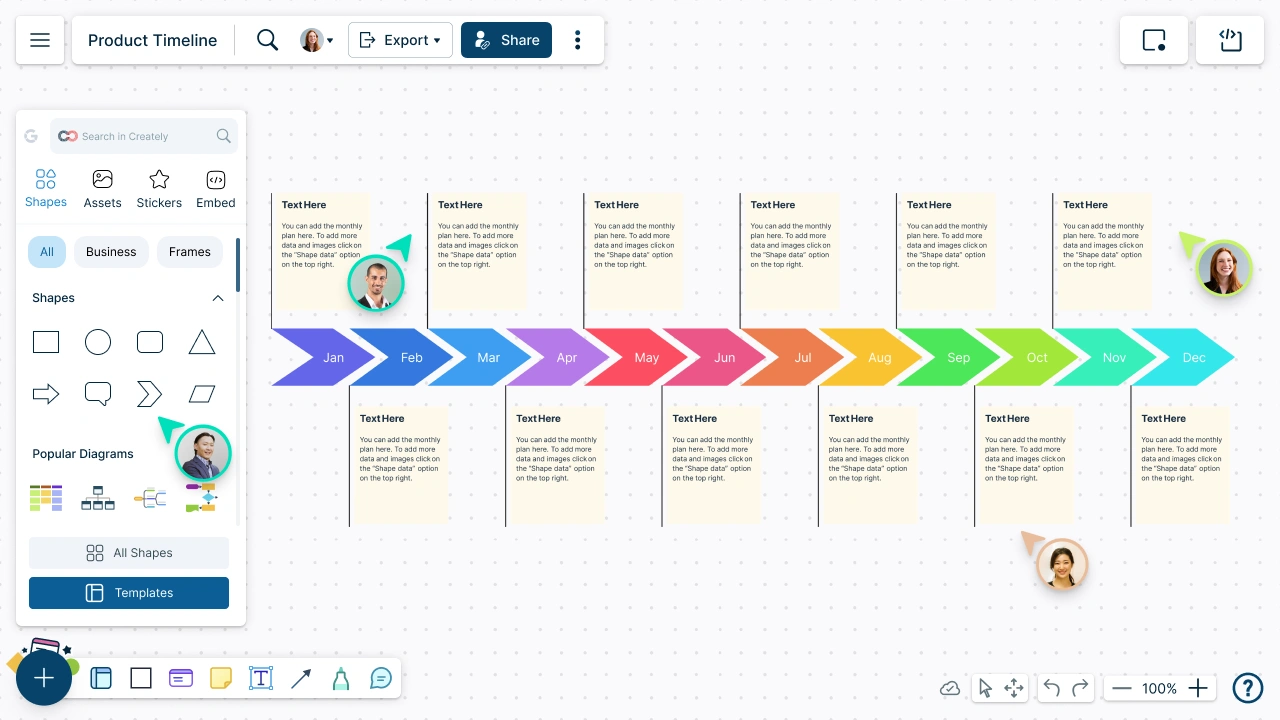
Create stunning timeline infographics for projects, presentations, and education with Creately's intuitive timeline maker. Easily highlight key milestones and collaborate with your team to transform complex information into engaging timelines that captivate your audience!
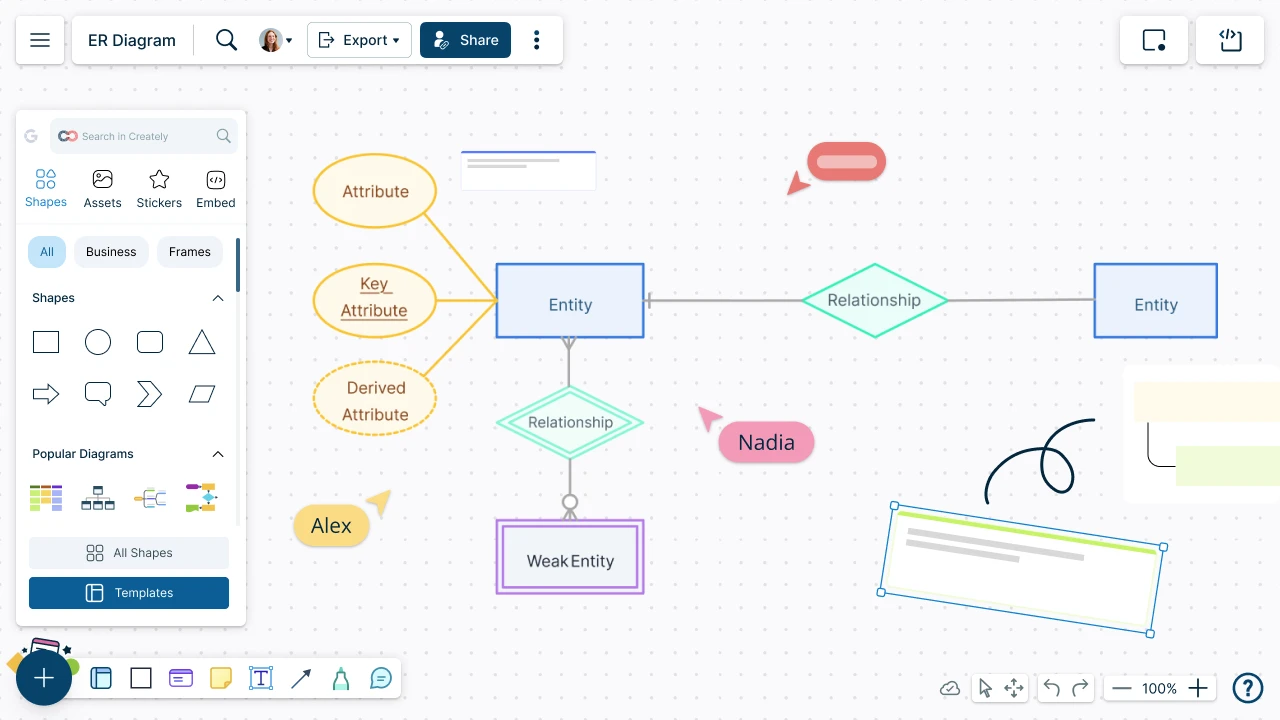
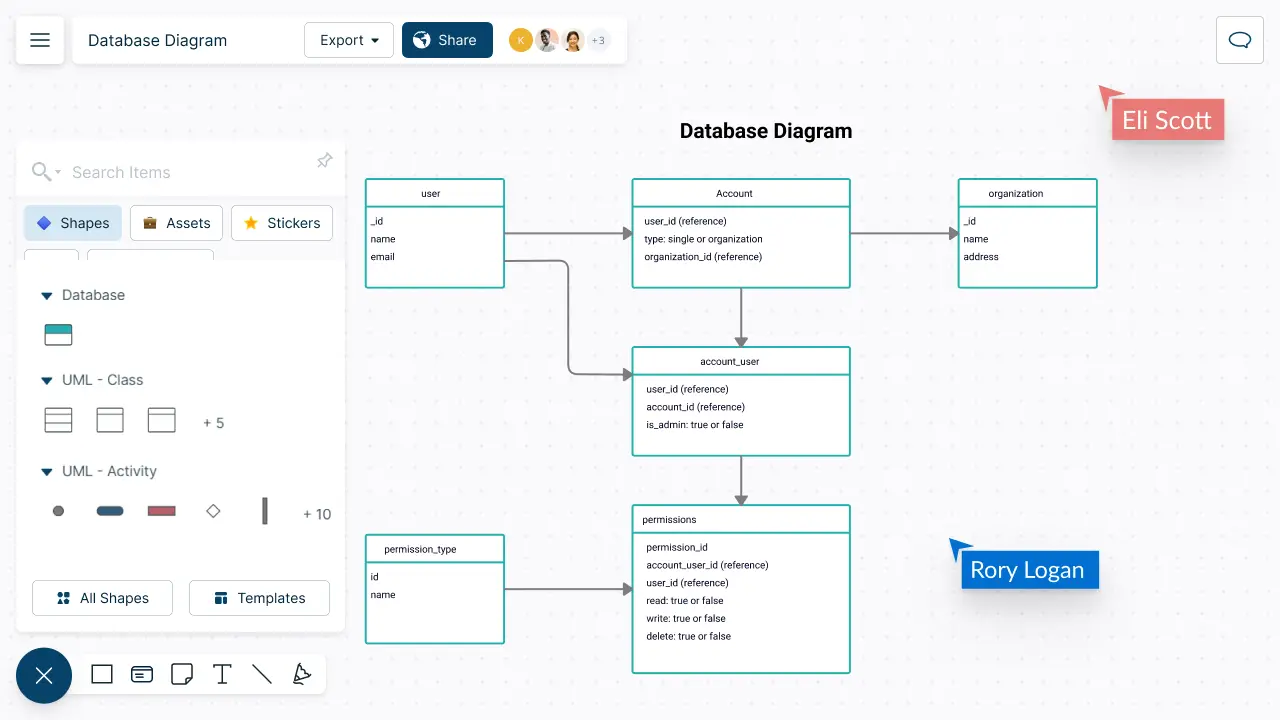
Quickly create your ER diagrams online, collaborate with your team, maintain and track changes as the design evolves.
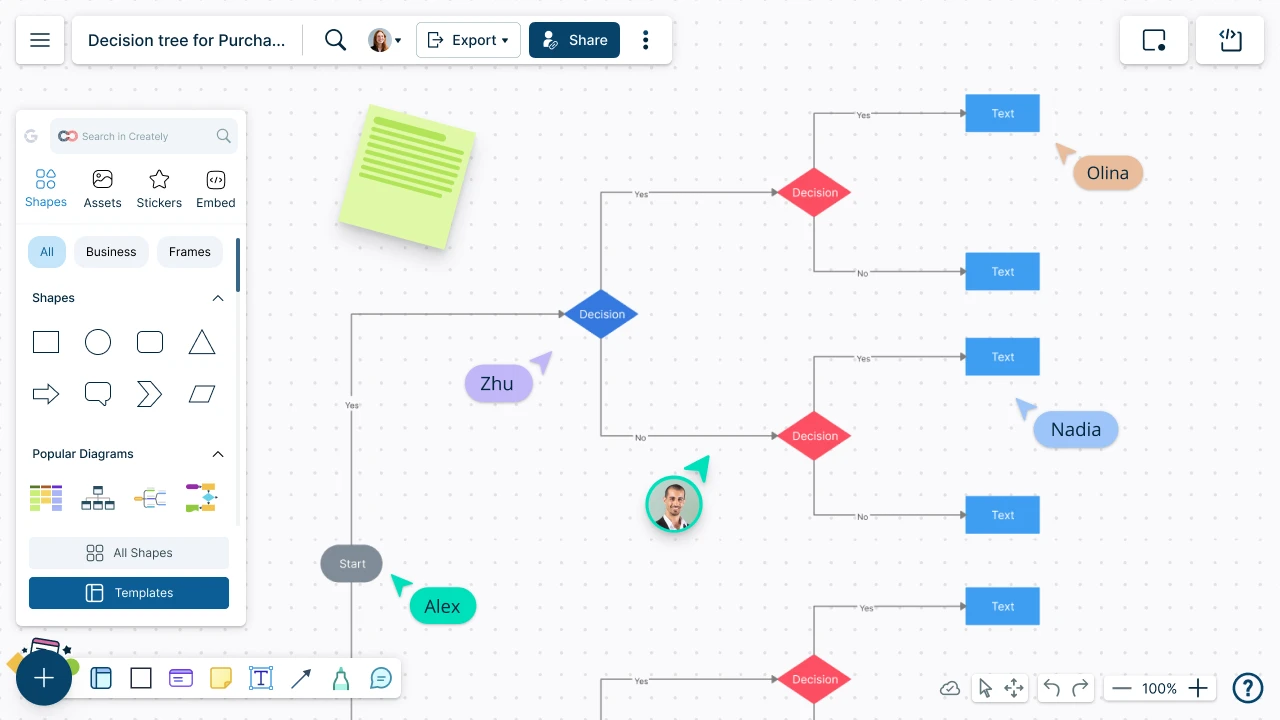
Visualize your decisions from anywhere using Creately’s decision tree diagram maker.
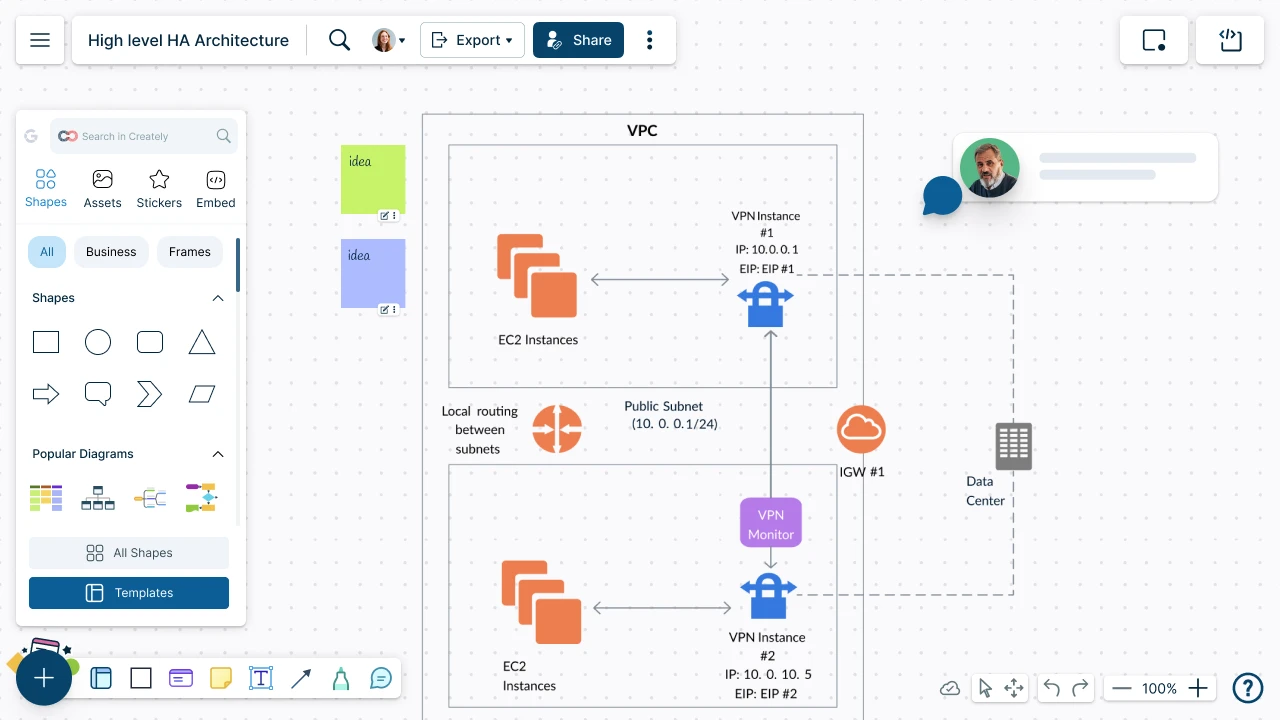
Design and Visualize your AWS cloud architecture collaboratively with your team with Creately’s AWS architecture diagram tool.
Effortlessly create and share process diagrams, improving team communication and simplifying workflows with our intuitive online tool.
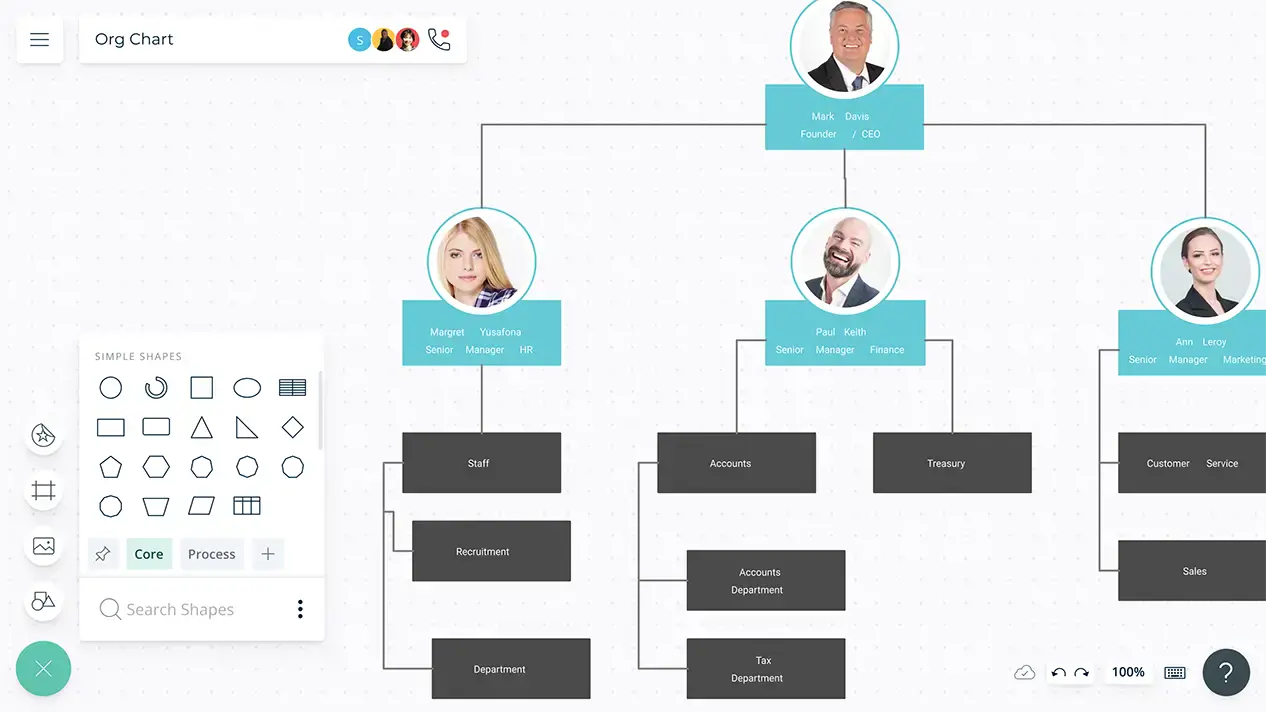
Quickly build and visualize your hierarchies with Creately hierarchy chart maker. Get clear, actionable insights into your team's structure in no time.
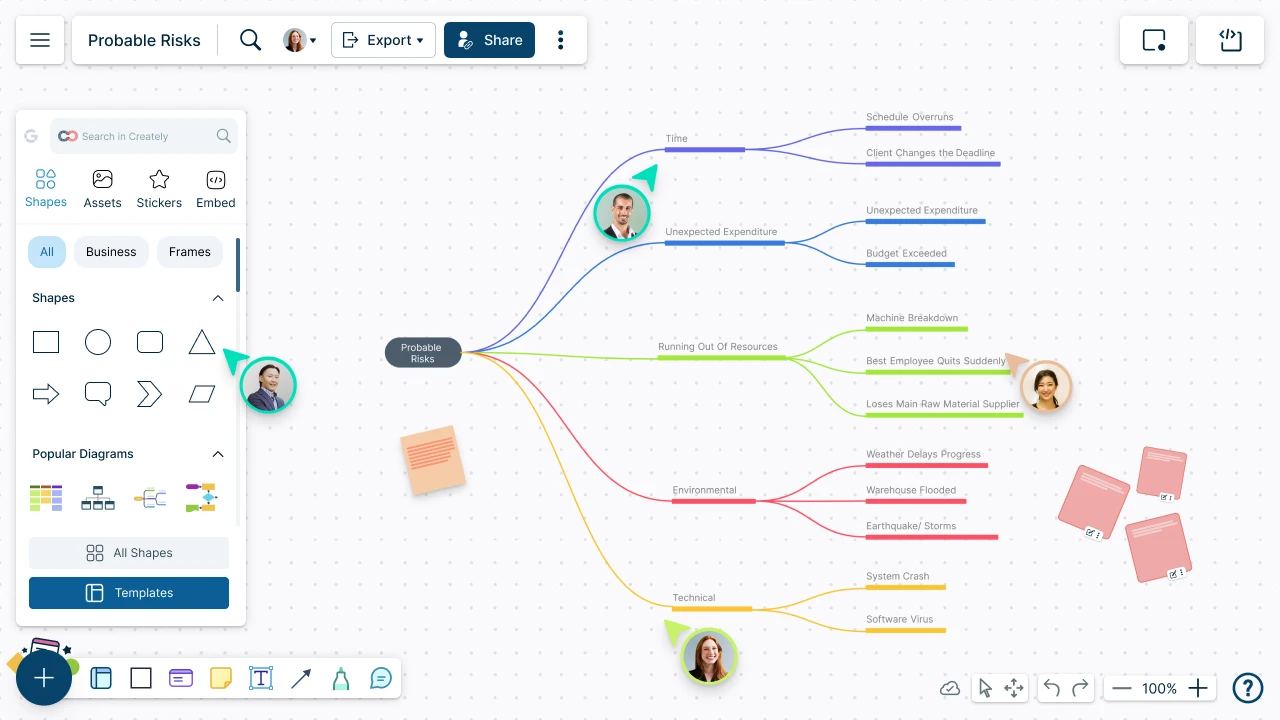
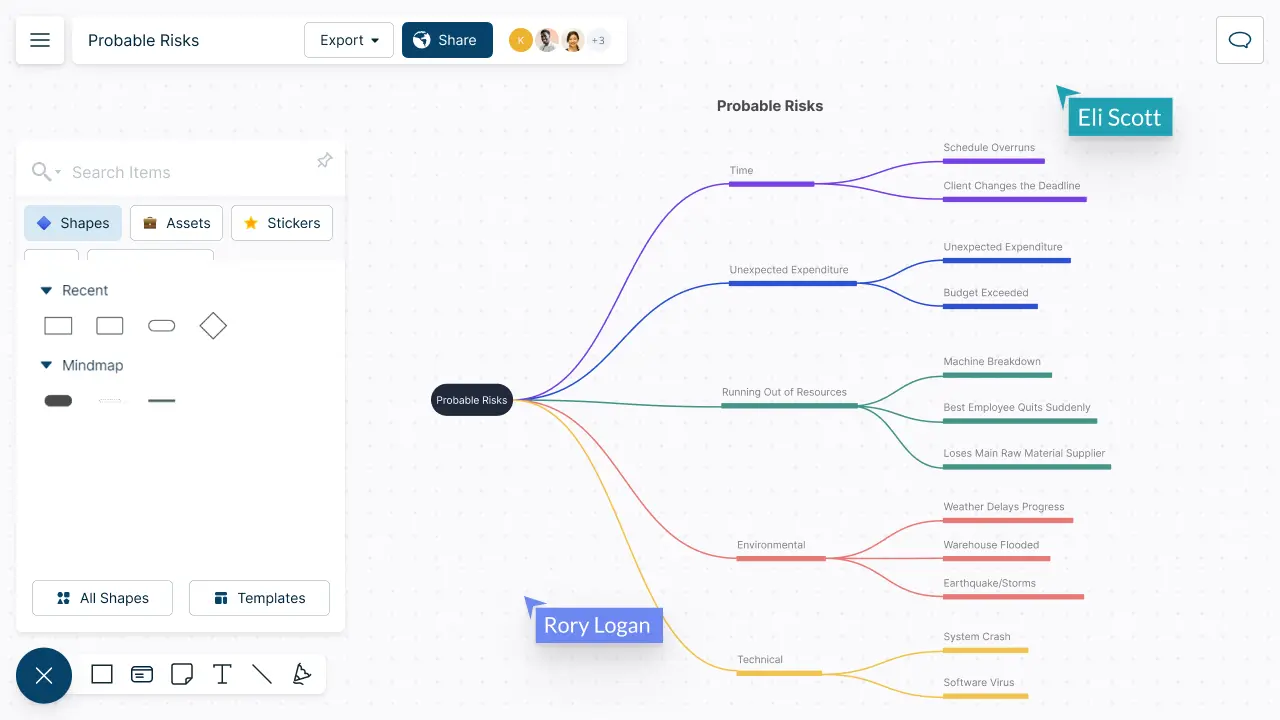
Use mind map online to visualize ideas and concepts for collaborative brainstorming, creative thinking, problem-solving, and so much more.
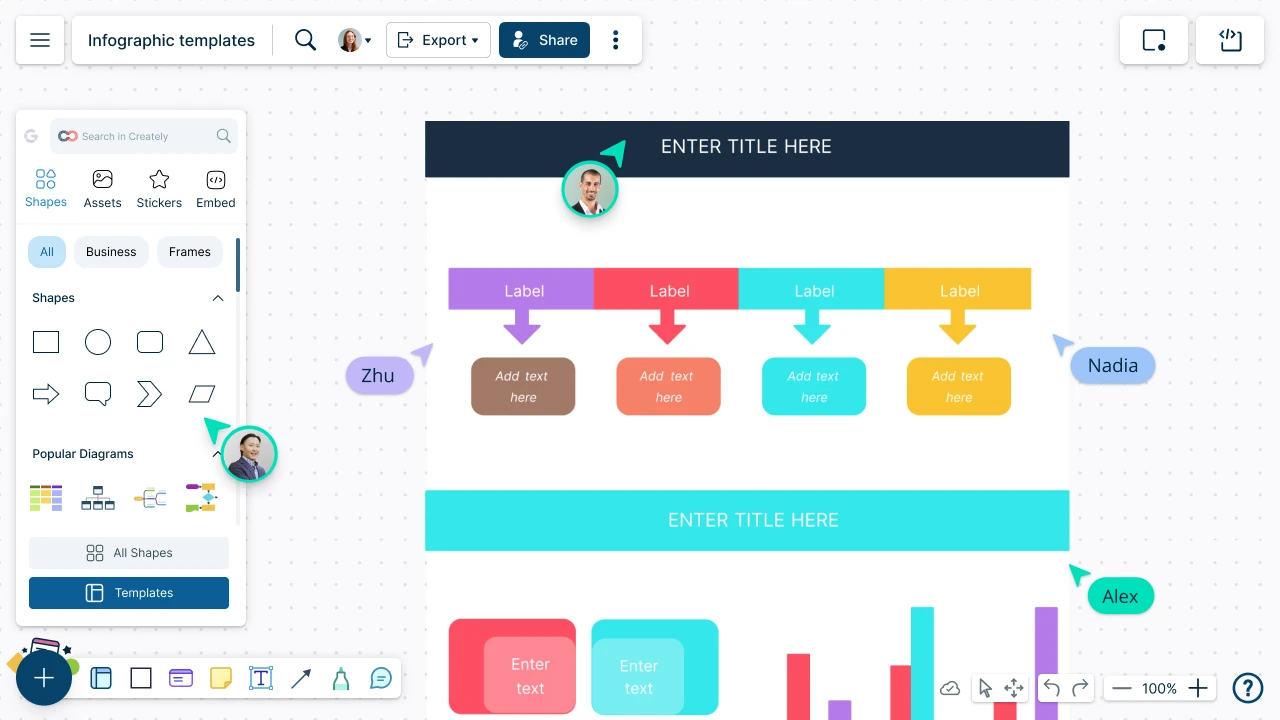
Creately’s online collaborative infographic maker helps you to design infographics with your team to illustrate complex data or information.
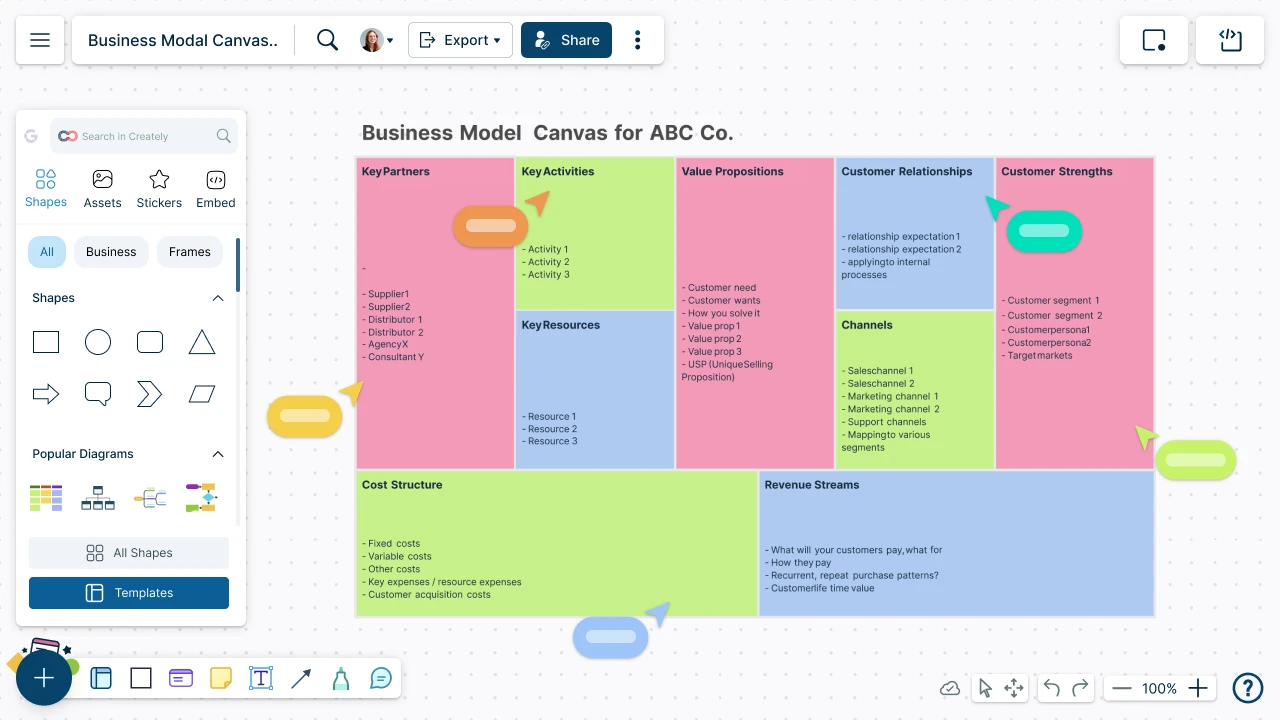
Bring together business data, processes, and information on a single business mapping software to analyze, discover breakthrough insights, and make informed strategic decisions with your team.
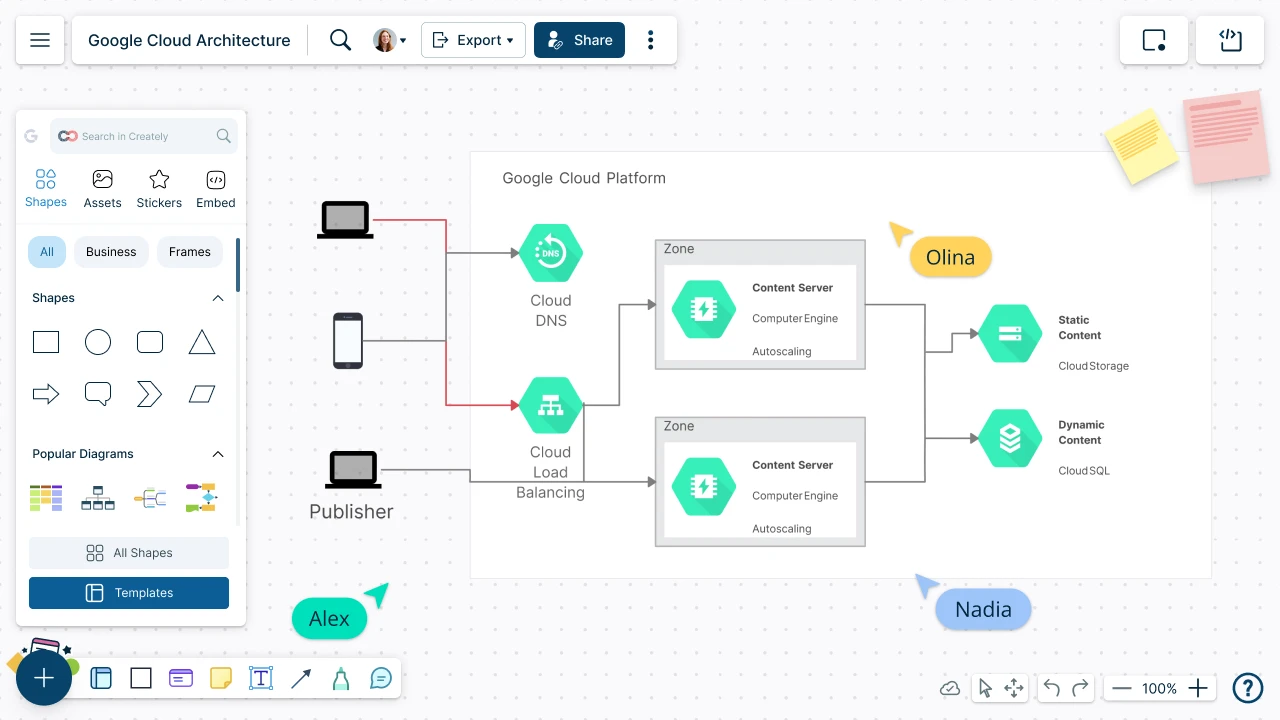
Effectively collaborate on designing, planning, and communicating the structure of your Google cloud-hosted systems and applications.
Visually map out ideas and collaborate with team members to organize and structure information, innovations and processes.
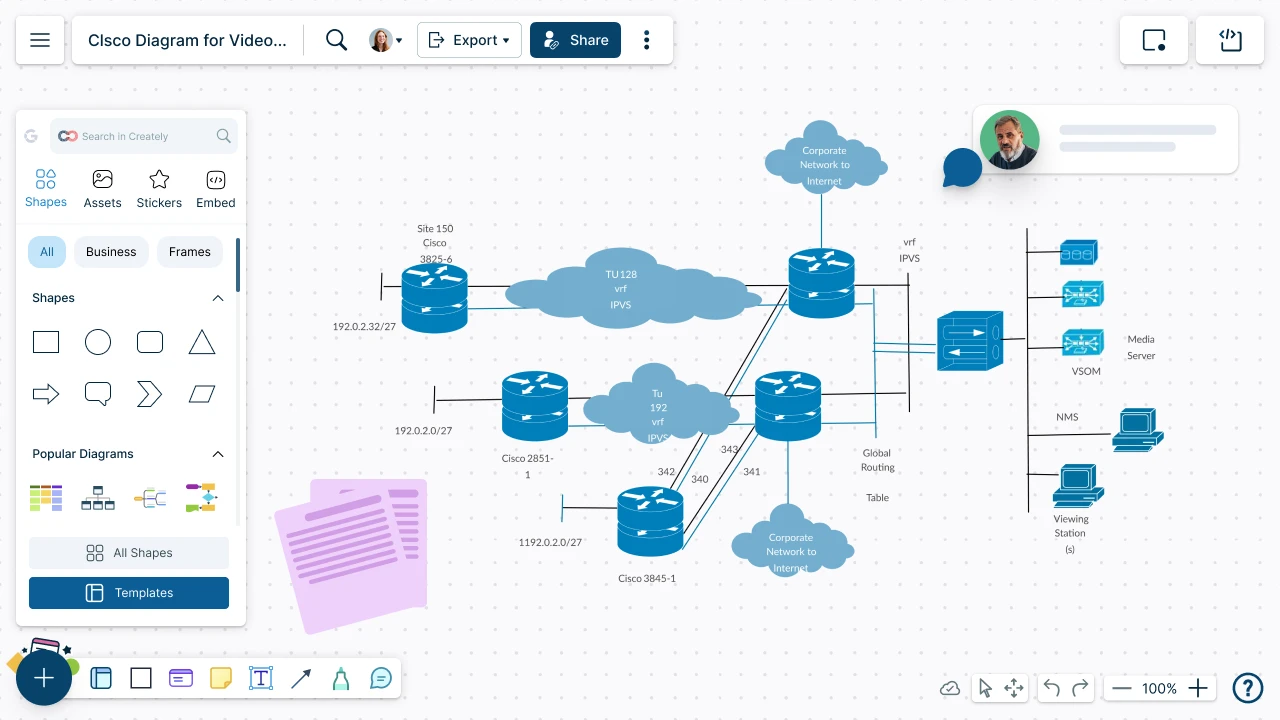
Map out network infrastructure and create a single source of truth using for Cisco networks. Collaborate with the team on the same canvas to discuss, analyze, improve, and modify network architecture.
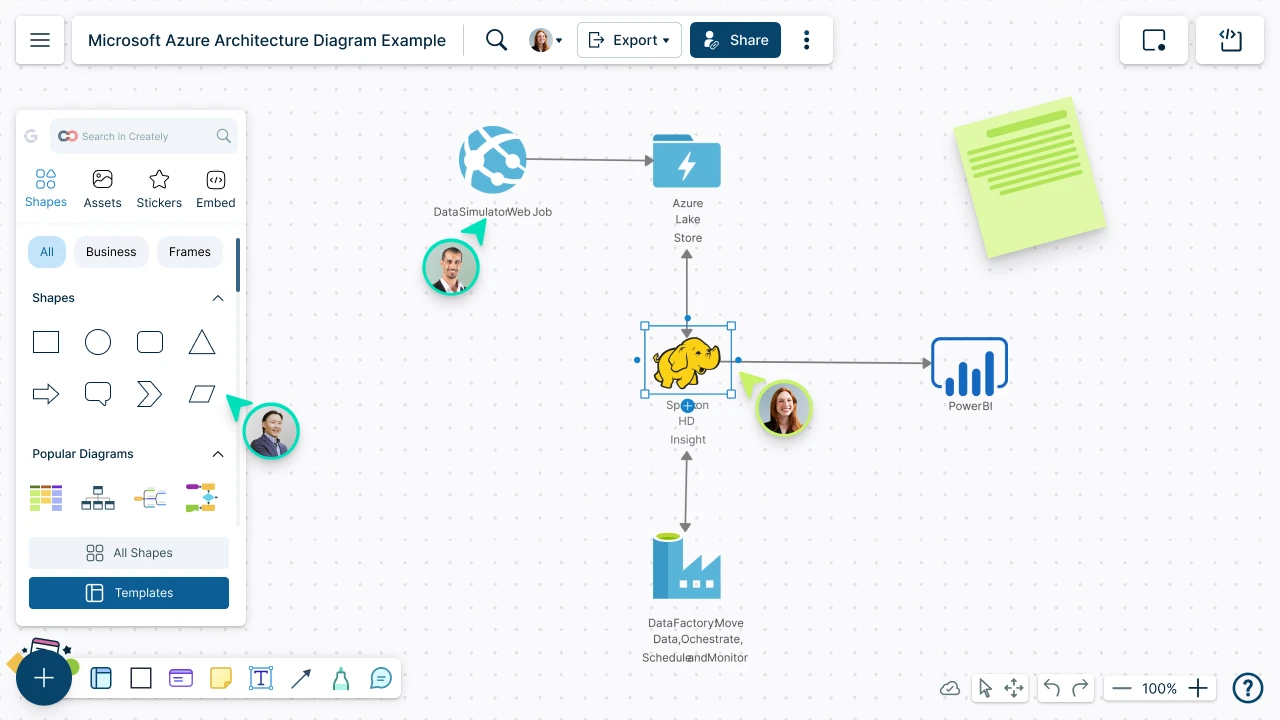
Intuitive Azure architecture diagram tool to easily document your cloud architecture. Design and optimize better Azure infrastructure solutions.
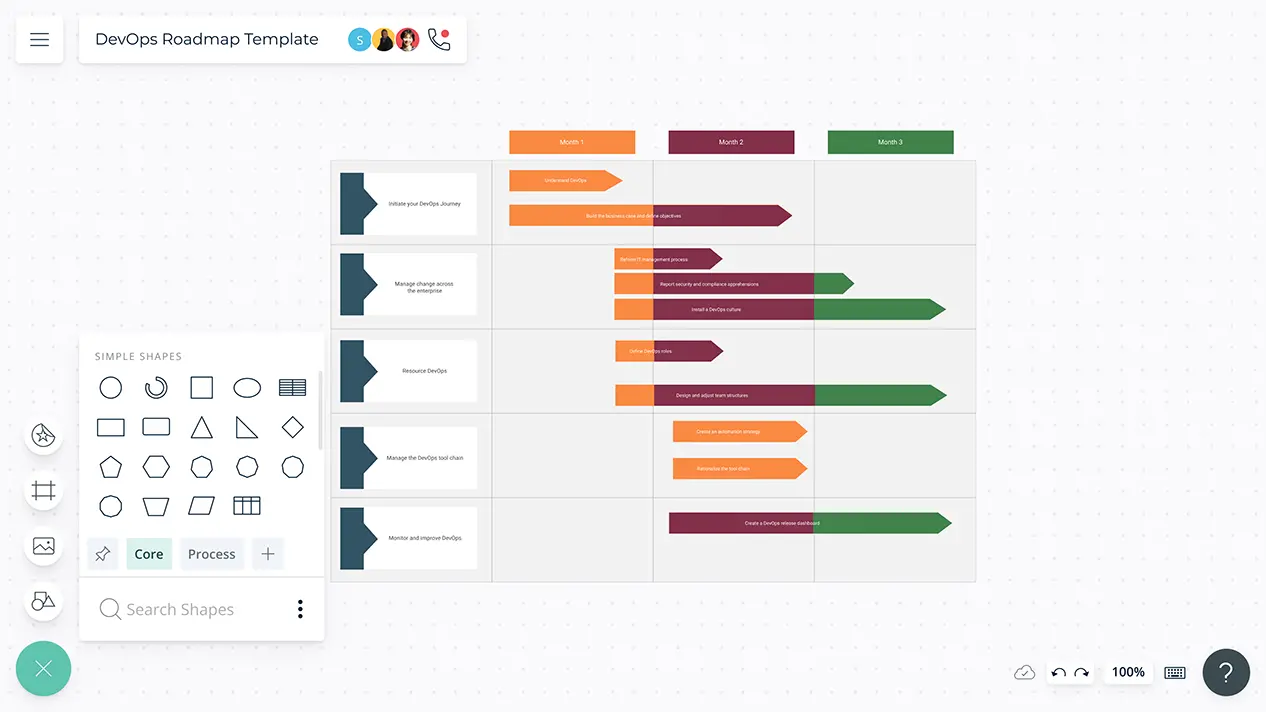
Effectively visualize your organization’s DevOps objectives & streamline team activities to manage resources properly & carry out a smooth process.
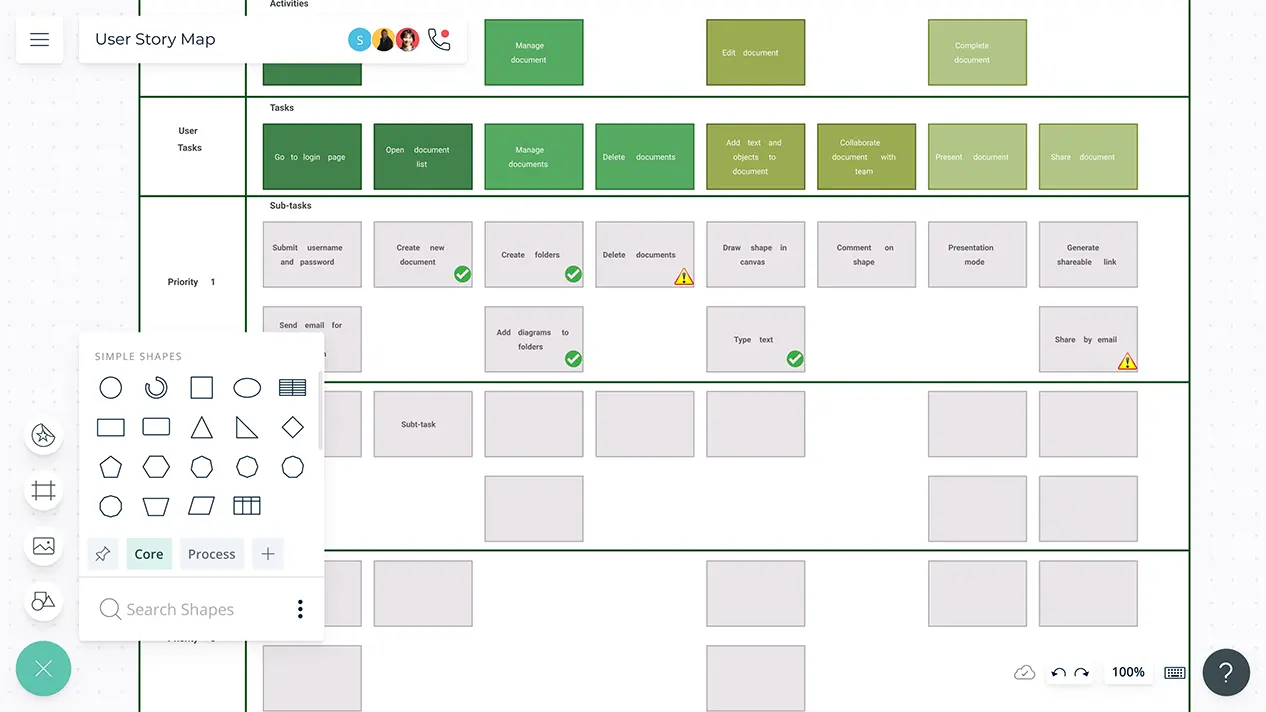
Map user stories to user journey steps, tame your agile development backlog with easy visual tools.
Create complete and accurate databases together with your team.