Data integrated org chart based planning tools.
Agile project planning with integrated task.
IT and Cloud architecture tools for all platforms.
Product Management & Software Architecture.
Brainstorm, plan campaigns and organize assets.
Process, Value chain and System analysis tools.
A visual workspace for students and educators.
Run Meetings, Workshops or get feedback.
Document, plan and optimize business.
Idea to execution on a single collaborative.
Enterprise-grade security & team collaboration.
Log In
Sign Up Free
A state diagram, also known as a state machine diagram, is a dynamic modeling tool used in system design to depict the states of an object and the transitions between these states. This visual representation helps in understanding how an object behaves in response to various events within a system. Through this blog, we will take a deep dive into state diagrams and their applications.
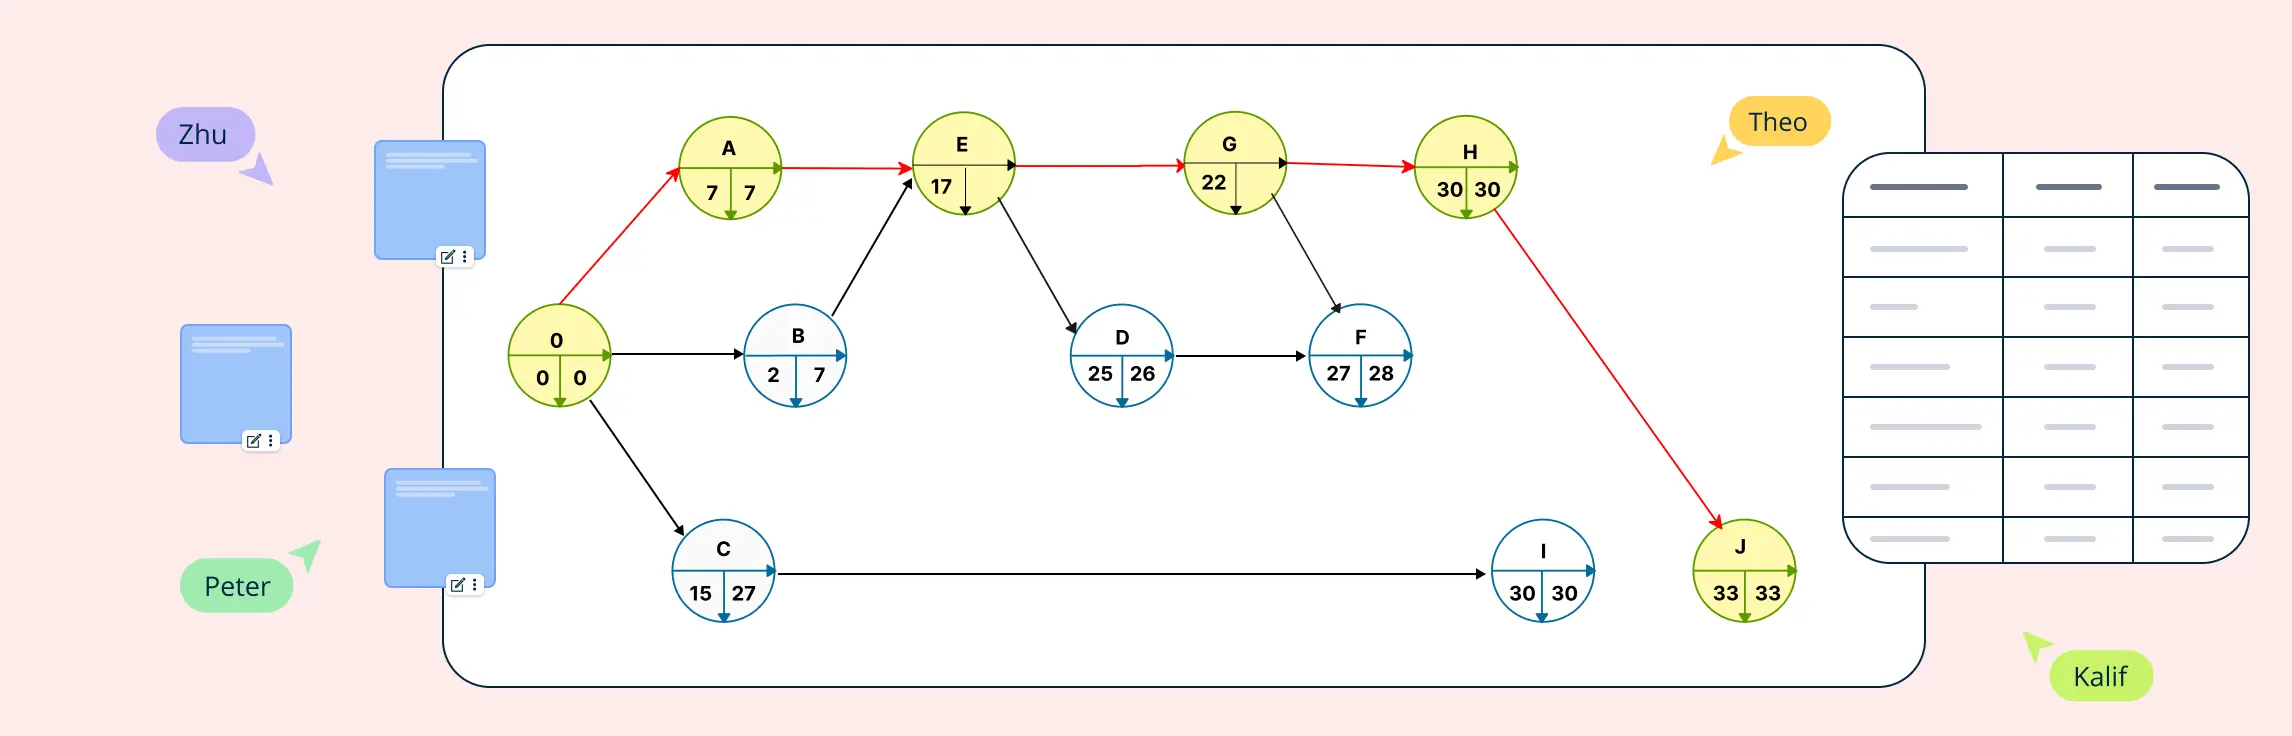
AON (Activity-on-Node) Network Diagrams are crucial tools in project management, offering a visual representation of activity relationships and dependencies. They help teams understand project sequences and connections, simplifying complex data into clear visuals. AON diagrams improve scheduling, resource allocation, and risk management. With tools like Creately, creating these diagrams becomes easier, offering templates for effective workflow visualization. The diagrams consist of nodes representing activities and arrows indicating relationships, providing a clear map of project tasks.
Before a single line of code can be written, it is crucial to have a well-organized structure. The backbone of any successful project lies in its planning and organization, and this is where a programming flowchart emerges as a key player. Serving as a blueprint, a flowchart for programming guides developers through the labyrinthine process of writing code, transforming the way programs are conceptualized and executed. By using a well-structured coding flowchart, developers can streamline the programming process, reduce errors, and ensure clarity in execution. In this exploration, we will delve into the top benefits of utilizing a flowchart for programming, with a special focus on its significance in C programming and how tools like Creately enhance the entire process.
Class diagrams are the main building blocks of object-oriented modeling so it is important that you understand the various class diagram relationships and how they affect your solution. We have listed them below with examples.
Imagine having a website that portrays your brand perfectly, drives traffic and turns the audience into loyal customers. Your company website is a key gateway to reach potential customers. How do you build a perfect website? The answer lies in understanding the phases of website designing and implementing the best practices that make your online presence truly exceptional.
This sequence diagram tutorial is to help you understand sequence diagrams better; to explain everything you need to know, from how to draw a sequence diagram to the common mistakes you should avoid when drawing one.
Activity diagrams can be used in all stages of software development and for various purposes. And because they are a lot similar to flowcharts, they are generally more popular than other UML diagram types.
Wireframes function as a bridge between raw creative thoughts and the final product. Think of wire-frames as architectural blueprints for a building and you’ll understand why it is a critical tool in just about any development project. The fact is, constructing a decent, structurally sound building without using blueprints is inconceivable, and no sane real estate developer will partner with a construction outfit that does not use blueprints. Considering the vast number of wire-frame benefits, you should ignore them at your peril.
User Flow Diagram Definition A user flow can refer to the overall navigation paths available in a product, the actual experience of moving through a process, or the specific steps a user takes to complete a task. Tools like flowcharts are effective for visualizing these user journeys within a website or app, helping to trace how users interact with various interface elements and features.
UML is a versatile visual language that is used to model a software system. The software industry has been divided in its opinion regarding the use of UML diagrams. While some see it as an integral part of software systems and development, there are a significant number of people that deem it completely unnecessary.
UML as a subject is extremely vast, which is why this particular post is divided into two different parts. While I won’t be getting into the very basic aspects of UML diagrams today, I thought it would be pertinent to elaborate on the different types of UML diagrams and what exactly they should be used for. As most diagrammers may be aware, UML diagrams are generally divided into two main categories, i.e. Structural Diagrams and Behavioural Diagrams. While this post will concentrate on the former, expect to read all about the latter tomorrow in Part 2 of this series. So if you’re a newbie when it comes to all things UML, this really is the perfect starting point for you.