Flowchart is a structured visual representation of a process, system, or algorithm. It illustrates a sequence of steps using standardized flowchart symbols, such as rectangles for actions, diamonds for decision points, and arrows to indicate the process flow. By breaking down complex workflows into clear, logical steps, a flowchart diagram helps users quickly understand and analyze a process. A well-structured flowchart design provides clarity and ensures a structured approach to problem-solving.
Flowchart Symbols
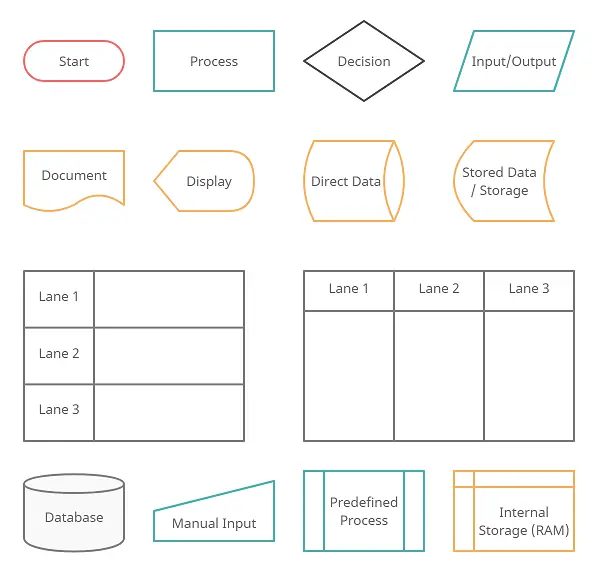
Flowcharts use a variety of symbols to represent different elements of a process. Each symbol has a specific meaning, helping to clearly communicate actions, decisions, or data flows within the chart. Here’s a quick overview of the most commonly used symbols:
| Symbol | Description |
|---|---|
| Terminal/Terminator | Marks the start or end of a process. |
| Process (Rectangle) | Represents a task, action, or operation in the flow. |
| Data (I/O) | Indicates inputs to and outputs from a process, shaped like a parallelogram. |
| Decision (Diamond) | Represents a decision point, with arrows branching based on the answer (e.g., yes/no). |
| Document | Symbolizes a report or document, shown as a rectangle with a wavy bottom. |
| Stored Data | Represents general data storage. |
| Direct Data | Symbolizes data stored on devices like a hard drive. |
| Internal Storage | Common in programming, represents data stored in memory (RAM). |
These common symbols are used to building an accurate and understandable flowchart. There are more key flowchart symbols used for more complex processes and industries.
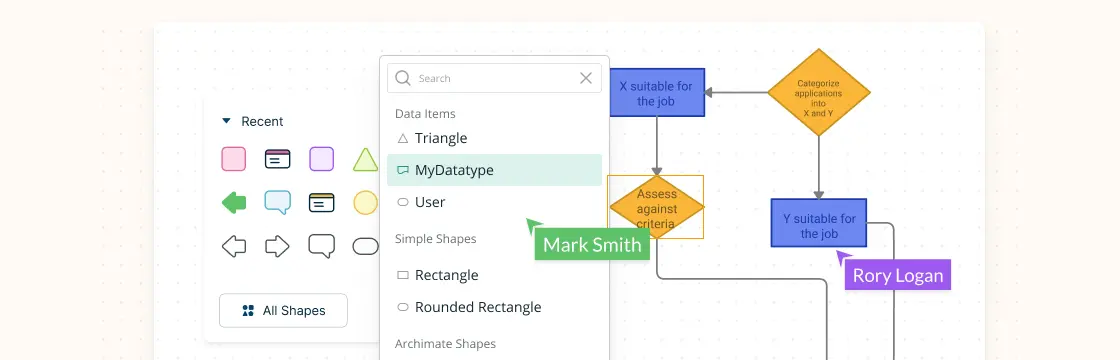
How to Make a Flowchart with Creately
Creating a flowchart is a straightforward process when you have the right tools. Whether you’re starting from scratch or using a ready-made flowchart template, following a structured approach ensures clarity and accuracy.
Step 1: Define the Purpose of Your Flowchart
Before you begin, determine the goal of your flowchart design. Are you mapping out a business workflow, a software process, or a troubleshooting flowchart guide? Understanding the objective will help you choose the right flowchart type and symbols.
Step 2: Identify the Key Steps
List the main steps involved in the process. Break down complex workflows into smaller, manageable tasks. Ensure each step logically connects to the next to maintain clarity in your flowchart diagram.
Step 3: Choose a Flowcharting Tool
To create a professional flowchart, use an intuitive diagramming tool like Creately. You can:
- Start from scratch: Sign in to Creately and open a blank canvas to manually design your flowchart using drag-and-drop elements.
- Use templates: Select from a range of flowchart templates to save time and maintain consistency in your design.
Step 4: Add Flowchart Symbols
Use standard flowchart symbols to represent different steps in your process. Arrange the symbols logically and ensure the sequence accurately represents the workflow.
Step 5: Connect the Elements
Use arrows to establish the flow between steps. Ensure connections are clear and do not overlap excessively to maintain readability. If there are multiple pathways, label them appropriately for easy understanding.
Step 6: Review and Refine
Before finalizing your flowchart, check for errors or missing steps. Ask a colleague to review it to ensure it accurately represents the process. Adjust the layout for better readability if needed.
Step 7: Save, Share, and Export
Once complete, save your flowchart on Creately for future editing. You can also export it in various formats (PDF, PNG, or SVG) or share it with your team for collaboration.
Types of Flowcharts
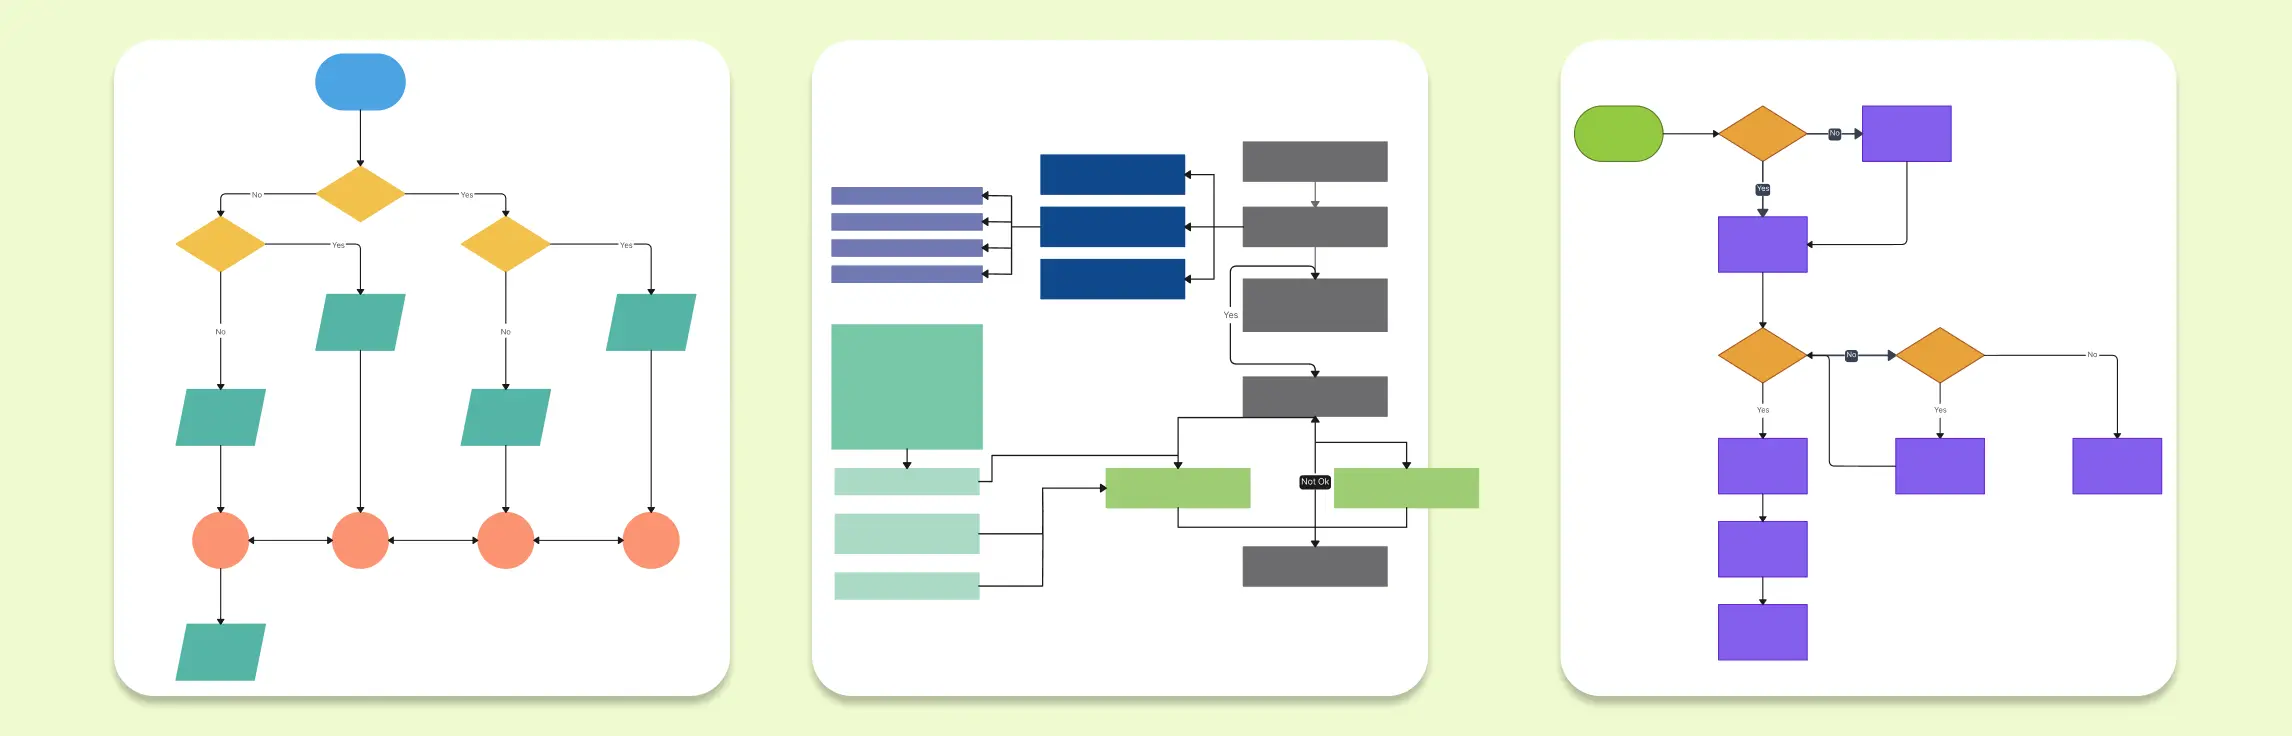
Flowcharts come in various types, each serving a specific purpose in visualizing processes. Below are some of the basic types of flowcharts that are commonly used across industries.
1. Process Flowchart
A process flowchart represents a step-by-step sequence of actions involved in completing a task or workflow. It is widely used in business operations, manufacturing, and quality control to analyze and optimize processes. Process flowcharts help identify inefficiencies, redundancies, and areas for improvement.
2. Workflow Diagram
A workflow diagram illustrates how tasks, information, and documents move through a system or between individuals. It is often used in business process management (BPM) and project management to improve collaboration, streamline tasks, and ensure the smooth execution of processes.
3. Decision Flowchart
A decision flowchart is used to map out decision-making processes. It includes multiple decision points, each leading to different outcomes based on predefined conditions. These flowcharts are helpful in troubleshooting, problem-solving, and designing business rules or policies.
4. Data Flow Diagram (DFD)
A data flow diagram (DFD) focuses on how data moves within a system, showing data inputs, outputs, storage, and processing. It is widely used in software development, system design, and database modeling to visualize the flow of information between different components.
5. Swimlane Flowchart
A swimlane flowchart organizes a process into lanes or sections, each representing a person, team, or department responsible for specific tasks. This type of flowchart is useful in cross-functional workflows, as it helps clarify roles, responsibilities, and dependencies between different stakeholders.
6. Algorithm Flowchart
Algorithm flowcharts are commonly used in computer programming, mathematics, and engineering. They visually represent the logical sequence of steps needed to solve a problem or perform a computation. These flowcharts help in structuring code and debugging errors before implementation.


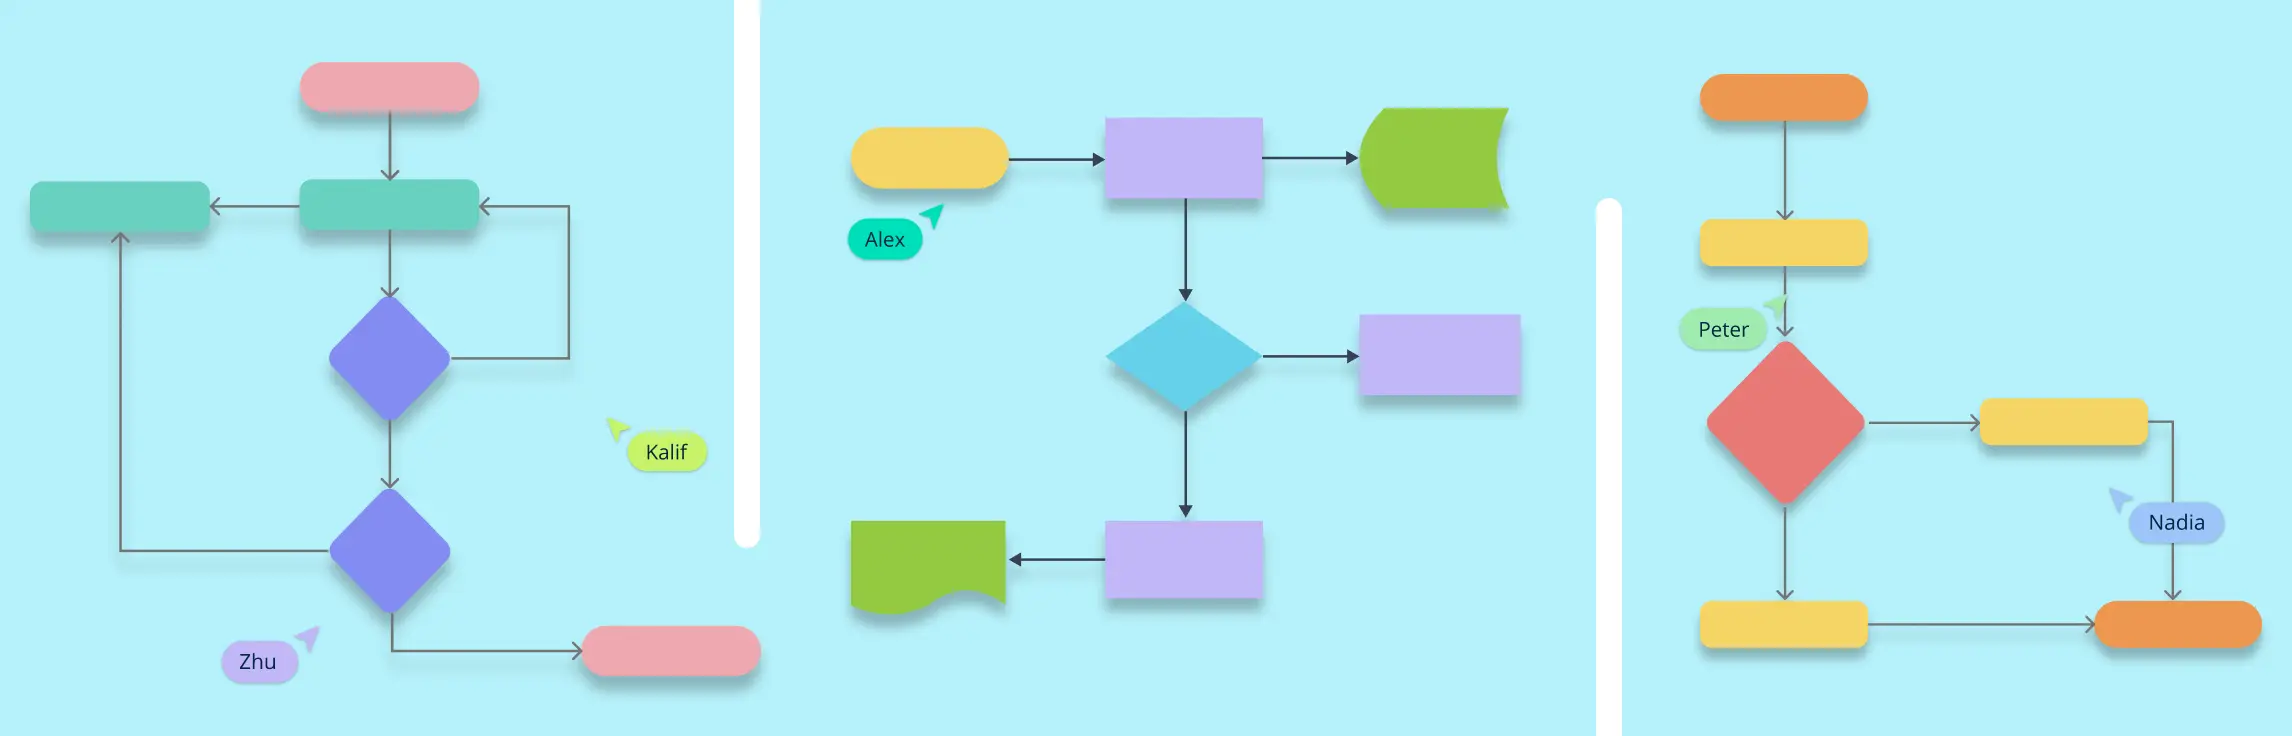
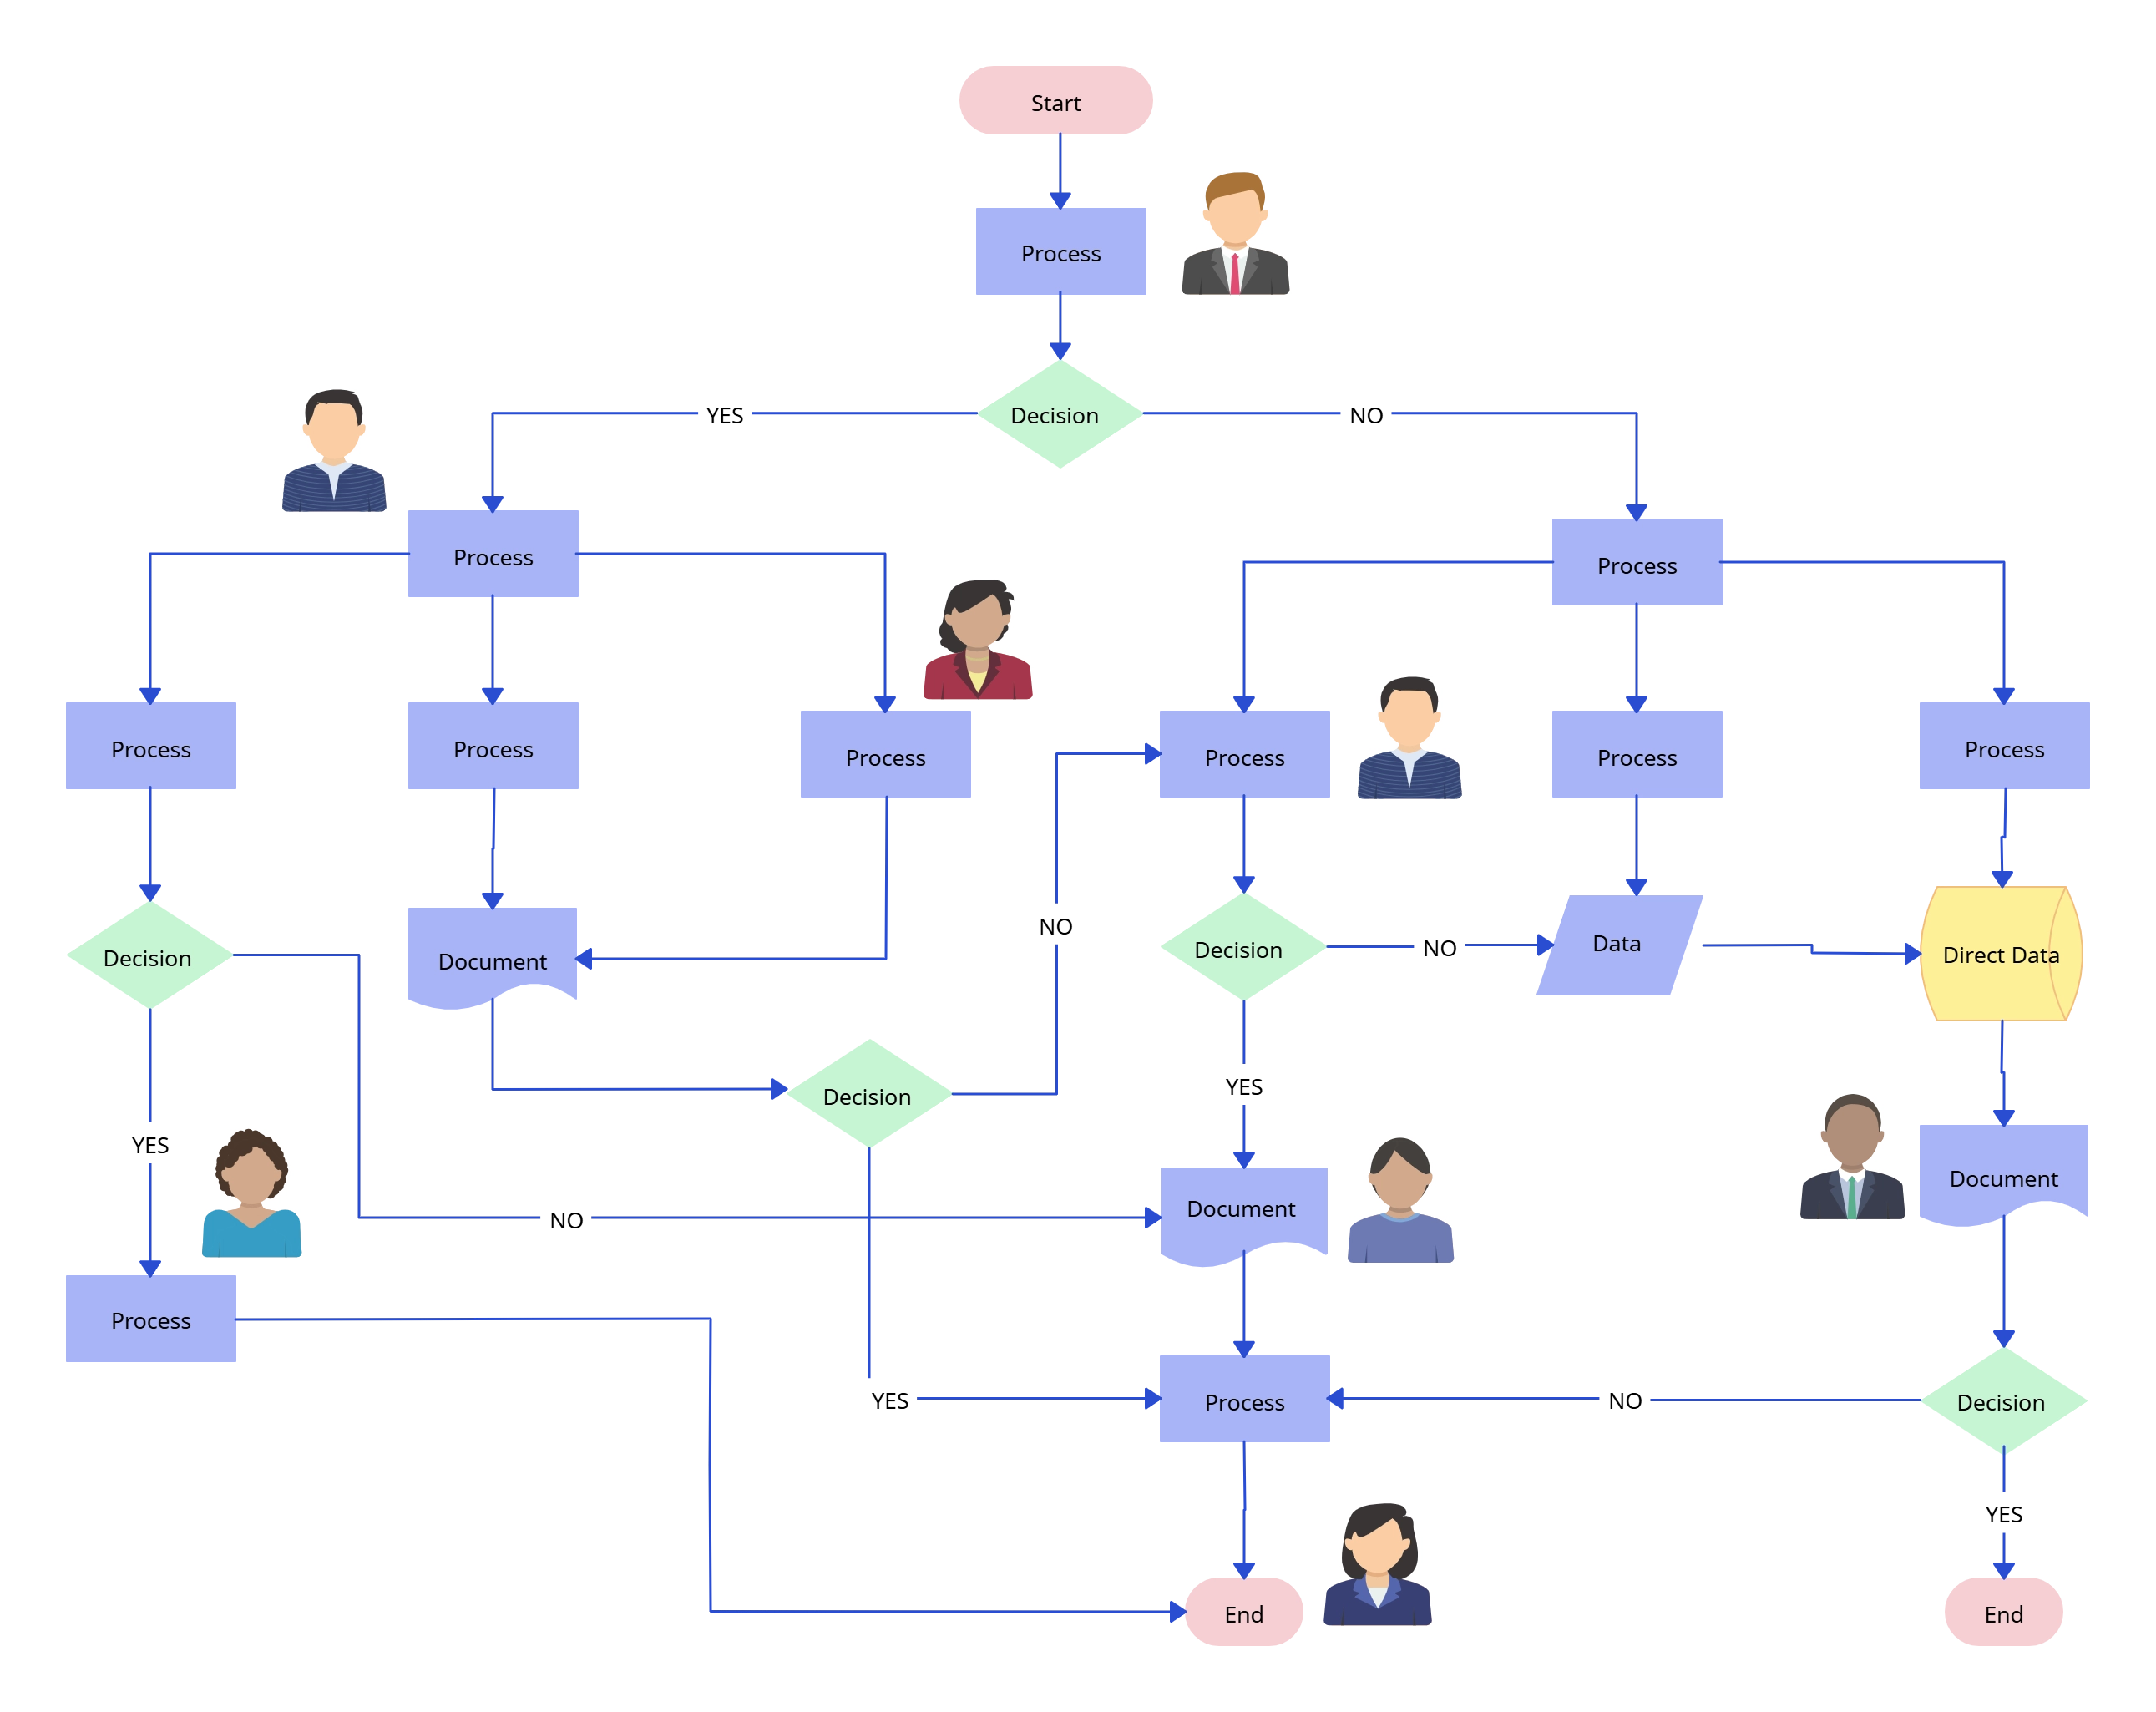
Flowchart Templates and Examples
Creating a flowchart from scratch can be time-consuming, but using flowchart templates streamlines the process. Below, you’ll find a collection of ready-to-use flowchart examples designed for various use cases, including business workflows, software development, decision-making, and process optimization.


AI Flowcharts: Smarter Way to Visualize Processes
AI-powered flowcharts are transforming the way businesses and professionals create, analyze, and optimize workflows. With intelligent automation, AI flowchart tools can generate flowcharts instantly, suggest improvements, and even detect inefficiencies in processes.
Benefits of AI Flowcharts
- Automated Generation – AI can quickly convert text-based inputs, data, or prompts into structured flowcharts, saving time and effort.
- Smart Recommendations – AI-powered tools analyze processes and suggest optimizations to improve efficiency.
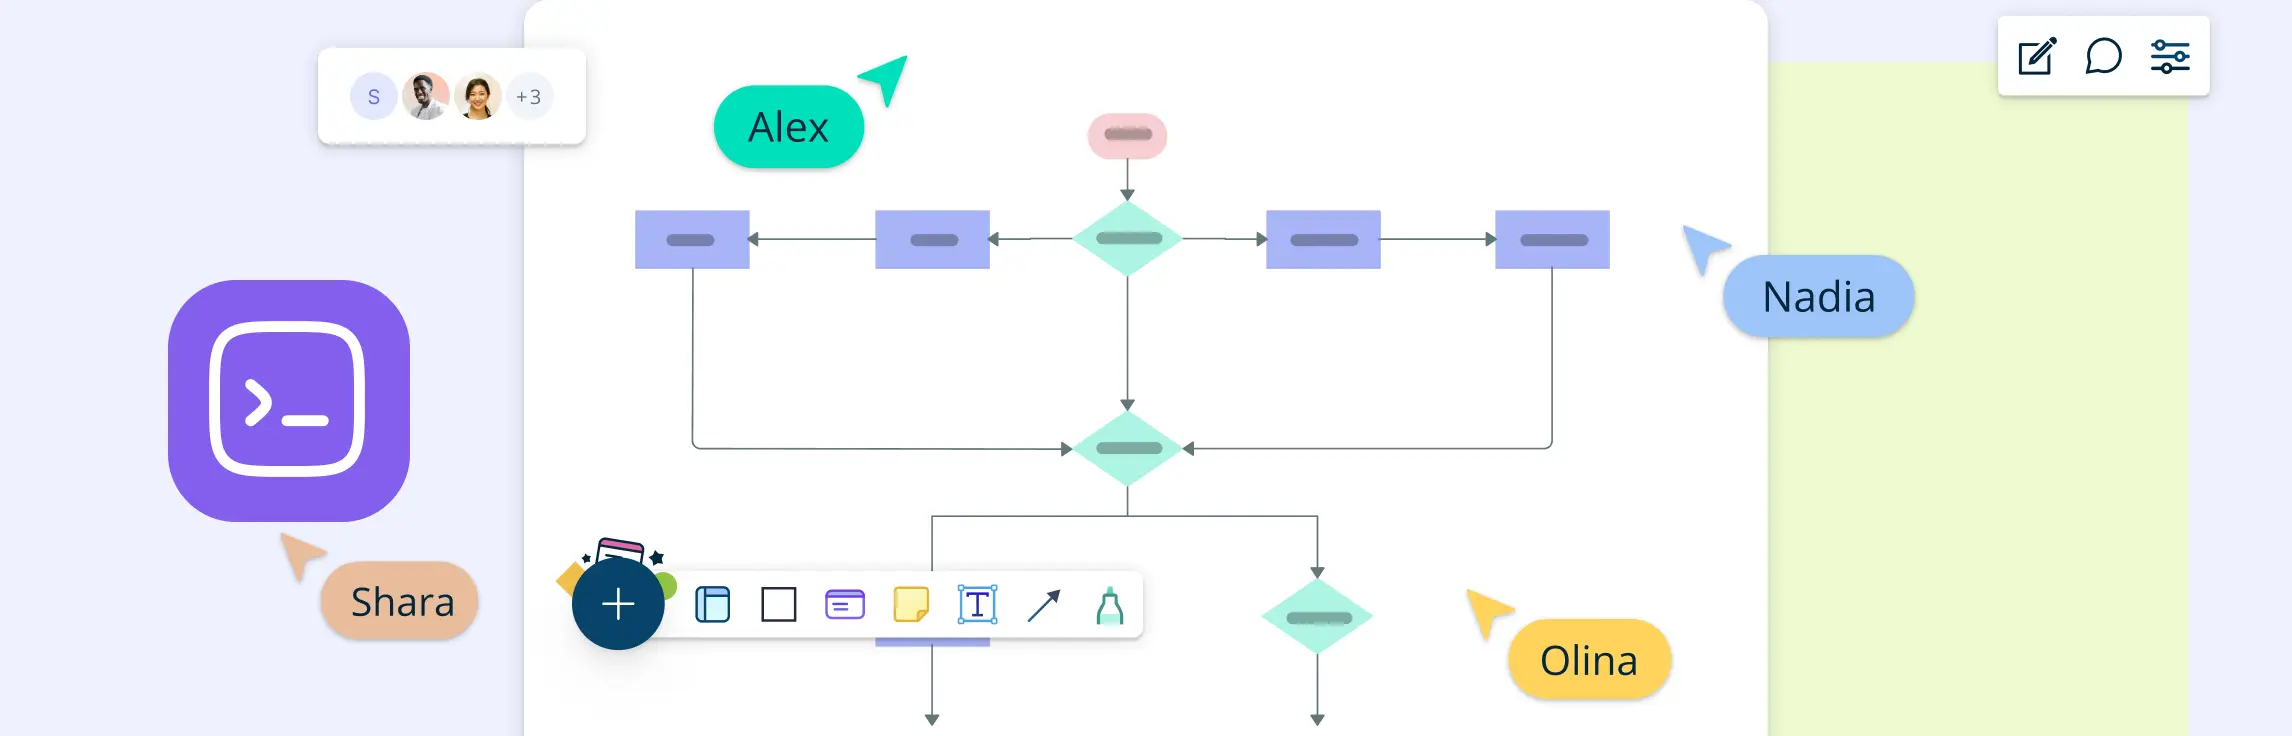
- Real-Time Collaboration – AI-enhanced flowcharting platforms allow teams to work together seamlessly, ensuring up-to-date and synchronized process maps.
- Error Detection & Optimization – AI helps identify process bottlenecks and recommends improvements, ensuring streamlined workflows.
Helpful Resources
Easily visualize your processes and workflows using our free flowchart maker.
AI Flowchart Generator with smart prompts for easy flowcharts.
Learn the various symbols used in flowcharting, their meanings, and how to use them effectively.
Discover 10 practical flowchart ideas and try out the editable templates.
Effective Use of Flowcharts – Case Studies
A flowchart tutorial isn’t complete without some case studies. Below are three case studies and real-life examples of how flowcharts can help you make decisions.
- 10+ Flowchart Ideas for Your Business – How flowcharts can be used in making business decisions and optimizing the current business processes
- Analyzing Sales Funnel with Flowcharts – How to analyze the Google analytic sales funnel using a flowchart.
- Flutterscape Case Study – How one of our customers used flowcharts to enhance their processes.
FAQs on What Is a Flowchart
How can you create AI-powered flowcharts?
What are the advantages of flowcharts?
- Simplifies Complex Processes
- Enhances Communication and Collaboration
- Improves Decision-Making
- Encourages Process Optimization
What are the key features of an effective flowchart?
A well-designed flowchart follows a logical sequence of steps, making it intuitive and easy to follow. Key characteristics include:
- Clear Start and End Points: A flowchart diagram should begin with a defined starting point and lead to a clear outcome.
- Logical Progression: Each step should flow seamlessly into the next, following a structured path without unnecessary complexity.
- Standardized Symbols: Using the correct flowchart symbols ensures consistency and universal understanding.
- Readability and Simplicity: Overly complex flowchart designs can become confusing. Keeping the layout clean and structured improves usability.
What is a subprocess in a flowchart?
How are flowcharts used in computer programming?
What are the common applications of flowcharts?
Flowcharts are widely used across industries to visualize processes, streamline operations, and enhance decision-making. Here’s how they apply in different fields:
- Software Development: In programming, flowcharts help developers plan, debug, and document algorithms, system logic, and decision-making processes. They provide a clear roadmap for coding and troubleshooting.
- Business & Process Optimization: Businesses use flowchart templates to document standard operating procedures (SOPs), optimize workflows, and improve efficiency in project management and decision-making.
- Engineering & System Design: Engineers rely on flowchart diagrams to design complex systems, map out troubleshooting steps, and ensure seamless integration of various components.
- Education & Learning: In classrooms, flowcharts simplify complex topics, helping students visualize problem-solving approaches in subjects like mathematics, science, and logic-based reasoning.
Resources:
Ensmenger, N. (2016). The Multiple Meanings of a Flowchart. Information & Culture, [online] 51(3), pp.321–351. doi:https://doi.org/10.2307/44667617.
Weng, W. (2024). Flowchart. A Beginner’s Guide to Informatics and Artificial Intelligence, pp.13–20. doi:https://doi.org/10.1007/978-981-97-1477-3_2.