Task Analysis Diagram
Visualize and Breakdown Complex Tasks
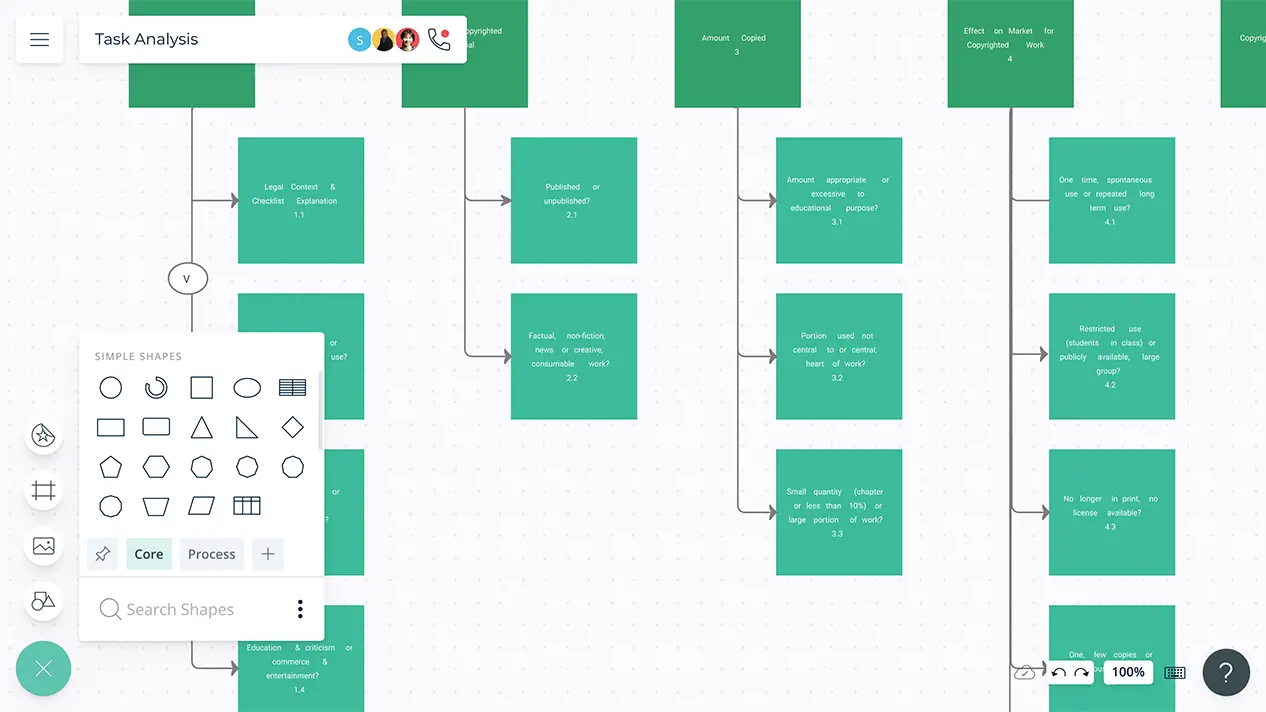
Bring all your tasks into a professionally-designed template on Creately and map the execution plan. Identify the tasks with priority and collaborate on analyzing ways to complete them.
- Customizable templates to visualize the complex tasks
- In-app video conferencing to collaborate in real-time with the task owners
- Export as SVG, PNG, JPEG, or PDF

Visualize Arrays of Tasks
Customizable templates to easily get started and insert tasks into them.
Simple to use drag-drop and Plus Create tools to visually organize and reposition an array of tasks intuitively.
Context-aware shapes to capture information of each task customizing the data fields.
Full-version history to track the changes that are being made to the task analysis and revert to any version as you want.
Bring Multiple Teams Together

Video conferencing baked into the platform to feel like you are in the same room.
Real-time cursors for any number of participants. Work with teams and clients on a shared canvas. Async!
Multiple access and role levels to customize the sharing experience among multiple collaborators. Make them a viewer, reviewer, or an editor to streamline feedback gathering.
Comment with context, have discussions and follow-ups on the same canvas.

Centralize All the Information
Folder Structures to organize the tasks analysis for multiple projects based on the sprints, execution dates, and teams.
Infinite canvas that scales up to 1000s of items in a single view to build wikis containing analysis reports, plans, and processes.
Use frames inside the infinite canvas to generate page-like layouts to organize task analysis, group similar content, or build a presentation flow.
Universal, full-text search to easily find specific nodes and information in large, complex task analysis.
Share Your Task Analysis on Multiple Platforms

Embedded documents and assets with in-app previews for quicker understanding of the scope, requirements, and the deadline.
Connect to your favorite tools with Creately plugins for Github, Slack, Google Workspace, Confluence, and more.
Add-ons to easily embed in Google/Microsoft documents, slides, and sheets.
Export flowcharts as SVGs, PNGs, JPEGs, and PDFs to publish, present, print, or share.
What is a Task Analysis Diagram?
Task Analysis Diagram is a visual representation that breaks down a complex task or process into smaller, manageable steps.
How to Create a Task Analysis?
- Identify the task you want to analyze and the task owner.
- Create a rough plan with the steps involved in the task in order to complete. For this you can break down the task into its smaller subtasks and specific actions for those.
- Use Creately’s templates library to pick the process map template to map out the sub tasks and select the flowchart template to visualize the actions for each sub task.
- Mark down the task definition, job description and job inventory. Run a risk assessment to identify the risks involved in carrying out the task.
- Now that you are aware of the different parts of the task, examine the relationships among them. Using the information gathered, develop job aid and assistance and identify objectives for training sessions for employees.
- Style your analysis and add images if necessary. Use different colors to highlight the action points.With Creately, you can quickly style your graph with attractive and professional color themes. While you can import images, clip art, gifs, logos, icons, etc. right from your device to customize your analysis, you can also use the built-in Google image search to find more images.
- Share your graph with others to collaborate. Gather their feedback with contextual comments on Creately. You can download the analysis as SVGs, PNGs, JPEGs, or PDFs for printing, sharing, publishing, or presentations. You can also share it with anyone via email.