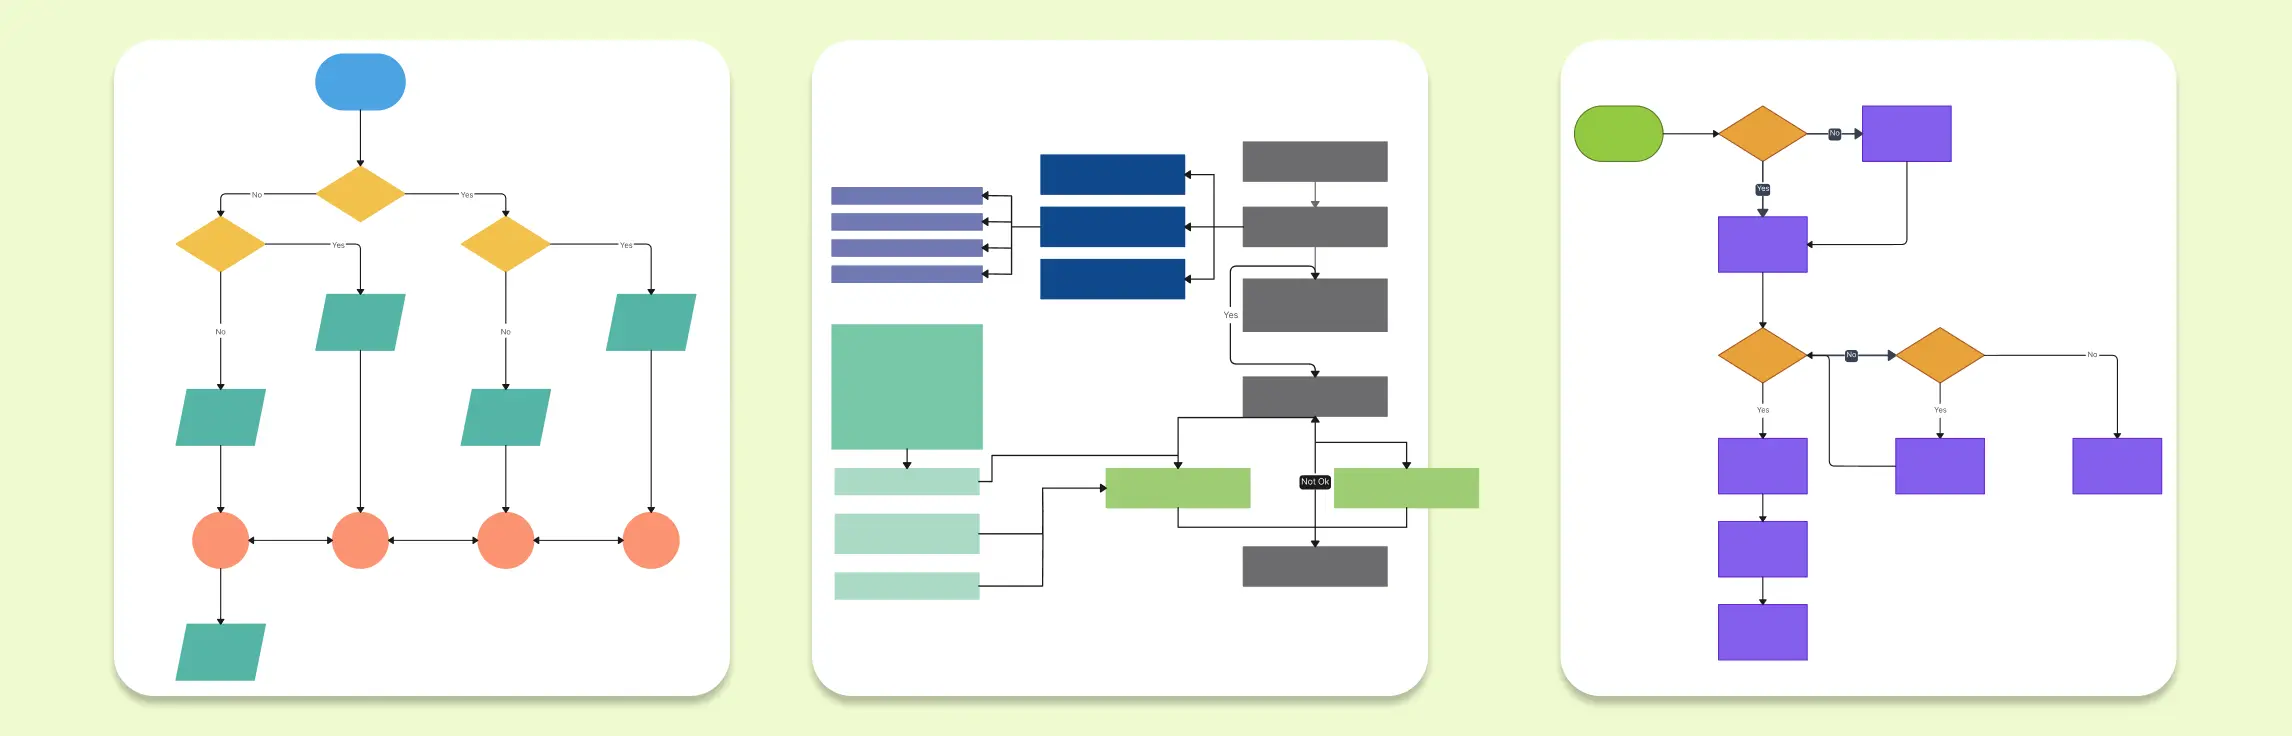
Flowcharts are powerful tools that simplify complex processes, visualize workflows, and aid in decision-making. Whether you’re designing a customer journey, mapping out business processes, or planning project tasks, flowcharts help present information in a clear and structured format. This guide presents a collection of flowchart examples for business, offering templates that cater to diverse operational needs.
Flowcharts play a crucial role in programming by offering a structured way to represent algorithms, decision-making processes, and logic flow. Whether you’re designing an if-then statement, outlining a program structure, or developing an application workflow, flowcharts provide clarity and improve debugging efficiency. This guide presents a comprehensive collection of programming flowchart examples, helping developers, students, and professionals streamline coding processes.
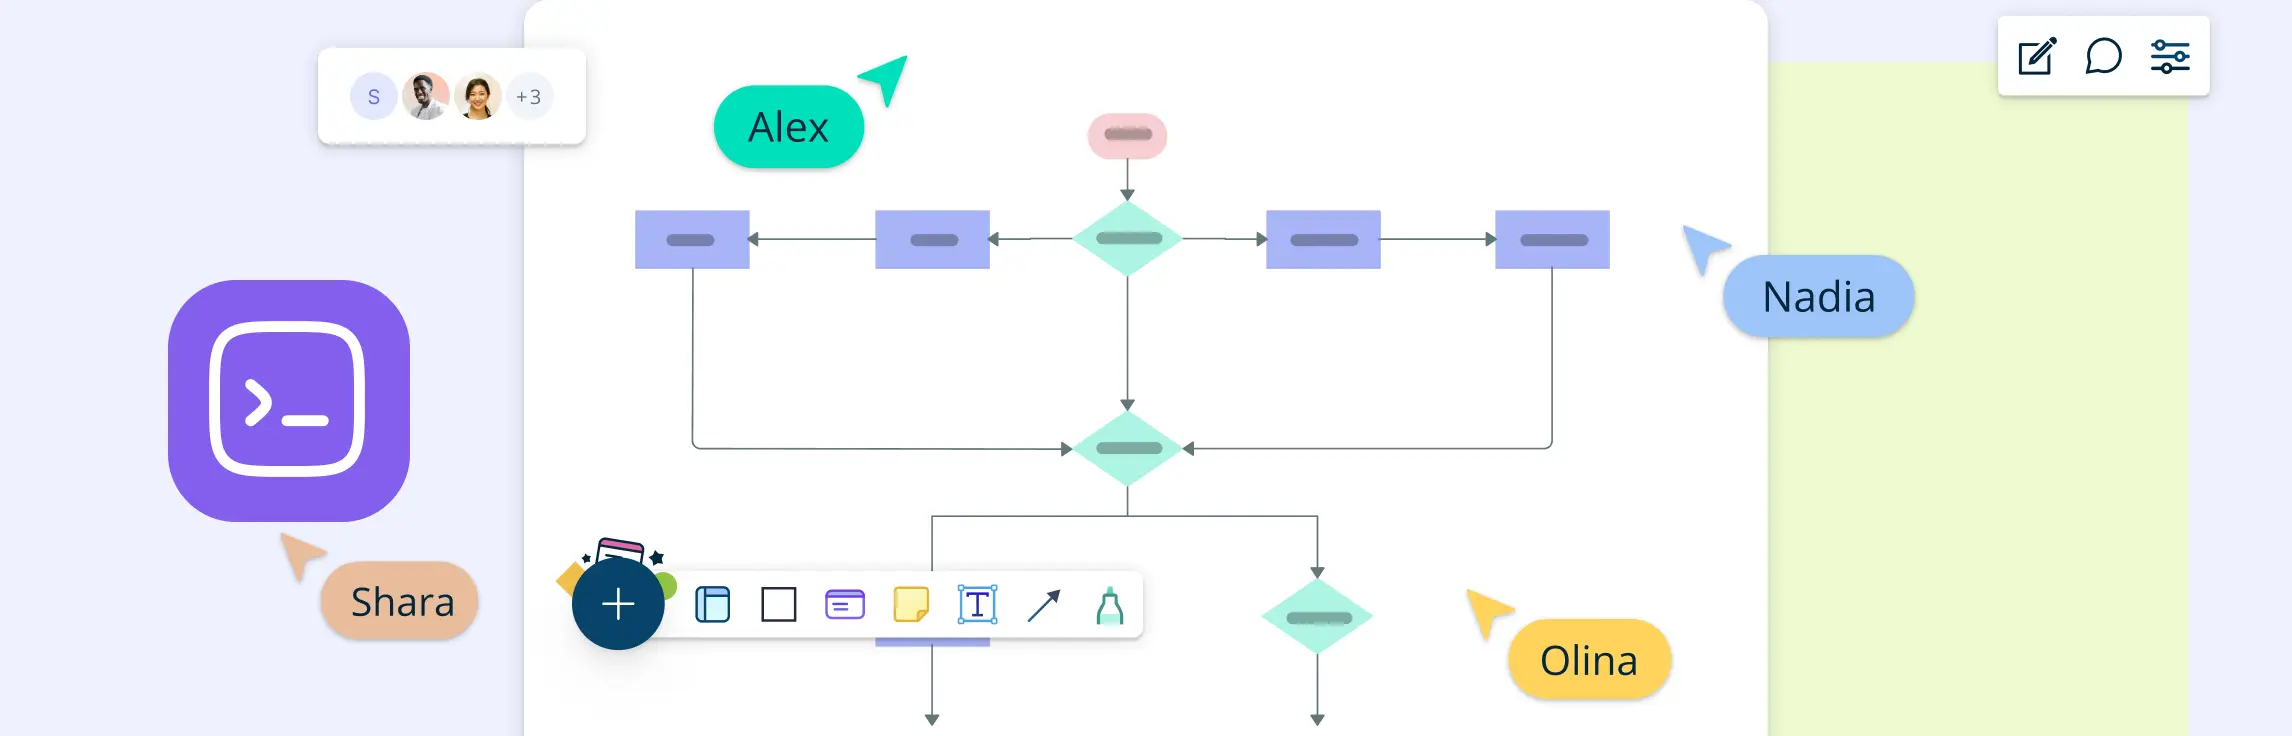
Flowcharting is an effective way to visualize processes, helping you better understand, communicate, and improve the steps involved. Whether you’re mapping out business processes or personal workflows, flowchart ideas can help streamline tasks and enhance clarity. Below, we’ve compiled 10 flowchart ideas and editable flowchart templates you can test out using Creately’s intuitive diagramming software.
Flowcharts are a great way for students to organize thoughts, simplify complex tasks, and improve problem-solving skills. In this guide, we’ll explore flowchart examples for students that cover various academic and personal scenarios, from solving math problems to planning study routines.
Flowcharts are powerful tools for visualizing processes and making complex information easier to understand. Whether you’re mapping out a business process, designing software, or planning a project, flowcharts help you break down tasks step by step. However, to create clear and effective flowcharts, it’s important to follow certain flowchart rules.
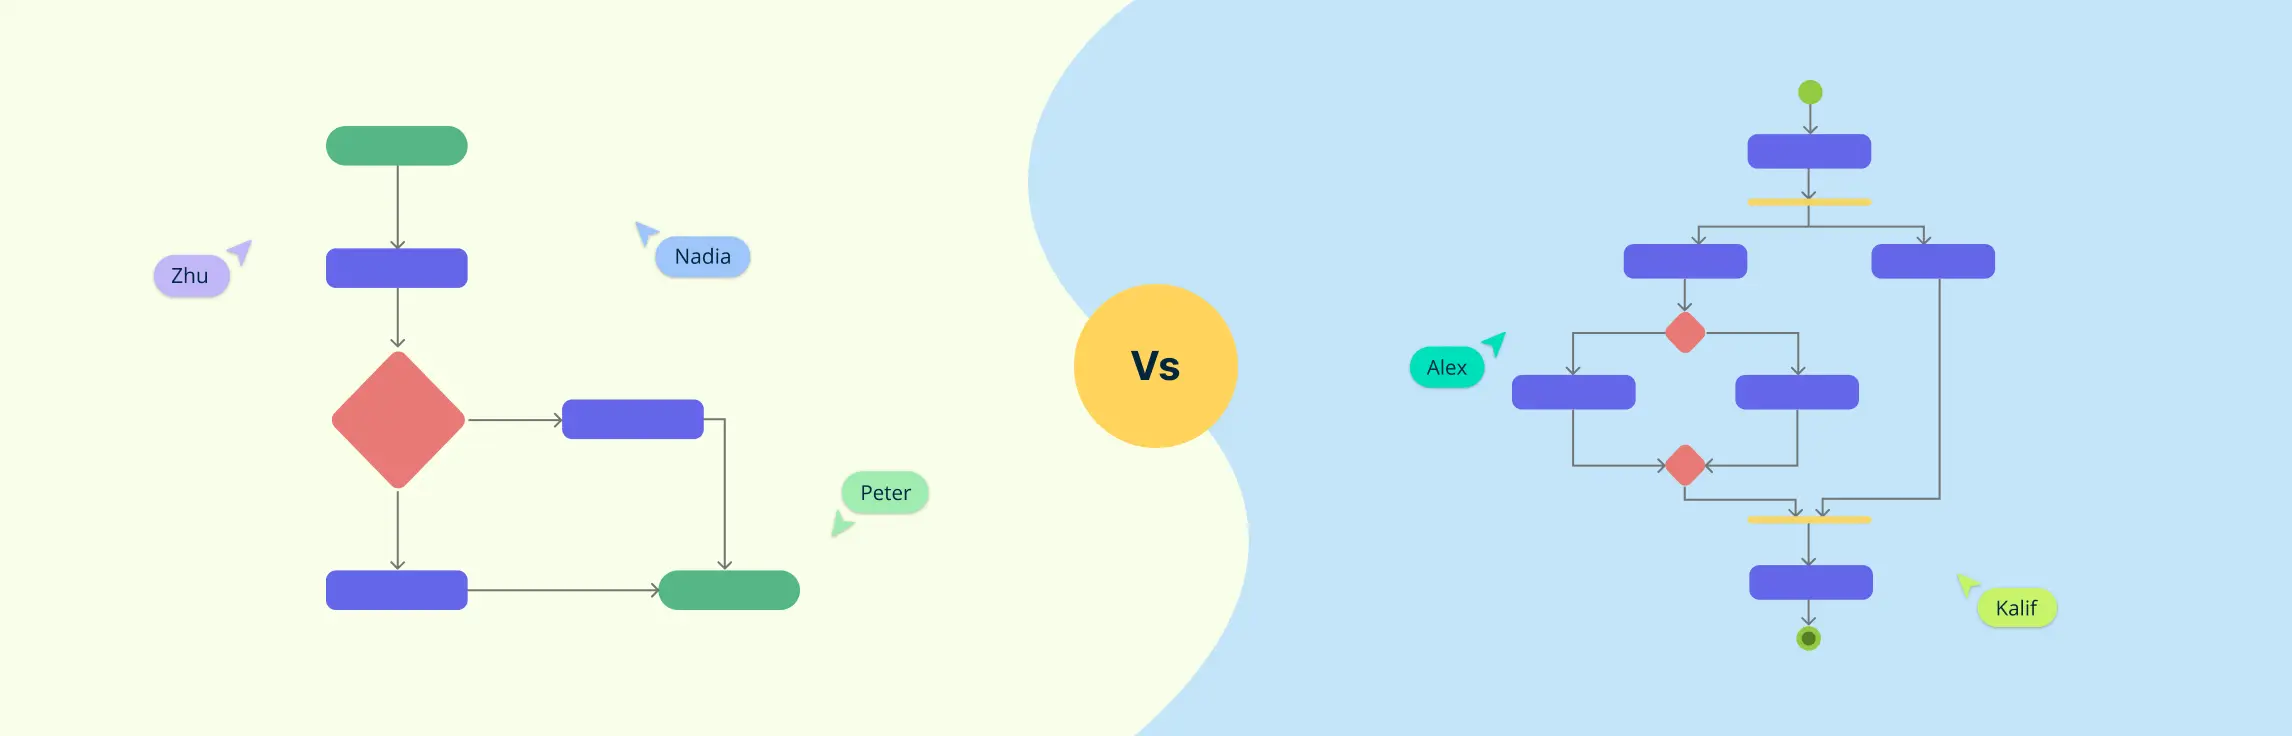
When mapping out processes, whether for business, software development, or everyday workflows, visual diagrams make things clearer. Two commonly used tools for this are flowcharts and activity diagrams. At first glance, they may seem similar—both show steps in a process—but they serve different purposes and are used in different fields.
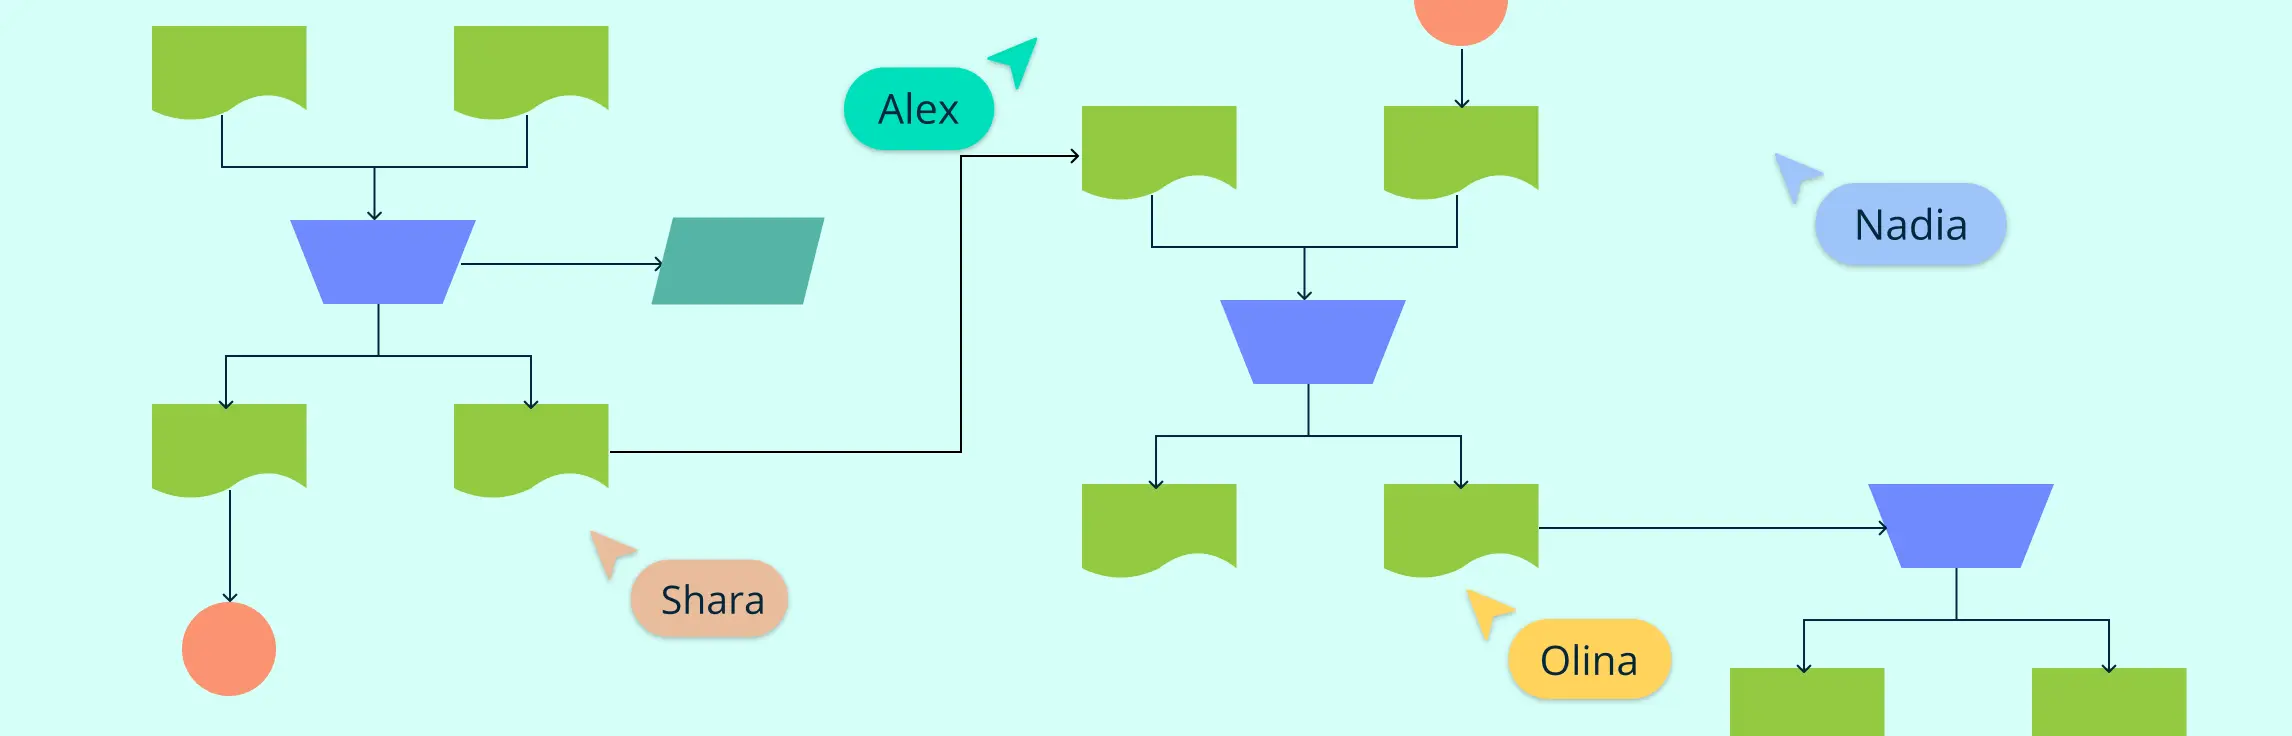
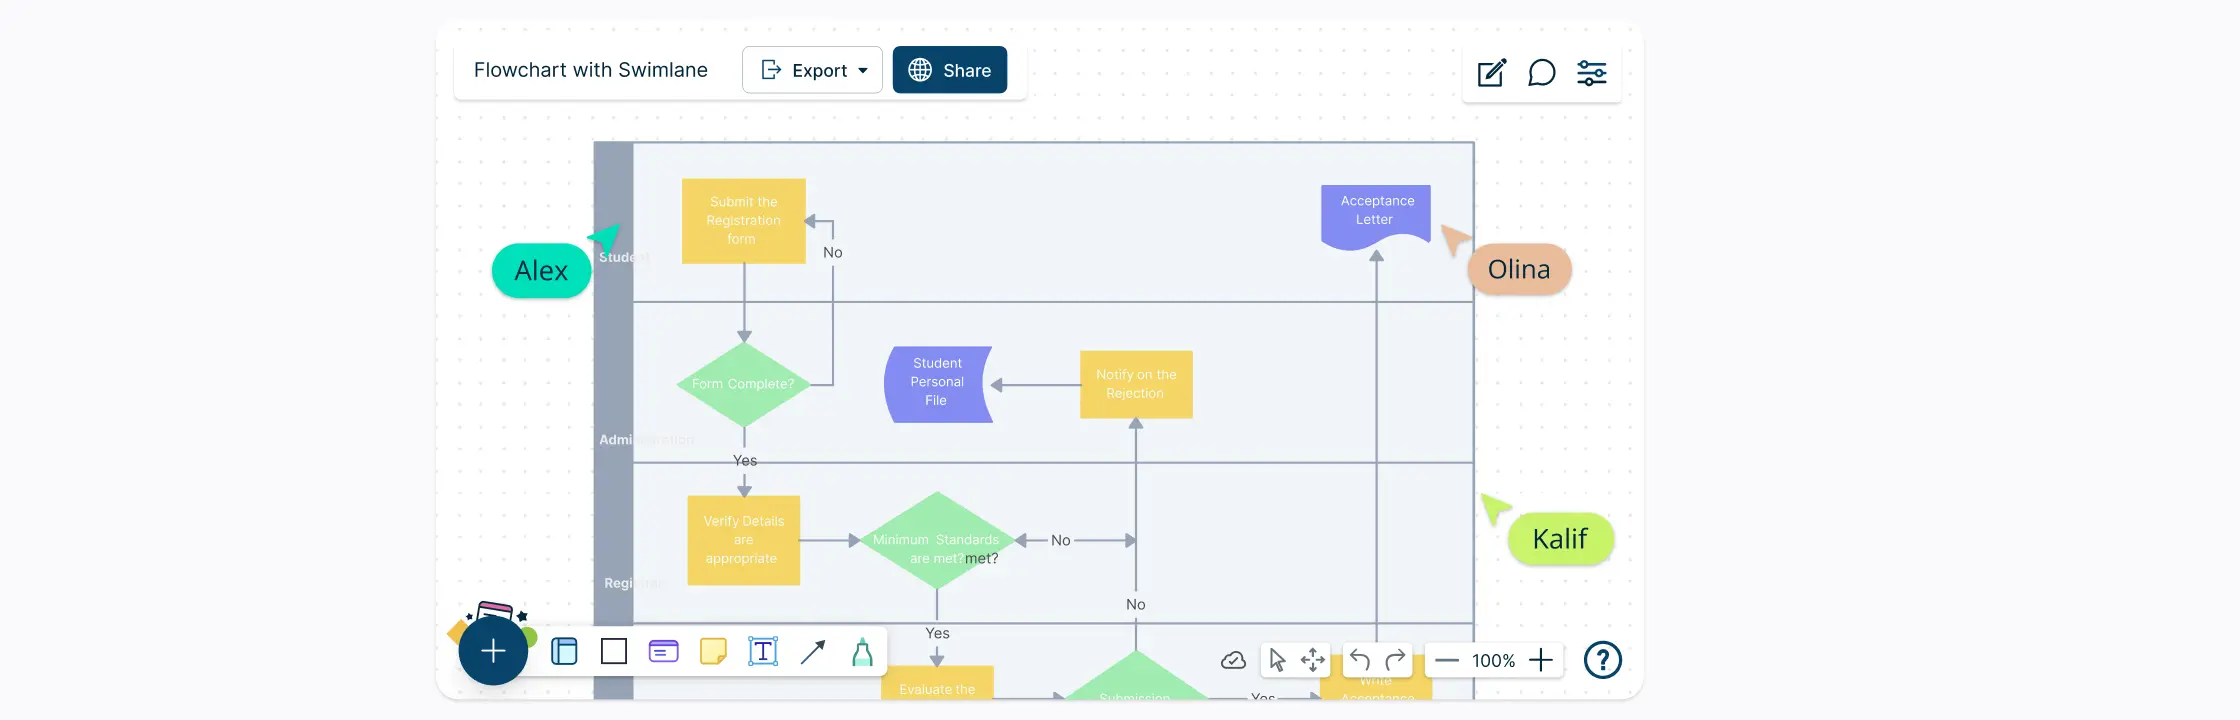
A cross-functional flowchart is a simple but powerful tool that helps businesses and teams visualize their processes more clearly. Unlike a regular flowchart, it doesn’t just show the steps of a process—it also highlights who is responsible for each step. This makes it especially useful for teams that work across different departments, ensuring everyone understands their role in the bigger picture.
Every day, businesses and organizations handle countless documents—contracts, invoices, reports, and more. Keeping track of how these documents move from one step to another can get complicated. That’s where a document flowchart comes in.
Flowcharts are essential for illustrating processes, workflows, and systems. They simplify complex tasks, highlight inefficiencies, and help communicate ideas effectively. Although Excel is primarily recognized as a spreadsheet tool, it also includes features that enable users to craft clear and structured flowcharts.
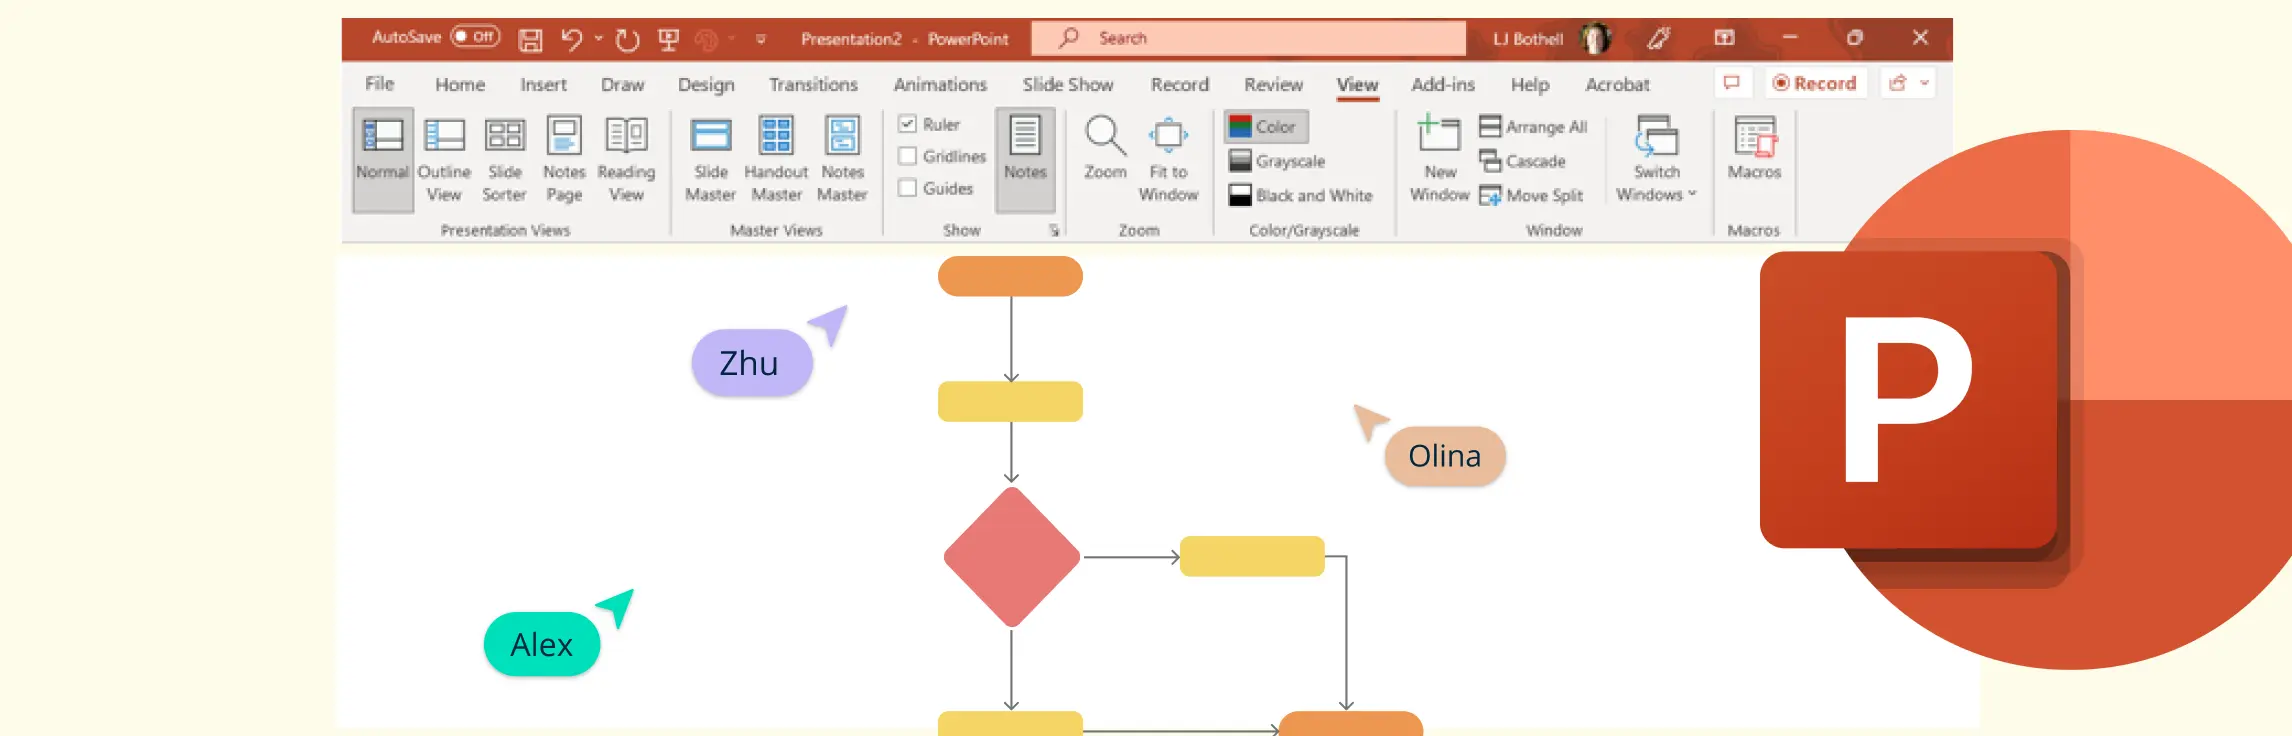
Flowcharts are valuable tools for illustrating processes, streamlining complex tasks, and enhancing presentations. Although PowerPoint is widely recognized for its presentation capabilities, it also provides effective tools for crafting polished flowcharts. This guide offers a step-by-step approach to creating a flowchart in PowerPoint.
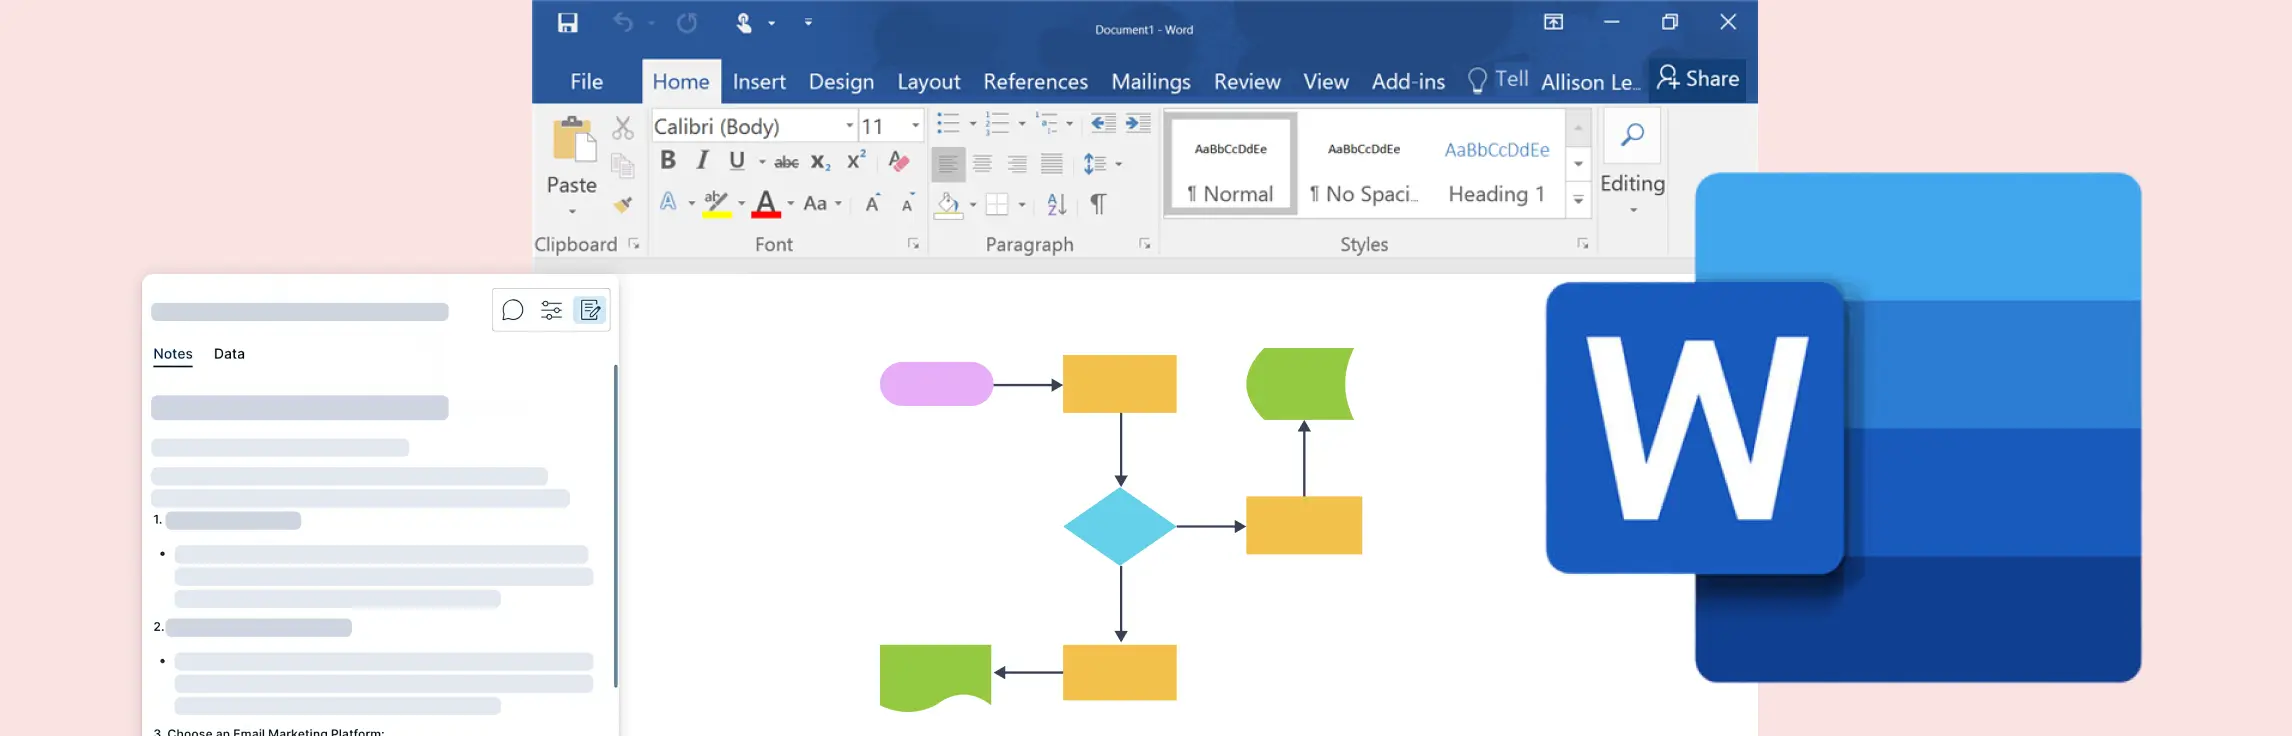
Flowcharts are essential tools for visualizing processes, workflows, and decision-making pathways. While Microsoft Word is primarily used for word processing, it also offers basic features to create flowcharts. This guide will show you how to make a flowchart in Word, covering different methods, tips, and best practices.
A flowchart loop is a fundamental concept in process automation and programming, allowing tasks to repeat based on a defined condition. Whether used in software development, workflow optimization, or decision-making processes, flowchart loops help visualize repetitive actions clearly and efficiently.
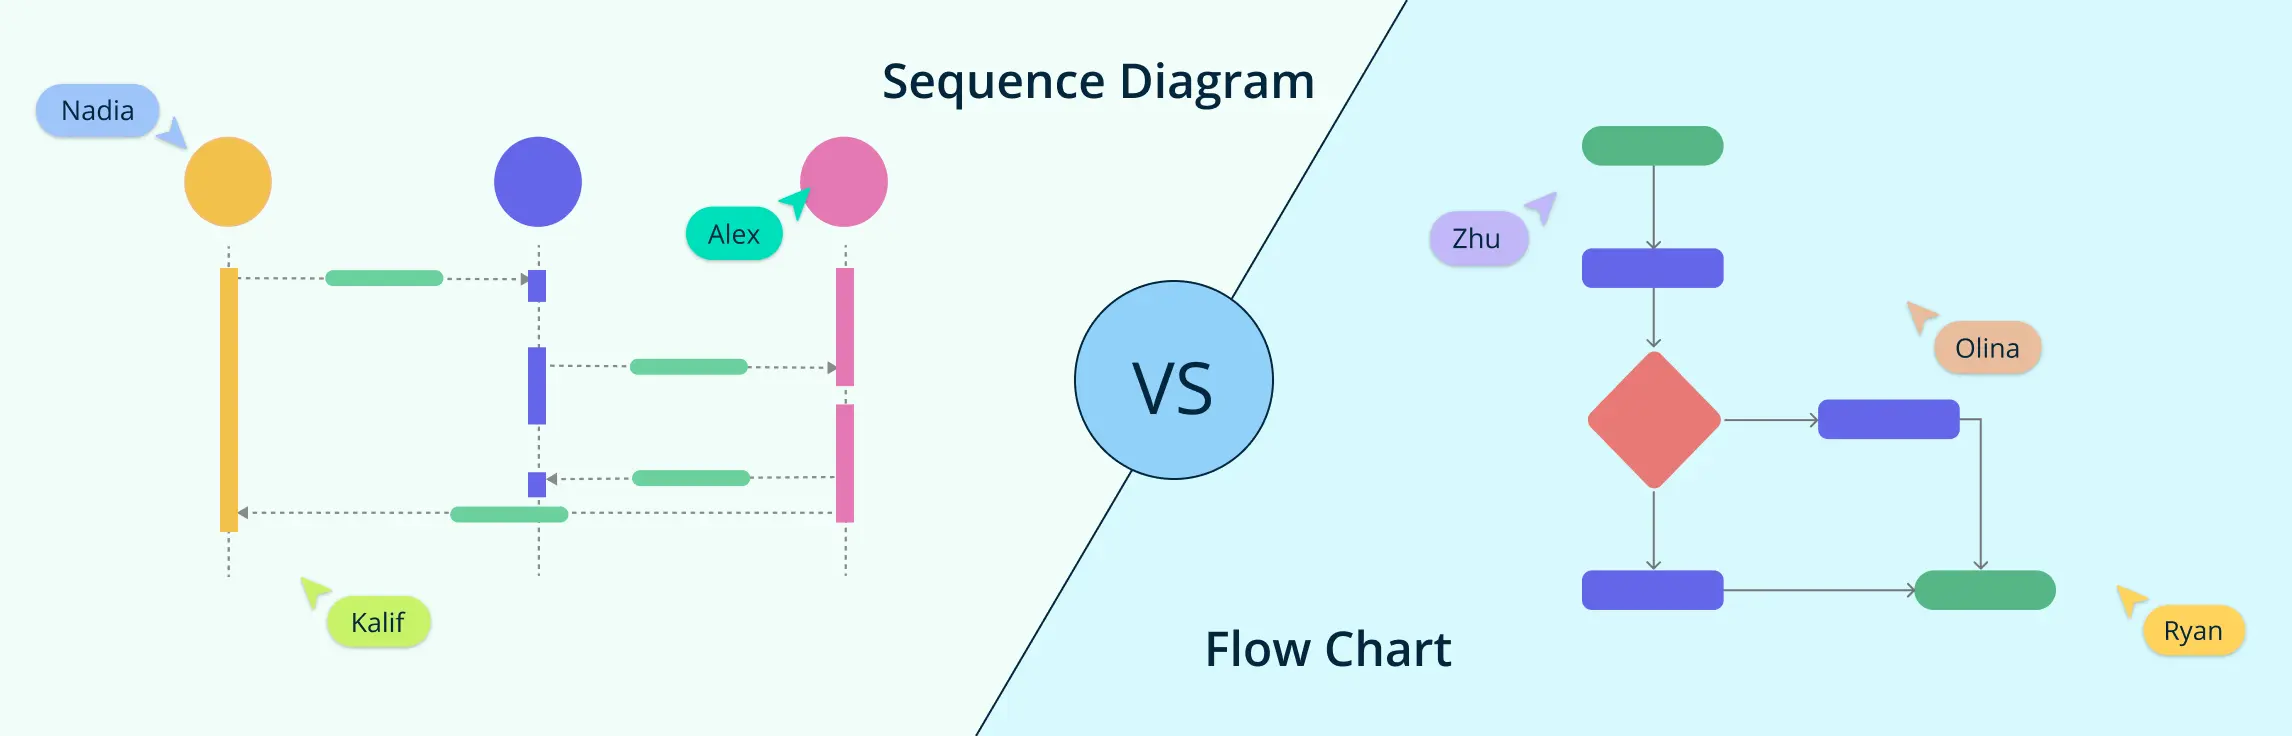
When it comes to visualizing processes and system interactions, two of the most commonly used diagramming methods are flowcharts and sequence diagrams. While both are powerful tools for representing workflows and system behaviors, they serve distinct purposes and follow different structures.
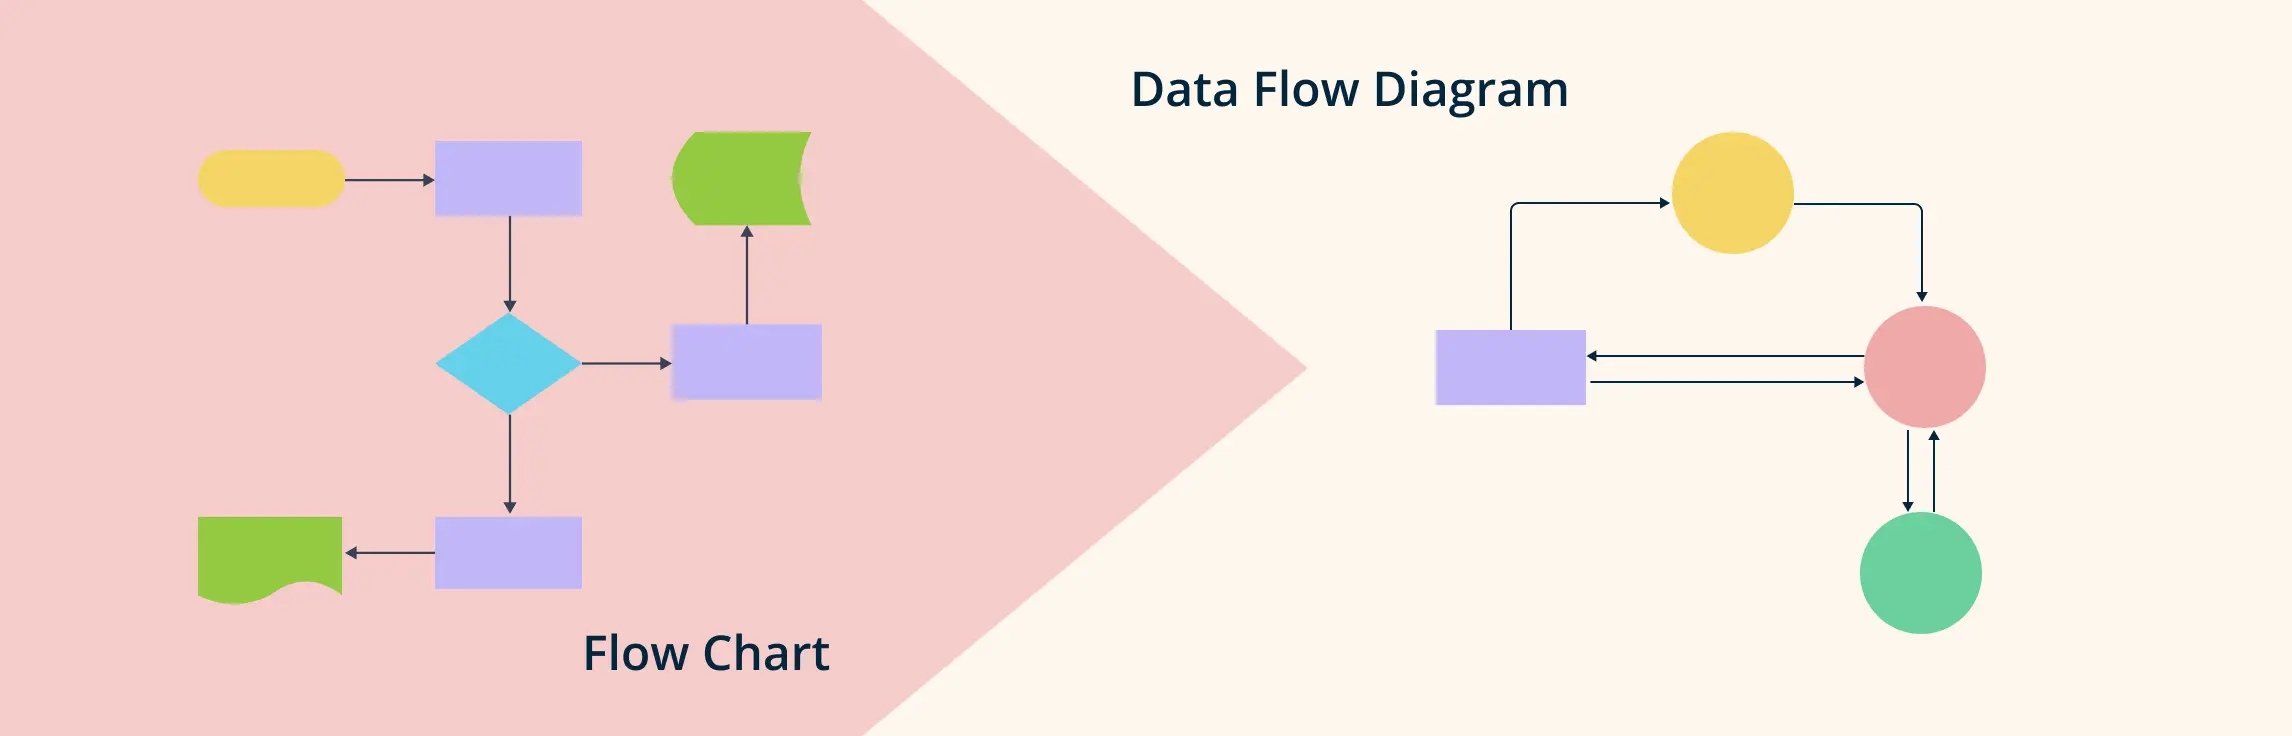
In today’s fast-paced world, visualizing data and processes is essential for clear communication and effective decision-making. Flowcharts and Data Flow Diagrams (DFDs) are powerful tools that help break down complex workflows, making them easier to understand and analyze. Whether you’re looking to map out a business process, analyze a data system, or improve communication within your team, flowcharts and DFDs can simplify the process and enhance collaboration.
Flowcharts are powerful tools that help visualize processes, systems, and workflows. Whether you’re mapping out a business operation, designing a computer program, or organizing daily tasks, flowcharts make complex ideas easier to understand.
Understanding processes is key to making tasks more efficient and effective, whether you’re managing a project, improving workflows, or solving problems. Two useful tools for visualizing and analyzing processes are flowcharts and process maps. Though they may look similar, each one serves a distinct purpose and works better in different scenarios.
A decision flowchart is a simple yet powerful tool that visually maps out choices and outcomes, making decision-making easier. Whether for work, projects, or daily life, a decision-making flowchart helps clarify options and improve efficiency.
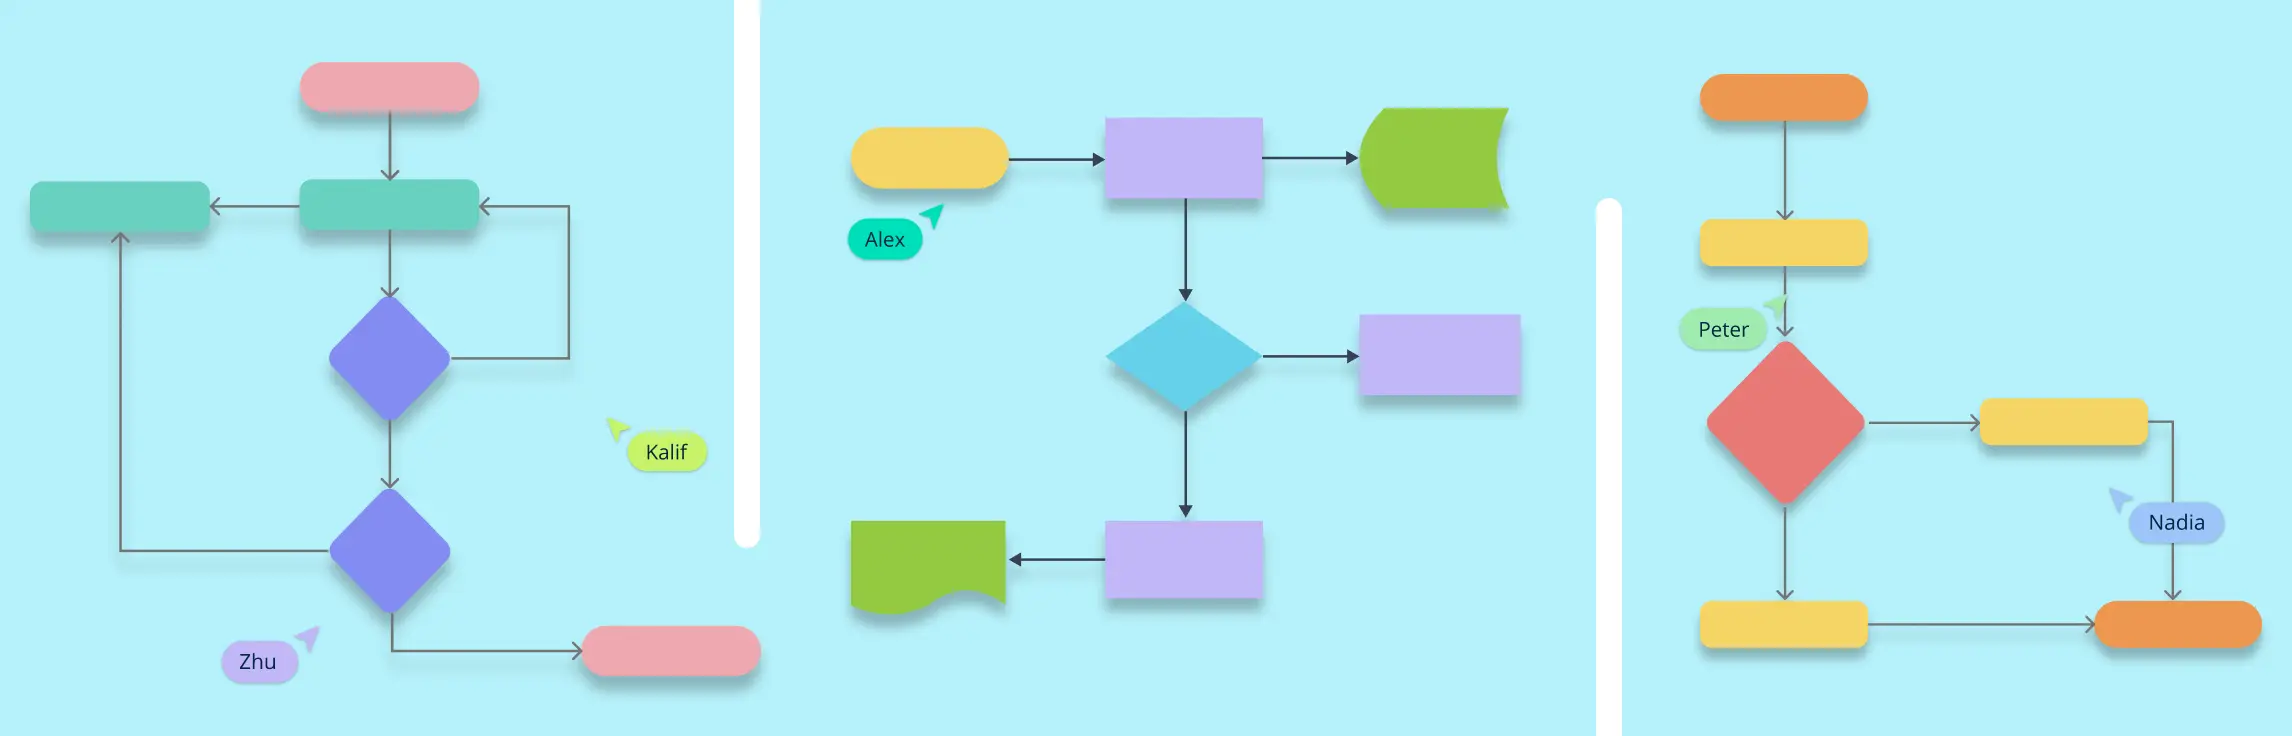
Flowcharts are the go-to tool for process mapping. Whether you are working on a new workflow or solving a problem, flowchart symbols make it easy to visualize steps, decision points, and paths. However, to create a flowchart that clearly communicates your process, you need to know the right flowchart symbols and their usage. This guide will walk you through everything you need to know about flowchart symbols, their meanings, best practices, and common mistakes. Understanding flowchart symbols ensures that your diagrams are effective, structured, and universally understood.
What are cross functional flowcharts Flowcharts are widely popular and one of the most frequently diagram types. They are great for mapping the flow of steps, decisions that need to be made etc in a process.
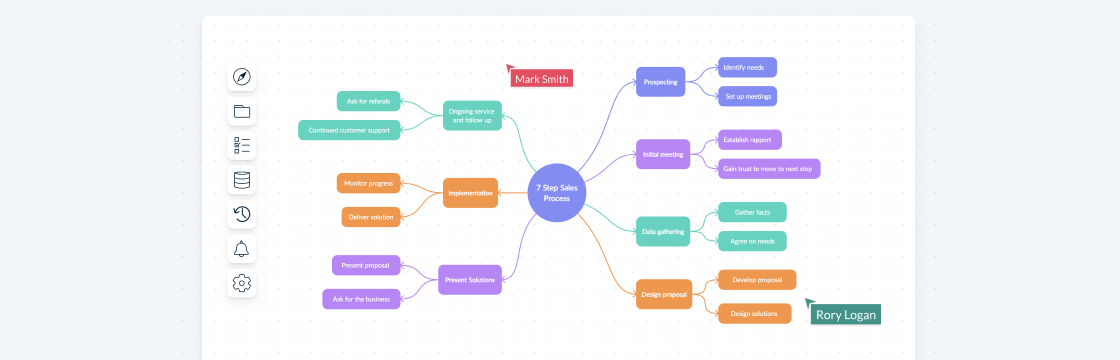
A well-structured sales process flowchart is essential for streamlining sales operations, improving efficiency, and driving revenue growth. By visually mapping out each stage of the sales journey, businesses can identify bottlenecks, optimize workflows, and enhance overall sales performance.
Flowcharts are an essential tool for breaking down complex processes into clear, visual steps. Whether you’re mapping out a business workflow, designing a system, or troubleshooting an issue, a well-structured flowchart helps bring clarity and efficiency.