The best process management software gives teams one living repository for how work runs. It should combine clear process maps with controlled documentation, version history, named ownership, responsibility mapping, evidence, review workflows, and BPMN when formal modeling is needed.
Overview of Project Management Charts In project management, PERT Chart vs Gantt Chart emerges as a key comparison for determining the most effective approach to task scheduling and resource allocation. Both tools are indispensable for visual collaboration and offer unique perspectives on project execution. However, their methodologies and applications vary significantly, making the PERT Chart vs Gantt Chart debate crucial for project managers.
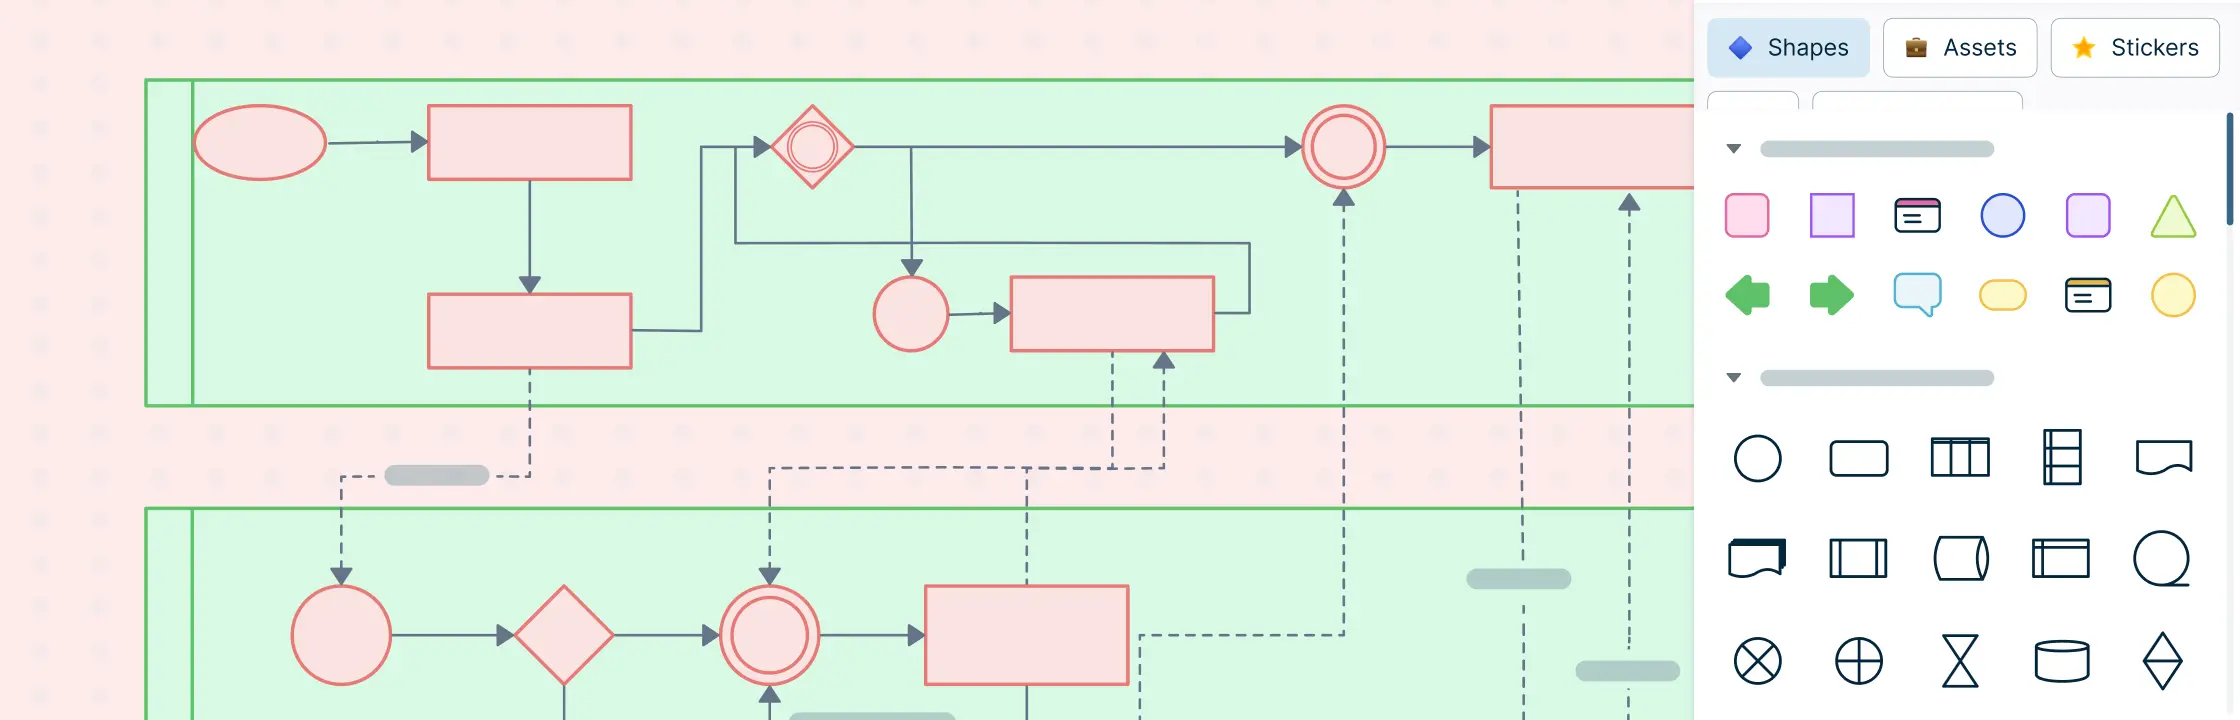
What are Process Maps? Process maps are essential tools used across various industries to visualize workflows, enabling teams to gain a comprehensive understanding of processes. They serve as visual guides that detail every step, decision point, and interaction within a process. By illustrating how tasks are connected, process maps help identify inefficiencies, streamline procedures, and enhance team collaboration.
Defining Business Processes Business processes are the structured activities or tasks implemented within an organization to produce a specific service or product. At their core, they are the backbone of organizational operations, impacting everything from workflow efficiency to product quality. Understanding these processes is pivotal as it paves the way for systematic improvements and resource optimization.
Understanding Process Map vs Value Stream Map Mapping is a critical component in business process management, directly influencing the efficiency and effectiveness of operations. Two frequently used mapping tools are the process map and the value stream map, each serving distinct purposes.
Changing customer expectations, regulations, technologies, and operating conditions can make an undocumented process obsolete quickly. Agile business process mapping applies short feedback cycles and measured, incremental improvement to process management. Teams document the current workflow, identify owners and handoffs, test a proposed change, review the evidence, and update the map when the operating process changes. The result is a living process reference—not an assumption that editing a diagram automatically changes how work is performed.
An enterprise resource planning (ERP) implementation changes how work, data, roles, and controls connect across the organization. Software selection is only one part of that change. Teams also need an evidence-based understanding of current processes, business requirements, ownership, handoffs, data dependencies, and the target operating model.
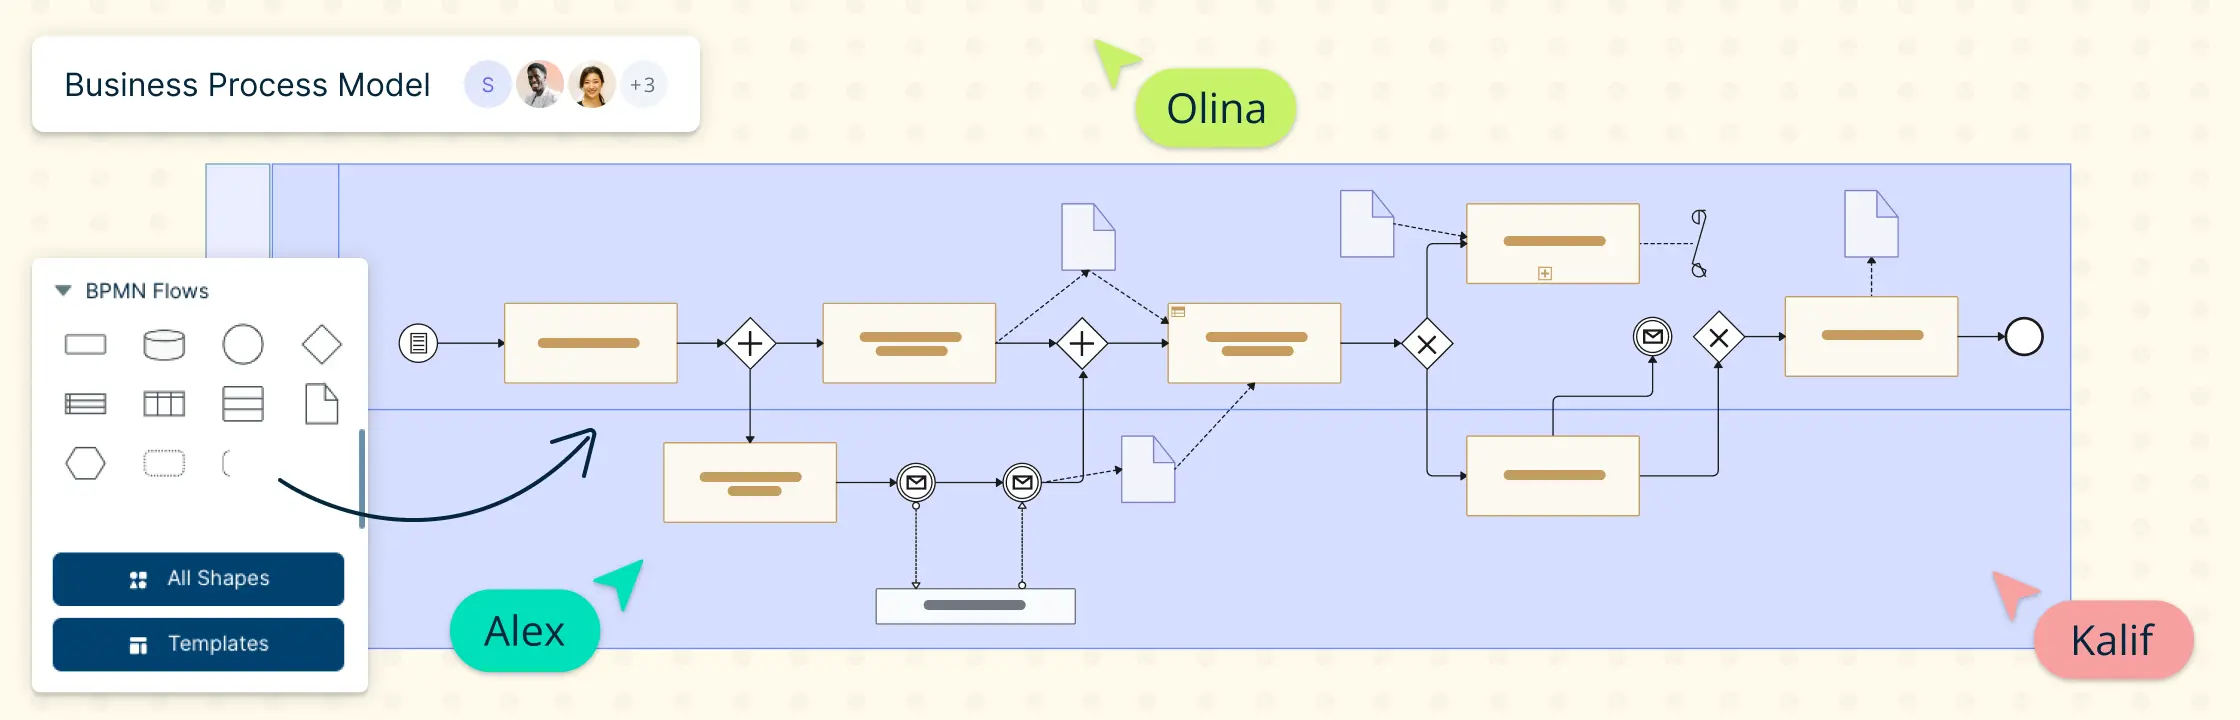
Business Process Model and Notation (BPMN) is a standard for visualizing and designing business processes. It uses various BPMN symbols to represent different elements in a process. BPMN is a key tool in business process mapping, enabling businesses to document and analyze their workflows for continuous improvement. Check out our guide on BPMN to learn about the Business Process and Modeling Notation in more detail. Here is a complete list of BPMN symbols along with their meanings.
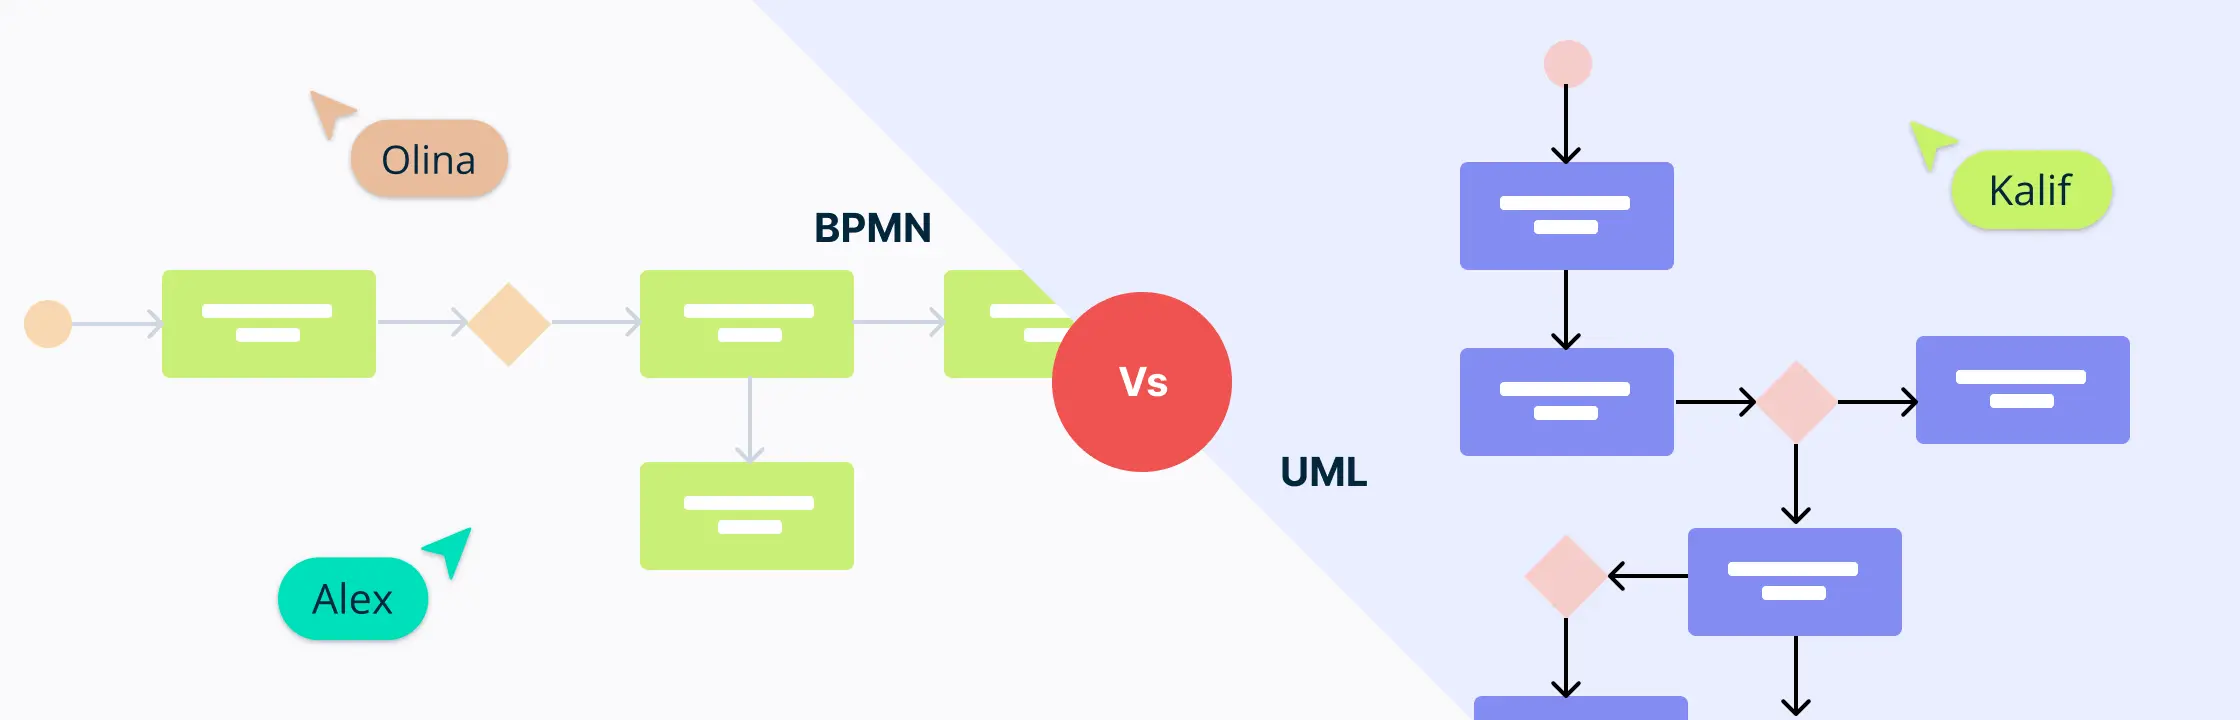
In business and tech, choosing between BPMN vs UML carries significant importance. If you are involved in process modeling, you know these languages are key to improving how organizations work. This short guide compares the basics of BPMN vs UML, helping you make smarter choices for your projects.
In this guide, we will delve into what BPMN is, including its history, when and how to use it, and the benefits it brings to process work. We’ll explore BPMN diagram elements and business process modeling notation symbols, provide examples of practical use, and show how tools like Creately help teams keep BPMN diagrams connected to their supporting process context.