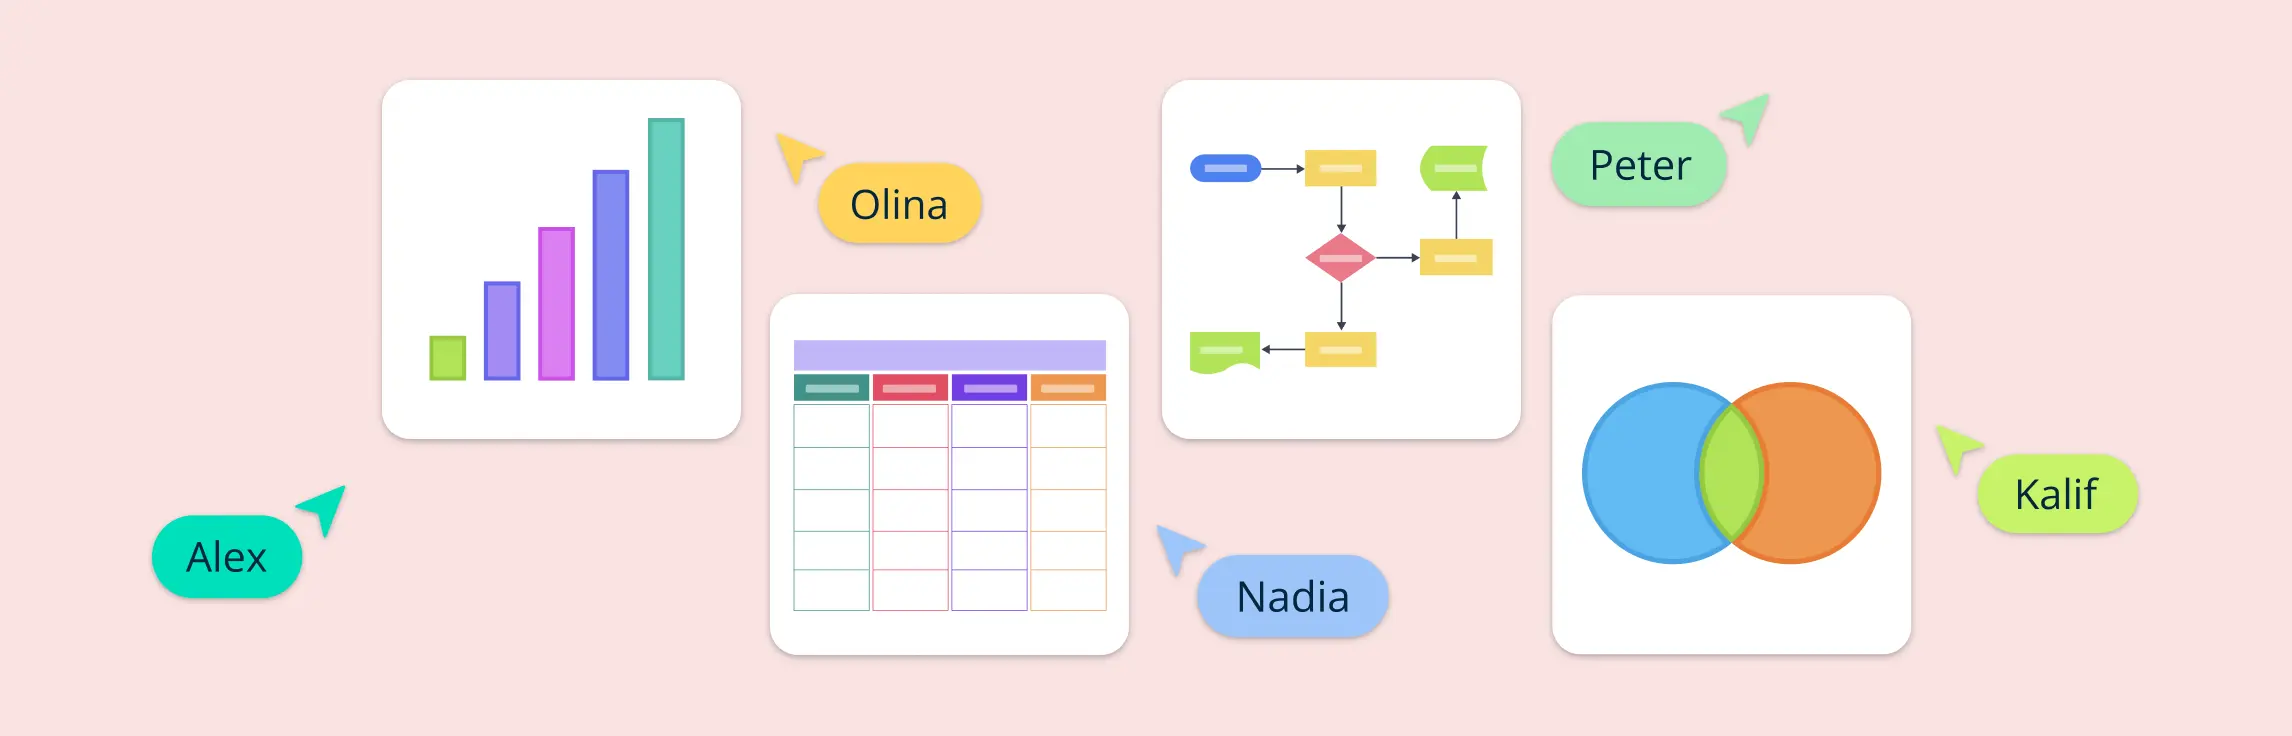
Graphic organizers for math help students break down problems, compare concepts, organize data, and see relationships visually. For teachers, they are also useful classroom resources for lesson planning, small-group work, guided practice, homework support, and math intervention.
A flowchart loop is a fundamental concept in process automation and programming, allowing tasks to repeat based on a defined condition. Whether used in software development, workflow optimization, or decision-making processes, flowchart loops help visualize repetitive actions clearly and efficiently.
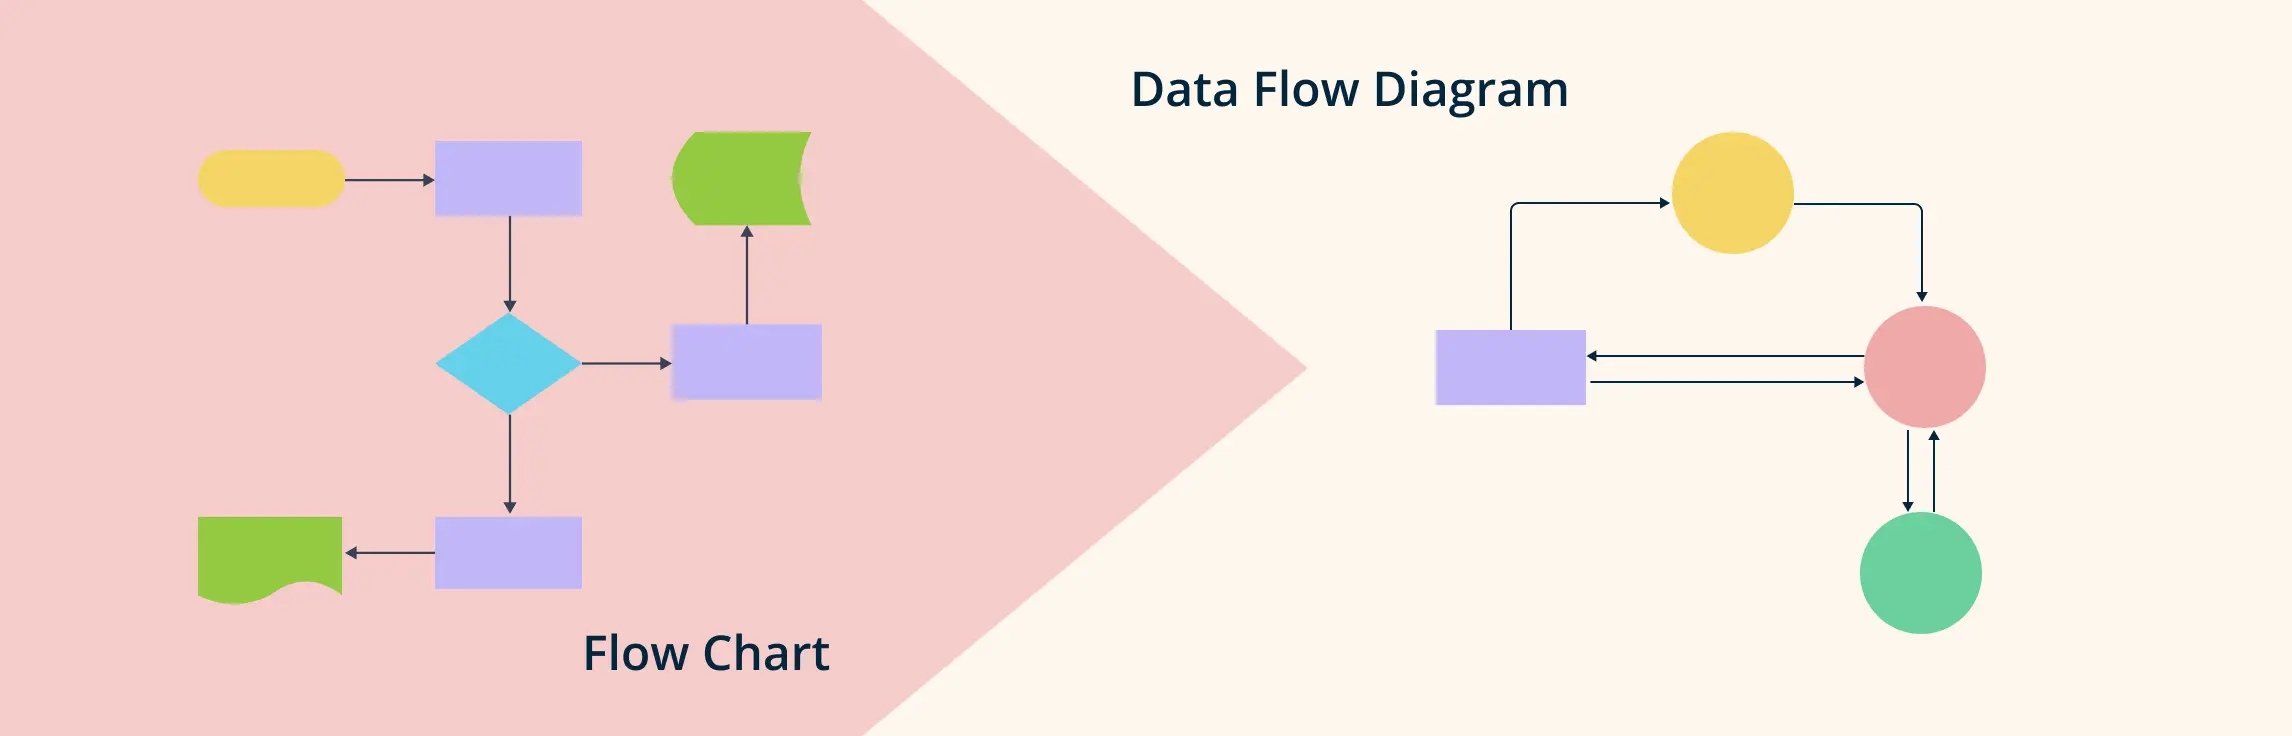
Flowcharts and data flow diagrams (DFDs) visualize different aspects of a system. A flowchart shows the sequence of activities and decisions in a workflow, while a DFD shows how data moves between external entities, processes, and data stores. Choosing the right diagram helps teams answer the right question without mixing operational flow with information flow.
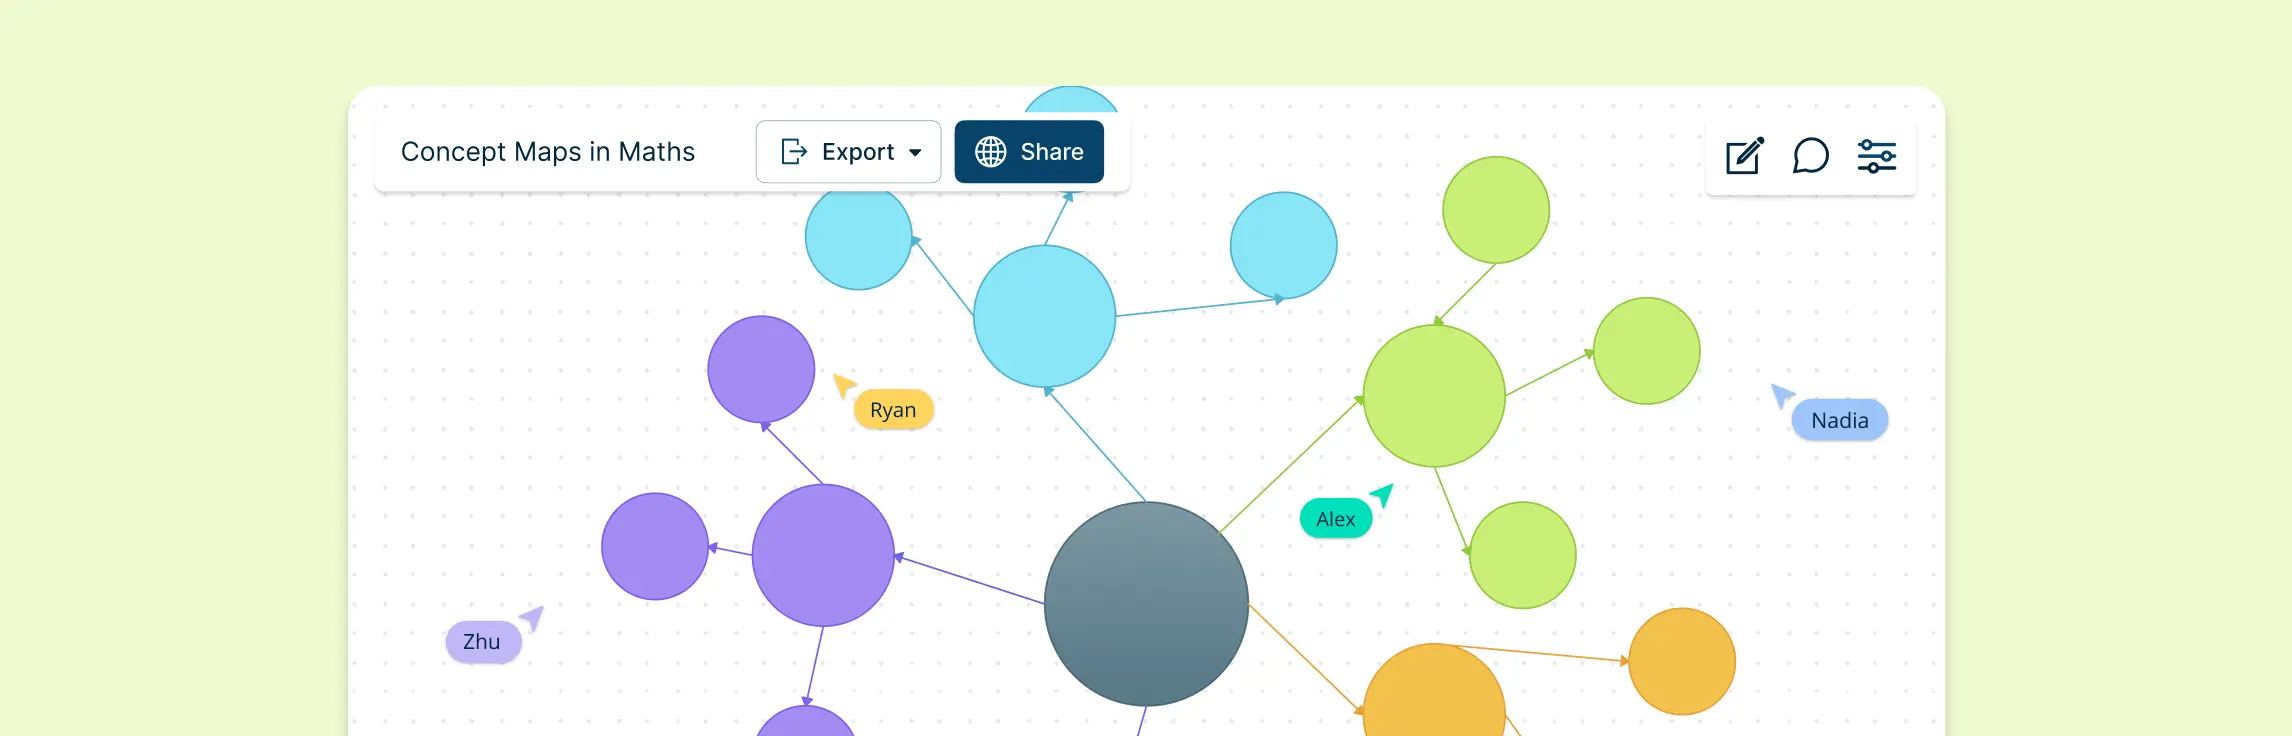
Math concept maps help students organize formulas, theorems, definitions, and problem-solving methods by showing how they connect. They are useful for learning abstract topics, comparing related rules, and reviewing multi-step concepts before exams.
Using a concept map for research helps researchers organize literature, theories, variables, methods, and findings in one visual structure. It is most useful when you need to clarify a research question, compare sources, identify gaps, or explain how concepts relate across a study.
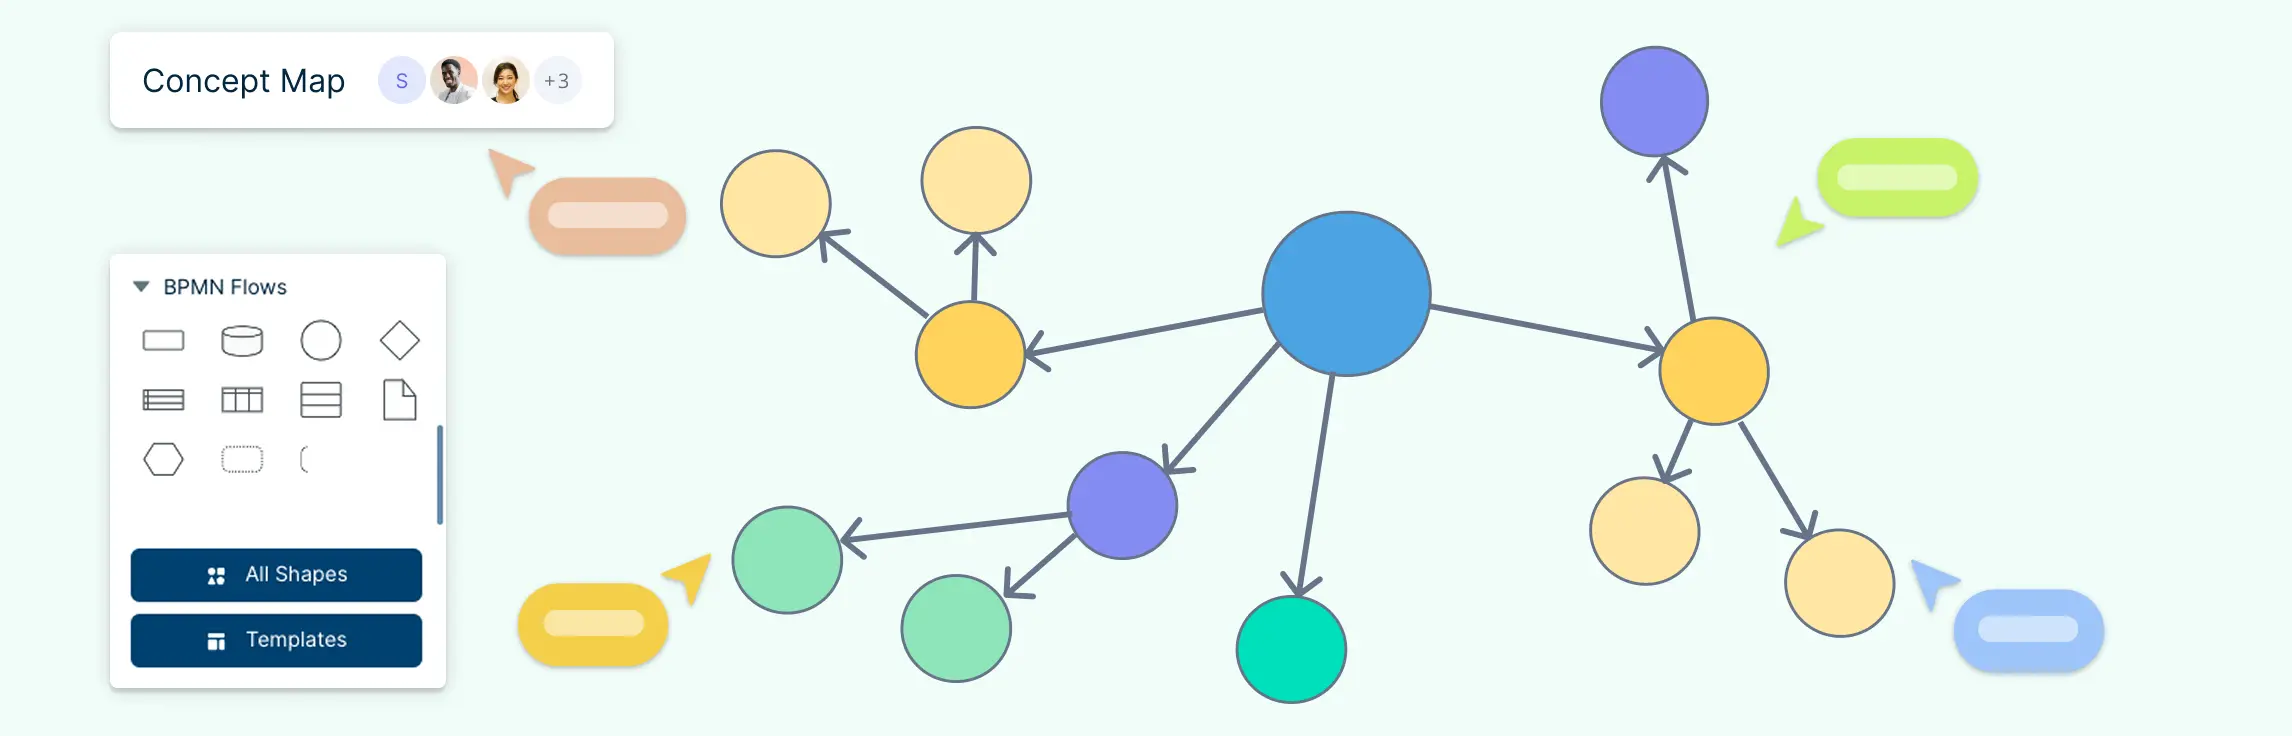
Definition of a Concept Map A concept map is a visual diagram that shows how ideas connect. It uses concepts, linking lines, and short relationship phrases to turn scattered information into a clear knowledge structure. Concept maps are useful for studying, teaching, research, planning, and explaining complex topics because they show not just what ideas exist, but how they relate.
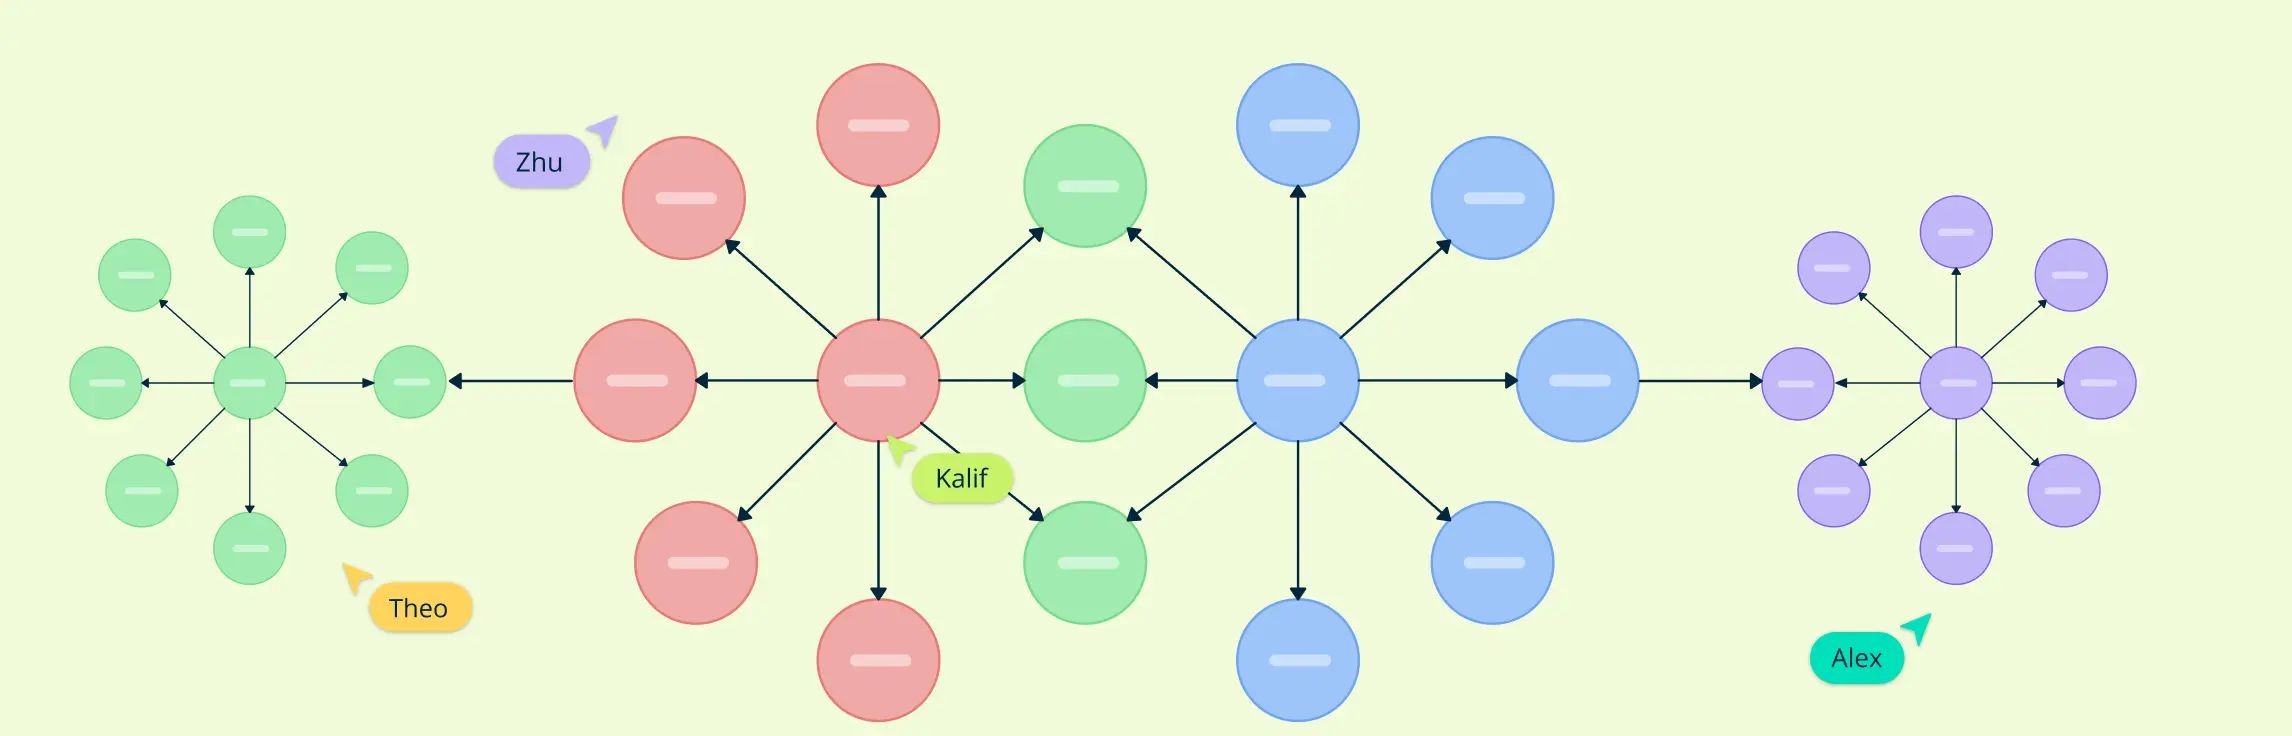
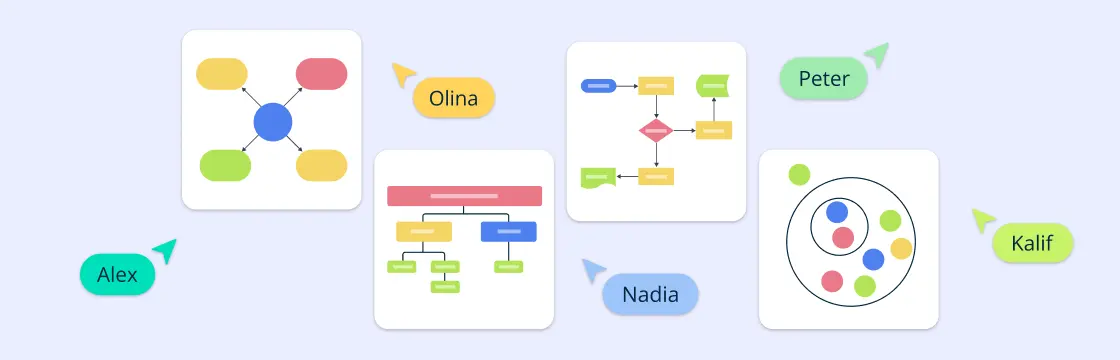
The four main types of concept maps are spider maps, flowcharts, hierarchy maps, and system maps. Each layout supports a different job: brainstorming ideas, explaining a process, organizing categories, or analyzing relationships in a system. Use this guide to choose the right concept map type, then start from an editable template.
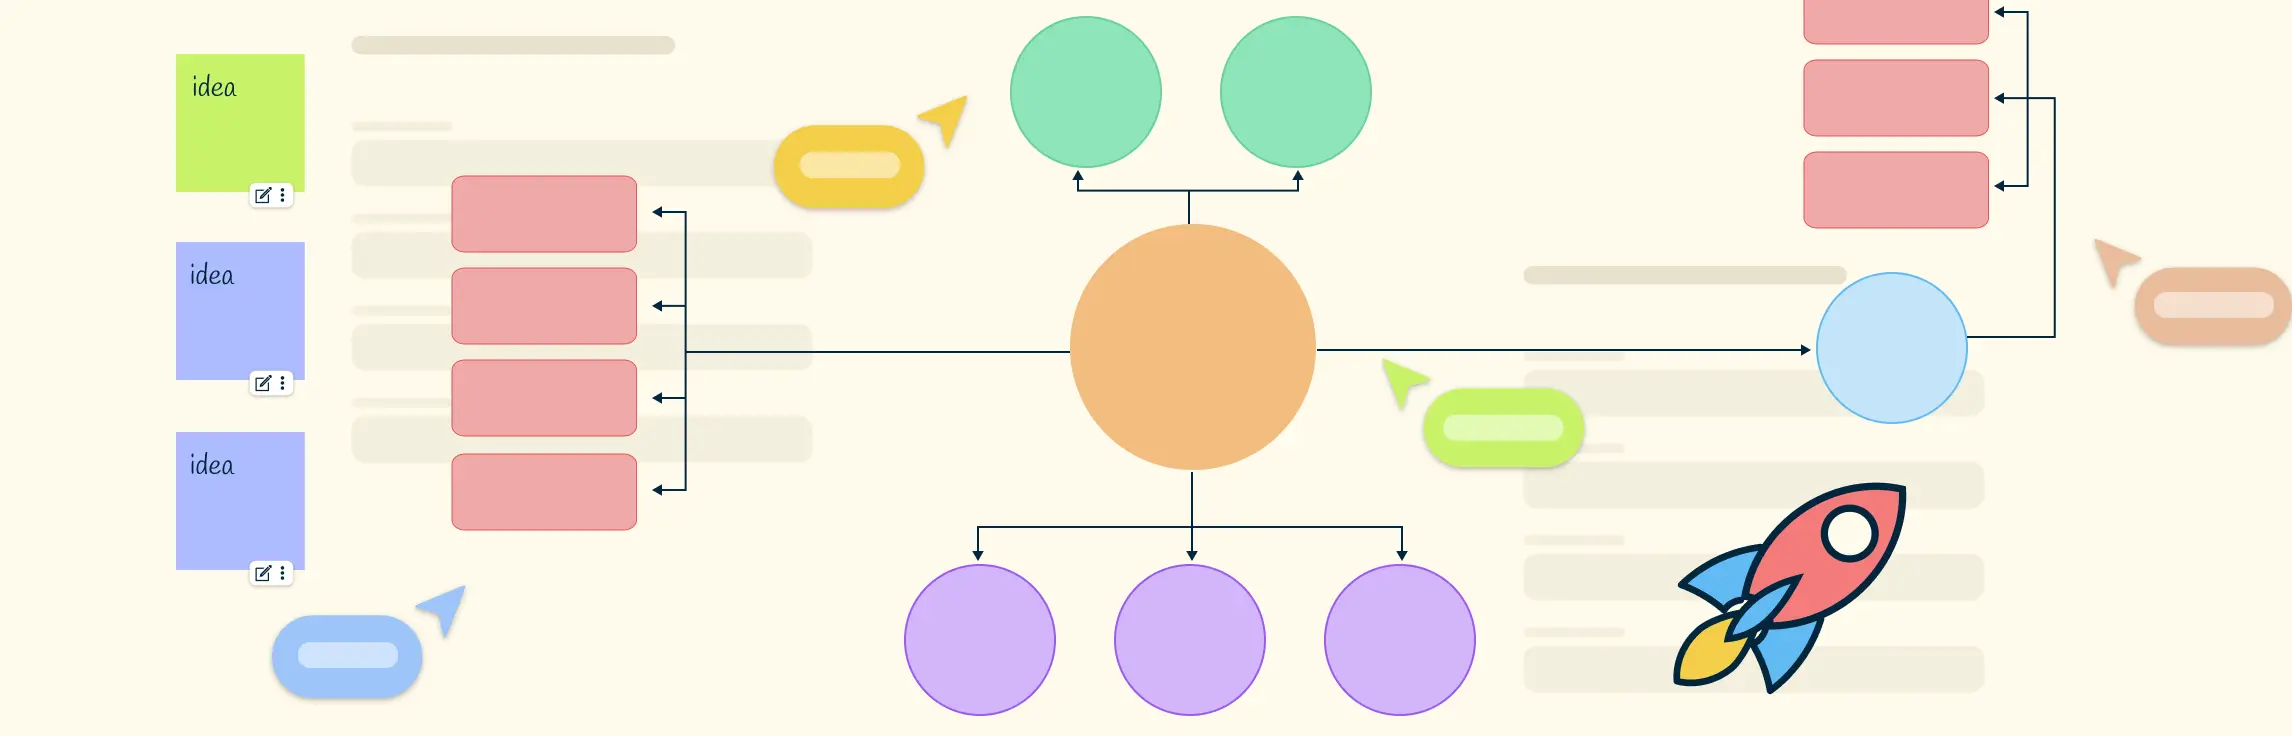
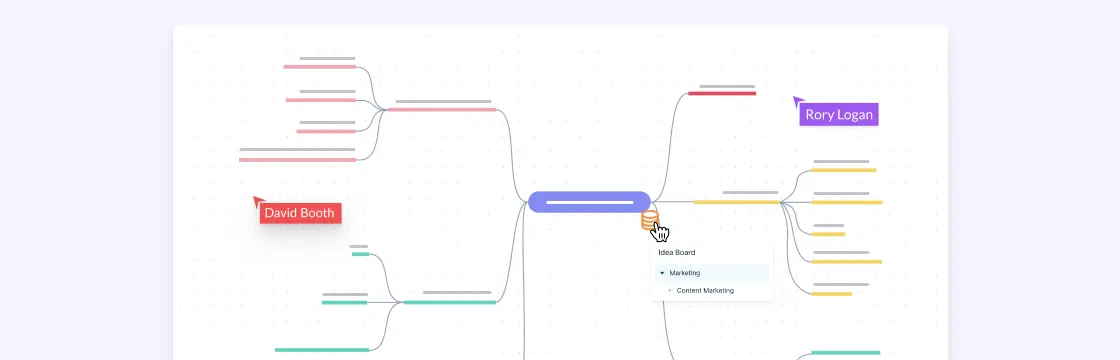
Every organization needs a steady supply of fresh creative ideas to stay relevant and ahead of their competitors successfully. As necessary as it is, generating good new ideas isn’t as easy as getting everyone in the team into a room and spending 3 hours to come up with barely anything.
To create a concept map, start with one clear focus topic, list the most important related concepts, arrange them from broad to specific, and connect them with labeled links that explain each relationship. The best concept maps are easy to scan, include cross-links where ideas overlap, and can be refined as your understanding improves.