What is the BCG Matrix Analysis
BCG matrix analysis is a strategic tool developed by the Boston Consulting Group to evaluate a company’s portfolio by plotting each product or business unit against two axes: relative market share and market growth rate. The analysis highlights which offerings drive growth, generate steady cash flow, or consume resources without adequate return.


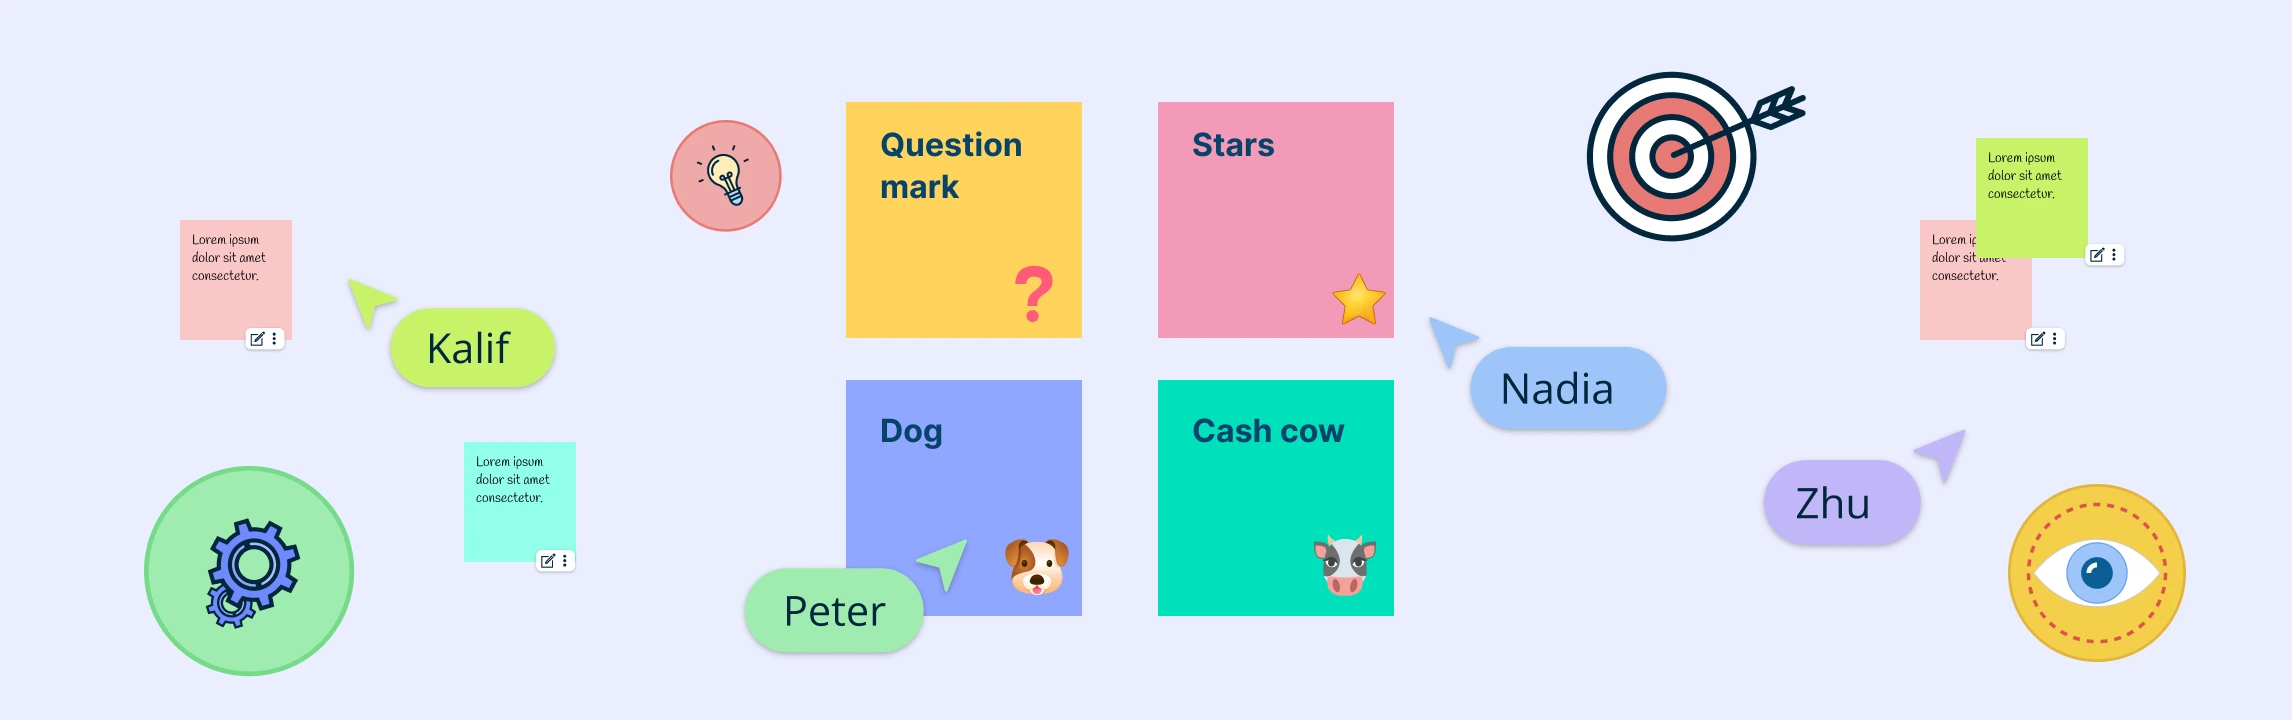
Core Quadrants of the Boston Consulting Group Matrix
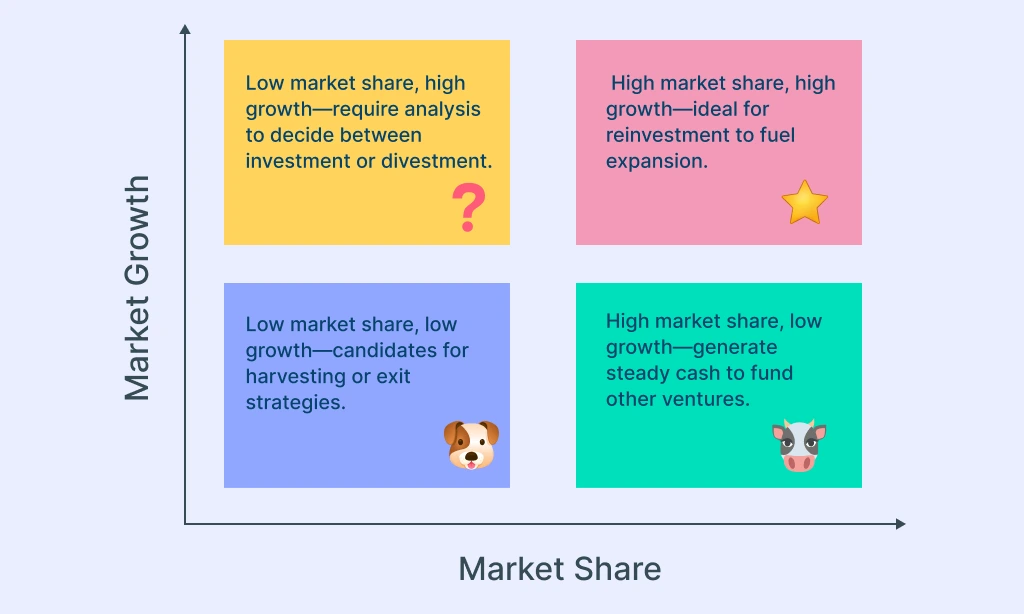
The horizontal axis of the BCG matrix measures relative market share, indicating a product’s competitive position. The vertical axis tracks market growth rate, signaling the attractiveness of the segment. Crossing these axes yields the four quadrants of the BCG matrix, each with distinct implications for resource allocation and strategic decision-making.
When and Why to Use the BCG Matrix
- Annual strategic planning cycles, where leadership evaluates resource distribution across business units.
- Portfolio reviews, identifying underperforming products for divestment and high-potential segments for investment.
- Mergers or acquisitions, assessing target companies’ offerings within a unified framework.
- Market entry evaluations, determining where new products fit relative to existing portfolio strengths.

How to Conduct a BCG Matrix Analysis with Creately
Step 1: Gather Market Data
Start by collecting data on sales, market size, and competitor performance. Use internal reports and external sources like industry analysts or market research platforms. Calculate relative market share by dividing your product’s revenue by that of the market leader. Use YoY changes or CAGR to determine market growth rate. Ensure data quality with validation checks and consistent formats. Accurate inputs are key for effective matrix placement.
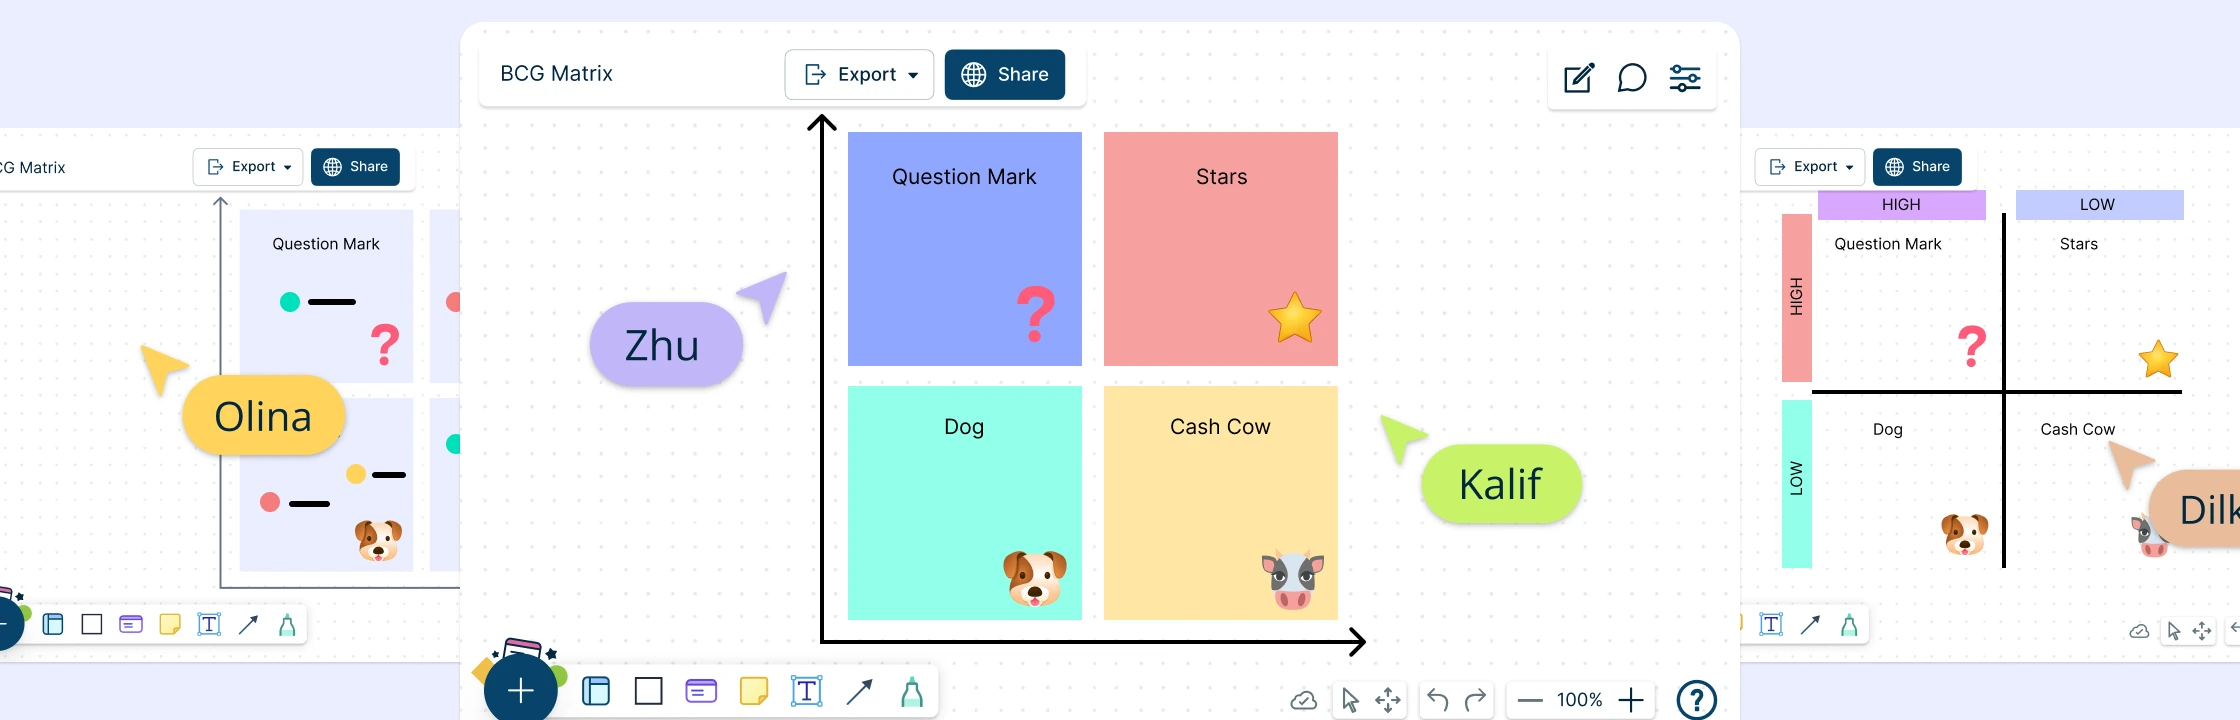
Step 2: Open the BCG Matrix Template
Launch Creately, and select the BCG Matrix template from the library to begin your visual analysis. The editable workspace provides quadrant layouts, and pre-set axes for easy product placement. Add your product categories and growth/share data to get started.
Tip: You can upload your supporting market data such as sales figures, market share calculations, or competitor benchmarks directly onto the canvas using sticky notes, data tables, or linked docs.
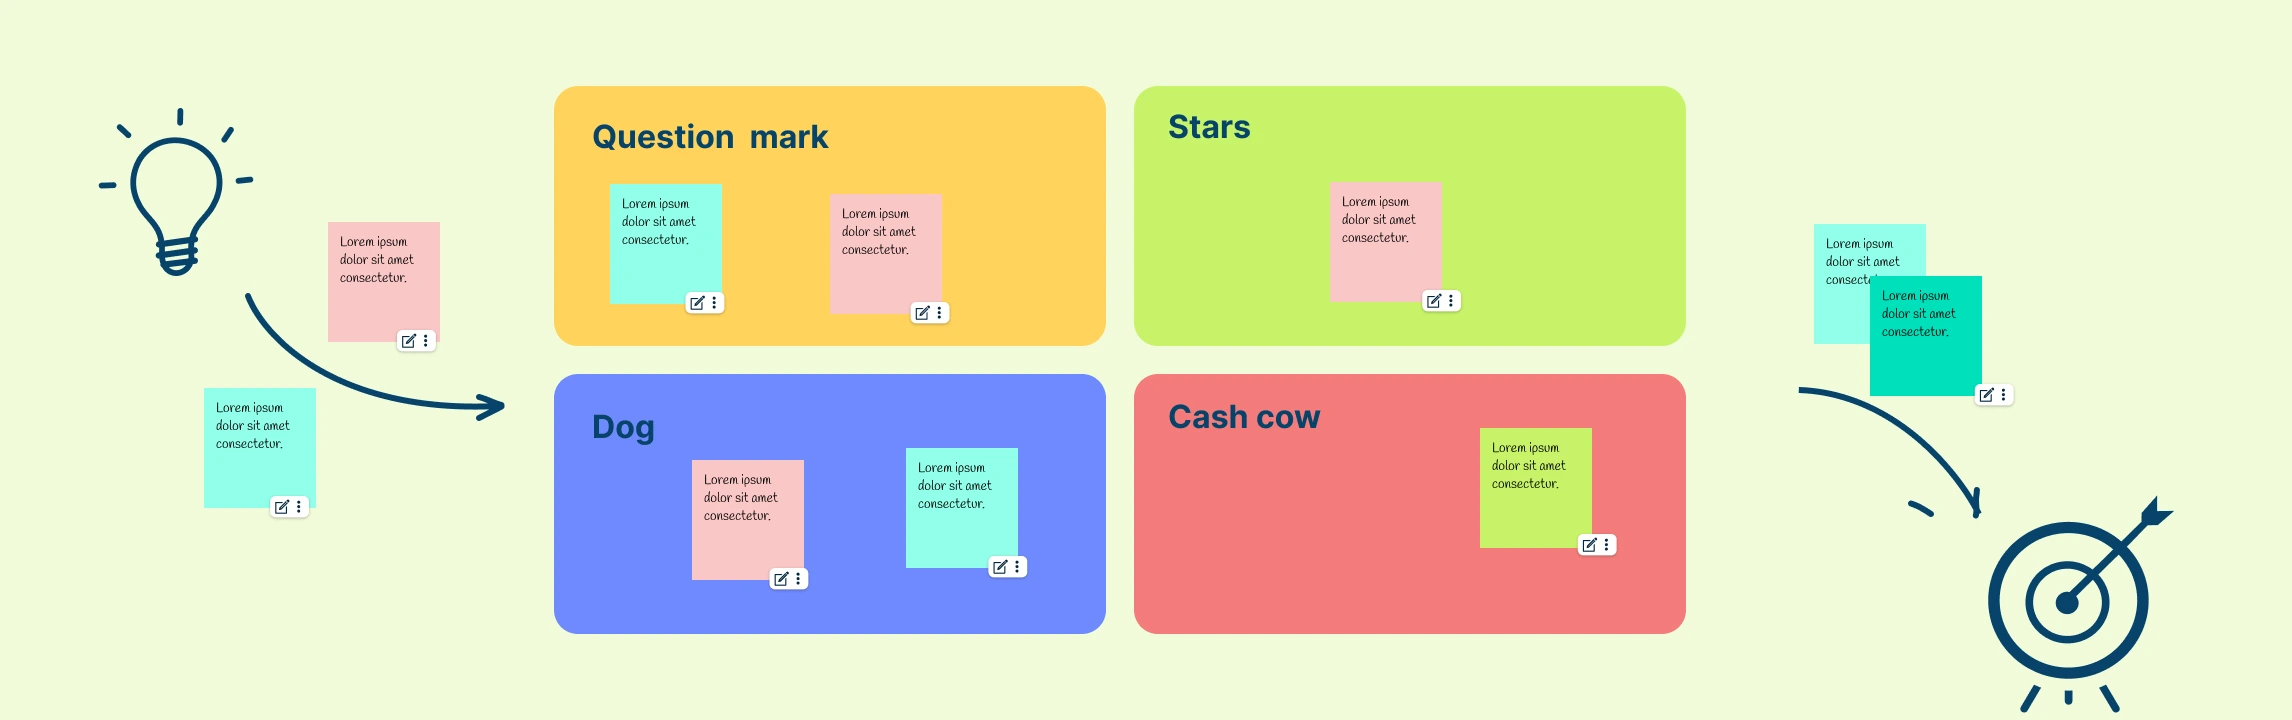
Step 3: Plot Products on the Matrix
Using your calculated data, plot each product or business unit in the appropriate quadrant. Place them based on growth and market share values. Use marker size to reflect revenue or volume and color-code by product category or lifecycle stage. Creately makes this easy with drag-and-drop placement, auto-scaling, and custom labels.
Tip: Use Creately’s AI BCG Matrix template to automatically suggest quadrant placement based on input data. This can help speed up analysis and ensure consistent positioning, especially when evaluating large or complex product portfolios.
Step 4: Analyze Quadrant Implications
Interpret what each BCG matrix quadrant means for your products.
- Stars: Plan continued investment to support growth and strengthen market leadership.
- Cash Cows: Optimize for profitability and use excess cash to fund Stars or promising Question Marks.
- Question Marks: Evaluate potential through deeper analysis and decide whether to invest further or phase out.
- Dogs: Consider cost-cutting, repositioning, or structured exits to free up resources.
Use Creately’s comment and note features to capture insights directly on the matrix for team review.
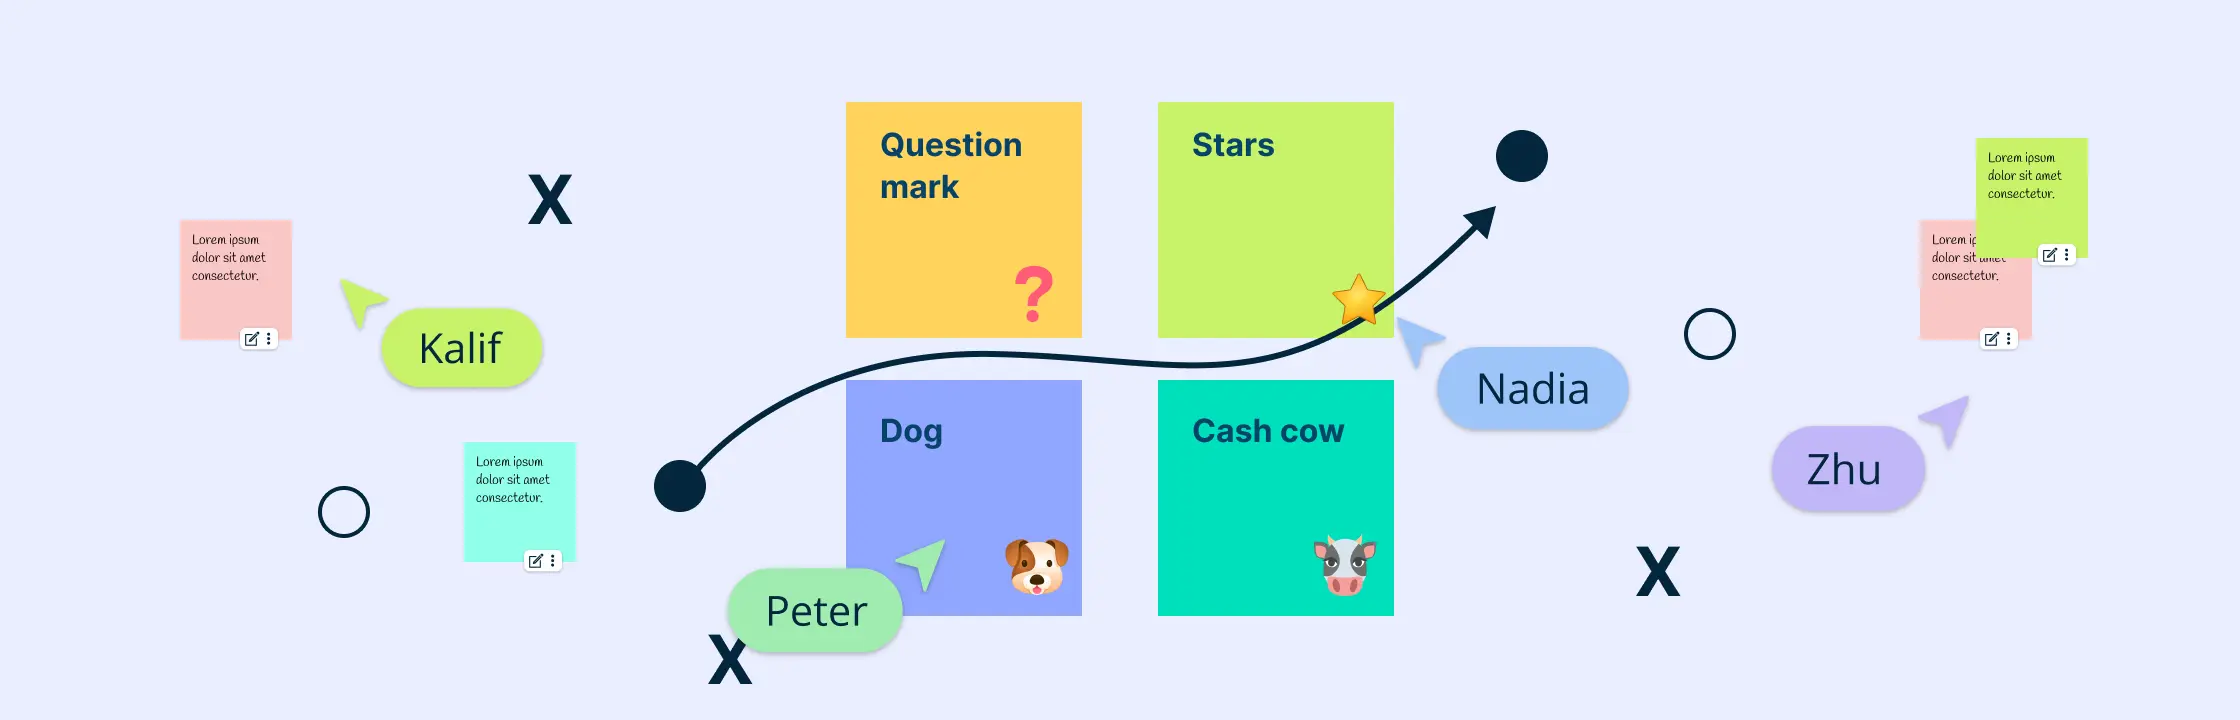
Step 5: Formulate Strategic Actions
Turn analysis into action plans. Define budgets, campaign priorities, and development efforts based on quadrant positions. Set KPIs to monitor product movement across the matrix over time. Use Creately’s collaboration tools to assign responsibilities, gather feedback, and maintain a living matrix that evolves with market changes and business goals.
Advanced Tips for Deepening Your BCG Analysis
- Trend Analysis & Scenario Planning: Overlay historical data trends and project various market scenarios. Simulate best, worst, and expected outcomes to anticipate shifts in quadrant placement.
- Geographic & Cohort Segmentation: Segment products by region or customer demographics. This granularity reveals localized opportunities and tailors strategies to specific markets.
- Framework Integration: Combine BCG Matrix Analysis with complementary models such as SWOT analysis. Layered frameworks enable multi-dimensional evaluations of portfolio attractiveness and competitive positioning.
- Dynamic Data Feeds: Link live market intelligence APIs to your matrix. Continuous updates maintain accuracy and highlight emerging trends as they develop in real time.
- Custom Metrics: Incorporate alternative performance indicators like customer lifetime value (CLV) or net promoter score (NPS) alongside growth and share metrics to enrich the analysis.
Limitations of the BCG Analysis
- Oversimplification: Reduces complex market dynamics to just two factors (growth and share), while ignoring other critical variables like competition, brand strength, or customer loyalty.
- Static Snapshot: Provides a point-in-time view, which may not reflect future trends or market shifts.
- Market Definition Challenges: Defining market size and share accurately can be subjective and misleading.
- Ignores Synergies: Doesn’t account for interdependencies between products or business units.
- Short-Term Focus: May encourage short-term profitability over long-term strategic value or innovation.
Origins of the Boston Consulting Group Matrix
Bruce Henderson of Boston Consulting Group introduced the BCG Matrix in the early 1970s to help executives manage diverse product lines more strategically. It was designed as a simple visual tool to assess business units based on their market share and industry growth. Over time, it became a foundational framework in corporate strategy, shaping how companies think about resource allocation, investment planning, and product lifecycle management. The simplicity of the BCG analysis made it widely adoptable, while its strategic depth ensured long-term relevance across industries.
Future of the BCG Analysis
Today, the BCG matrix analysis is a dynamic framework that incorporates real-time market data, competitive insights, and scenario planning. Creately enhances BCG Matrix analysis with AI-powered templates, collaborative workspaces, and integrated data inputs, making portfolio evaluations more current, visual, and actionable.
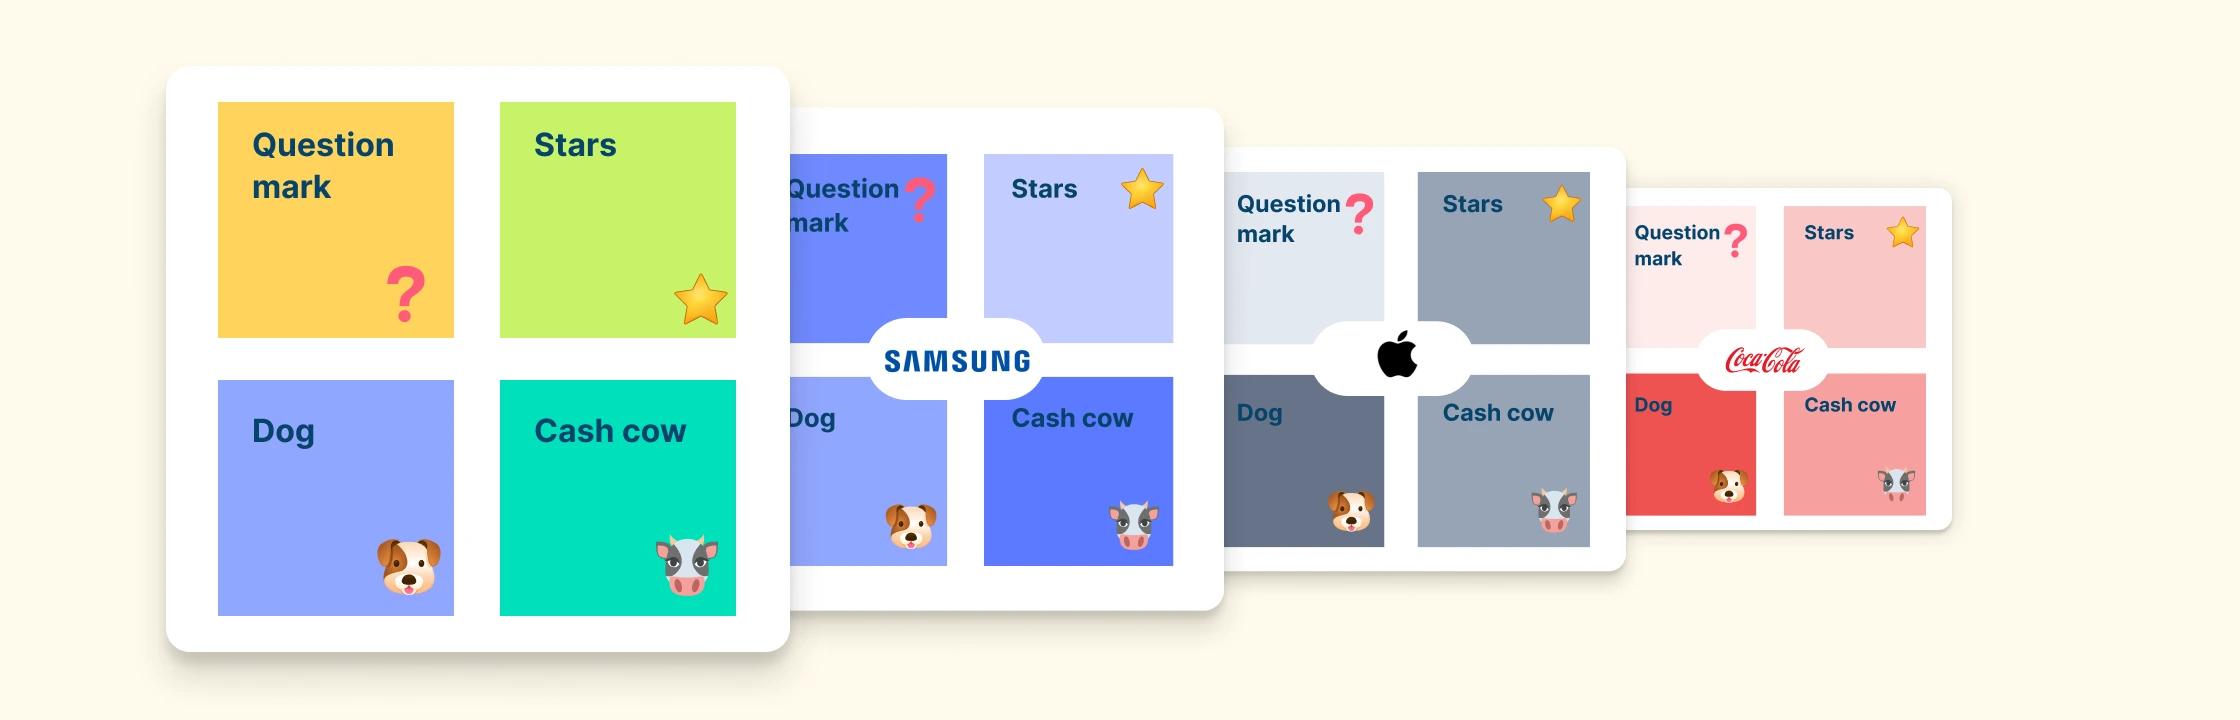
BCG Matrix Examples


Helpful Resources for BCG Matrix Analysis
Learn how the BCG Matrix Analysis is applied in practice by leading companies.
Learn how BCG analysis can be applied to optimize marketing resource allocation and tailor effective marketing strategies.
Learn to identify and manage high-profit, low-investment products within a business portfolio.
FAQs about BCG Matrix Analysis
What is the BCG Matrix?
Can the BCG Matrix analysis be used for digital marketing or service-based businesses?
Is the BCG Matrix Used in the Real World?
What is the BCG strategy analysis?
When should I update my BCG Matrix?
Resources
García-Vidal, Gelmar , et al. “Contribution Margin and Quantity Matrix to Analyze the Product Portfolio in the Context of SMEs. Criticism of the BCG Matrix and Its Alternatives.” Cogent Business & Management, vol. 10, no. 3, 6 Sept. 2023, https://doi.org/10.1080/23311975.2023.2233272.
Madsen, Dag. “Not Dead Yet: The Rise, Fall and Persistence of the BCG Matrix.” Problems and Perspectives in Management, vol. 15, no. 1, 28 Mar. 2017, pp. 19–34, https://doi.org/10.21511/ppm.15(1).2017.02.