What is the BCG Matrix in Marketing
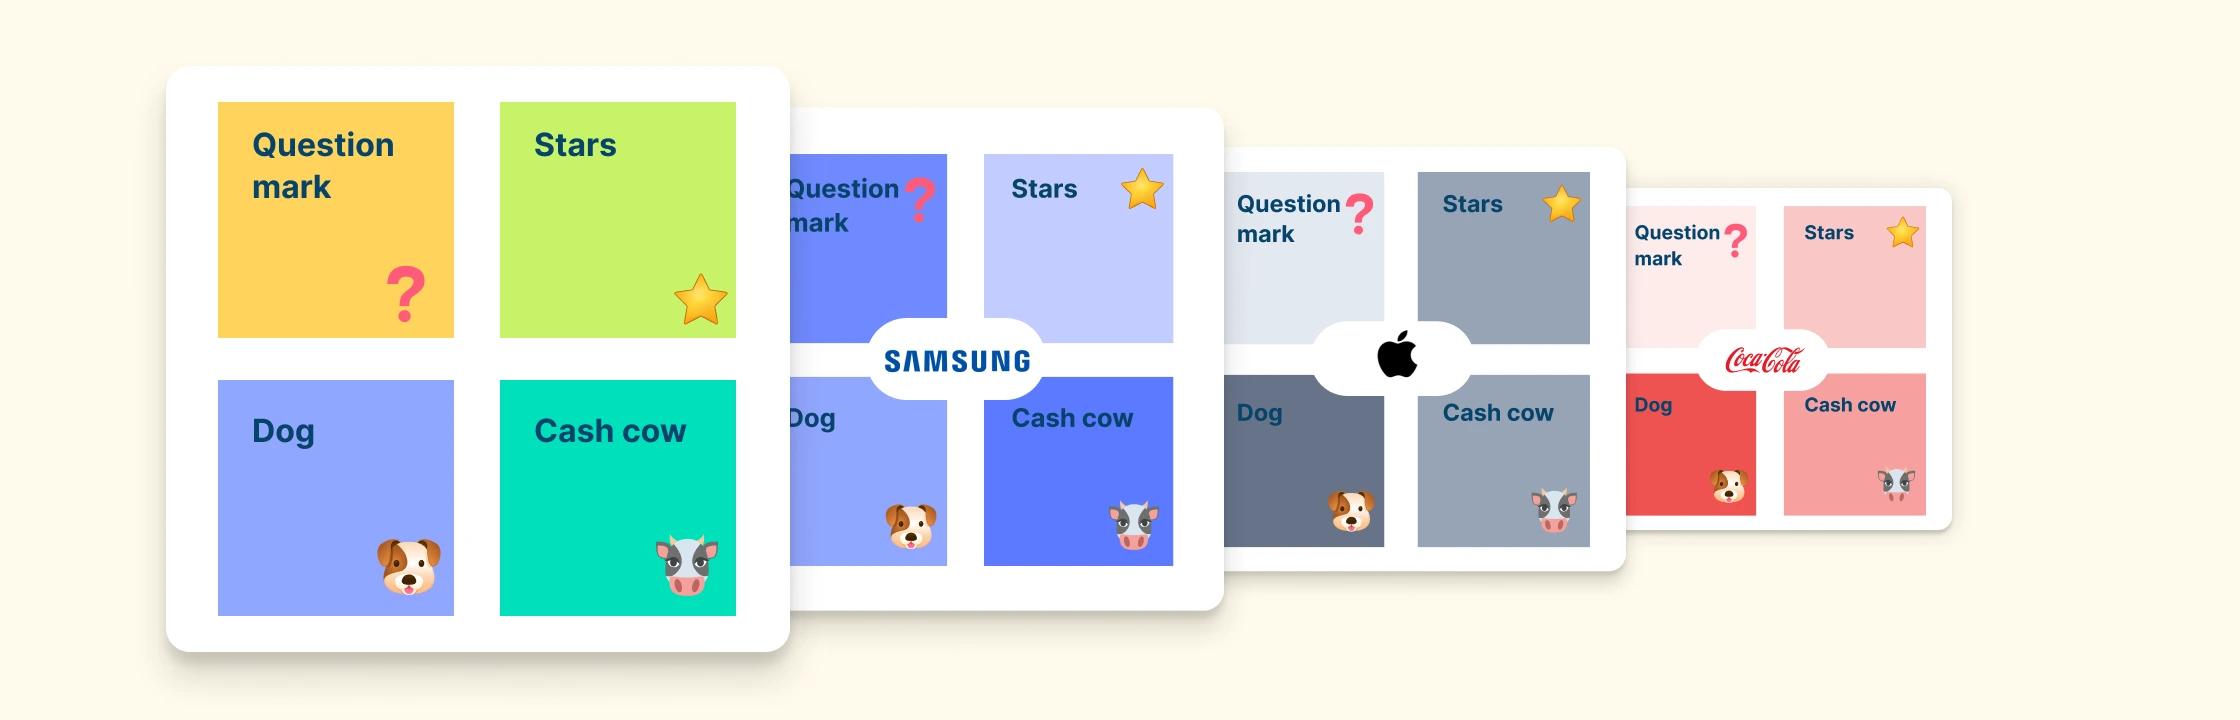
The BCG Marketing Matrix, also known as the Boston Consulting Group Matrix or Growth-Share Matrix, is a strategic tool used by marketers to evaluate a company’s product portfolio. It categorizes products into four quadrants (Stars, Cash Cows, Question Marks, and Dogs) based on their market growth rate and relative market share. This framework helps businesses allocate resources more effectively and tailor marketing strategies according to each product’s performance and market position.


Why Use BCG in Marketing Strategy Planning
Here’s why integrating the BCG Matrix into your marketing strategy planning is not just beneficial but essential.
Marketing Resource Allocation
One of the biggest advantages of using BCG in marketing is its ability to guide smart resource allocation. By categorizing products into the correct BCG quadrants, marketers can allocate budgets, campaign focus, and team effort where they’ll have the most impact. This maximizes ROI and long-term portfolio value.
Tailored Marketing Strategies
Armed with insights from the BCG Matrix, marketers can develop tailored marketing strategies for each product category. Whether it’s aggressive growth strategies for stars, optimization tactics for cash cows, experimental approaches for question marks, or exit strategies for dogs, the BCG Matrix informs targeted action plans.
Risk Mitigation and Opportunity Identification
The BCG Matrix serves as a risk mitigation tool by highlighting potential pitfalls and opportunities within the product portfolio. By proactively addressing challenges posed by low-growth products or seizing opportunities presented by high-growth products, marketers can steer the company towards sustained success.
Adaptability to Market Dynamics
The BCG Matrix provides a framework for continuously monitoring and adjusting marketing strategies based on changing market dynamics, competitor actions, and consumer preferences, ensuring relevance and competitiveness over time.
Data-driven Decision Making
The BCG Matrix facilitates data-driven decision-making by providing a structured framework for analyzing market data and assessing product performance. By leveraging market research, sales data, and customer feedback, marketers can make informed decisions that drive tangible results and drive business growth.

BCG Matrix Applications in Digital Marketing
Digital marketers can use the BCG Matrix to evaluate the performance and potential of various digital assets, such as campaigns, content types, or product categories in e-commerce. The criteria for evaluation can be click-through rate, conversion rate, customer acquisition cost, and ROI. The results of this analysis can reveal the following.
- Stars may represent high-converting landing pages or viral social campaigns with strong traffic growth and market share.
- Cash Cows could be evergreen content, SEO pages, or top-selling products that generate consistent engagement and revenue with minimal investment.
- Question Marks might include experimental ad formats or new content strategies with high traffic potential but uncertain conversion performance.
- Dogs could be underperforming digital assets that drain budget without delivering meaningful returns.
How to Integrate the BCG in Marketing
The BCG Matrix is more than just a theoretical framework; it’s a practical tool that can significantly impact your marketing strategy. Here’s how to effectively use BCG in marketing strategy.
Step 1: Conduct a Product Portfolio Analysis
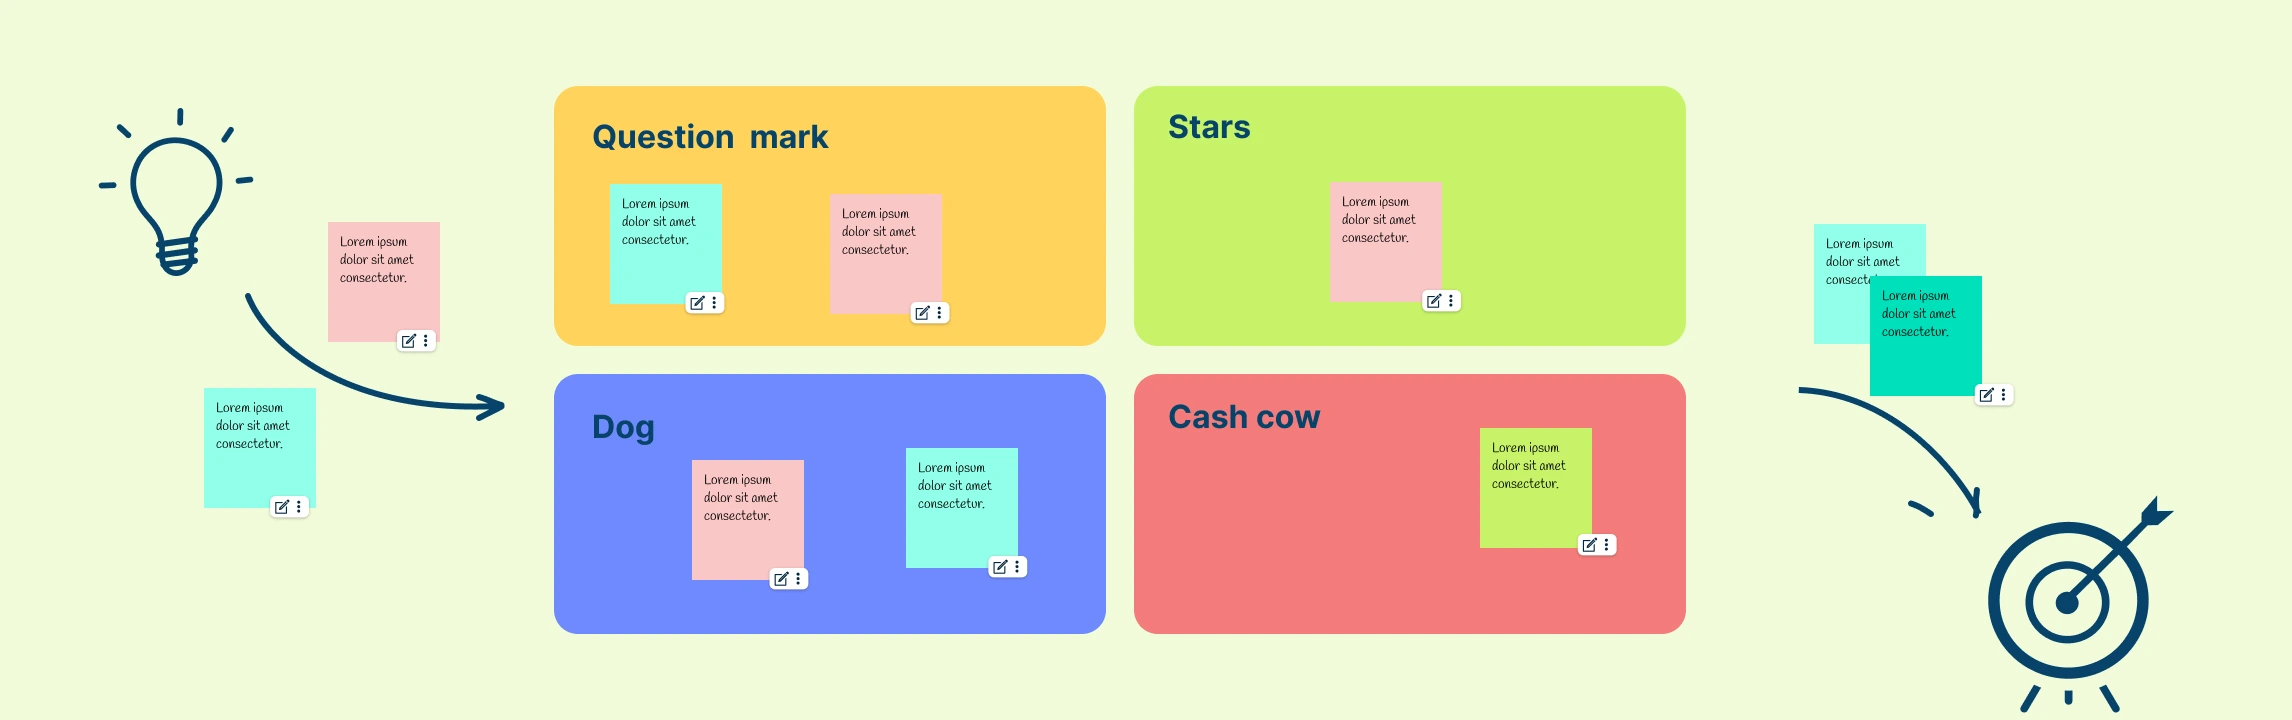
Begin by analyzing your product portfolio and categorizing each product or service into one of the four quadrants of the BCG Matrix: Stars, Cash Cows, Question Marks, and Dogs. Assess each product’s market growth rate and relative market share to determine its position within the matrix. This step helps create a clear picture of your overall product health and competitive standing.
Step 2: Consider the Product Lifecycle Stage
To enrich your BCG marketing analysis, incorporate the product lifecycle stage of each offering:
- Question Marks often align with the Introduction phase.
- Stars with the Growth phase.
- Cash Cows with Maturity.
- Dogs with Decline.
Using both the matrix and lifecycle lens provides a more strategic view of each product’s potential.
Step 3: Strategically Allocate Resources Using Data-Driven Insights
Once your products are categorized, the next step is to allocate marketing resources based on data-driven insights. Combine internal performance metrics with external market intelligence to guide investment decisions.
- Invest in Stars and high-potential Question Marks to accelerate growth.
- Sustain Cash Cows through efficient marketing that protects their profitability.
- Evaluate Dogs critically and consider repositioning, niching down, or phasing them out.
Leverage analytics tools to model budget impact, forecast returns, and simulate different investment scenarios.
Step 4: Develop Targeted Marketing Strategies for Each Quadrant
Tailor your marketing strategies based on the characteristics of products within each quadrant of the BCG Matrix.
- Stars: Deploy high-impact, growth-oriented campaigns. Emphasize brand leadership, new features, and market expansion.
- Cash Cows: Focus on retention, loyalty programs, and cost-efficiency. These products fund the rest of the portfolio.
- Question Marks: Test various positioning angles, channels, and messages. Use performance data to guide go/no-go decisions.
- Dogs: Scale back investment. If repositioning isn’t viable, plan a structured exit to reallocate resources elsewhere.
Step 5: Incorporate External Market Dynamics
While the BCG Matrix provides a strong internal snapshot, integrating external insights ensures a more robust analysis. Consider factors such as:
- Shifts in consumer behavior or preferences.
- Regulatory or economic changes.
- Emerging technologies or competitive disruptions.
Step 6: Scenario Planning
Use scenario planning to forecast how these factors might influence each product’s trajectory. This will prepare your team for strategic pivots when necessary. Create multiple plausible future states like best case, worst case, and moderate to simulate how products may move between quadrants over time. This forward-thinking approach helps you prepare proactive strategies instead of reactive responses
Step 7: Monitor, Iterate, and Optimize
Your product landscape and market environment won’t stay still and neither should your strategy. Establish a regular review process to:
- Track changes in market share, sales, and campaign performance.
- Update product positioning in the matrix based on new data.
- Identify areas where strategies are working or falling short.
Refine your approach continuously and experiment with new tactics to improve outcomes across all quadrants.
Step 8: Foster Cross-Functional Collaboration
Using BCG in marketing strategy delivers the most value when insights are shared across departments. Ensure collaboration with:
- Marketing teams to craft and adjust campaign strategies.
- Product managers to align roadmap priorities.
- Sales teams for customer feedback and ground-level insights.
- Finance teams to validate budget plans and profitability assumptions.
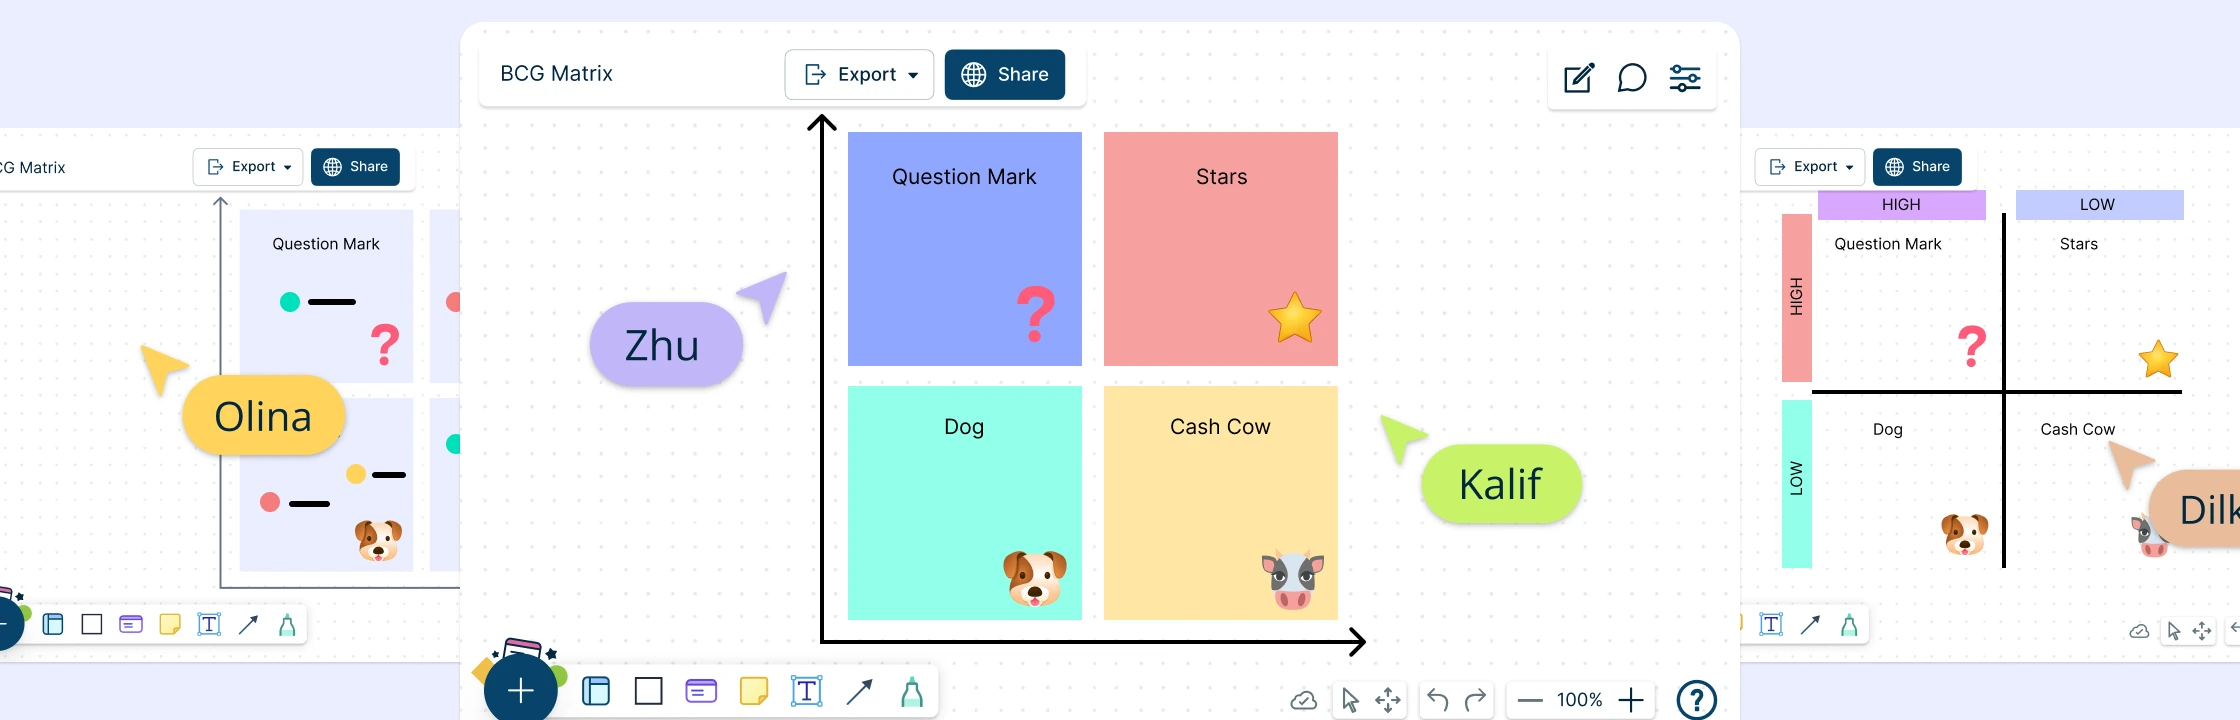
Using a shared workspace like Creately helps centralize matrix marketing data, align stakeholders, and drive unified action.
Step 9: Using Creately’s AI-powered BCG Matrix Template
Accelerate your BCG analysis with Creately’s AI BCG Matrix template. Simply input your product details (market share, growth rate, and revenue), and let the AI suggest the initial quadrant placement for each item. From there, you can:
- Visually adjust product positions as new data becomes available.
- Enrich the matrix with comments, supporting data, and team annotations.
- Collaborate in real time with marketing, product, and leadership teams in a shared visual workspace.
BCG in Marketing Examples


From Insight to Action: The Strategic Value of BCG Matrix Marketing
The BCG Matrix serves as a valuable tool for mapping market potential and guiding strategic decision-making in marketing. By understanding where your products stand within the matrix, you can develop targeted strategies to drive growth, optimize profitability, and maintain a competitive edge in the market. Incorporate the BCG in marketing strategies to unlock the full potential of your product portfolio and achieve sustainable success.
Helpful Resources for BCG Matrix
Learn what the BCG Matrix is, how to apply it, benefits, limitations, and templates.
Find out the role of the BCG matrix in a company’s strategic decision-making.
Learn about the core quadrants of the BCG, how to do the analysis and advanced tips.
FAQs about BCG Marketing Strategy
What are the limitations of the BCG Matrix in marketing?
- Oversimplifies market dynamics.
- Doesn’t consider external factors (e.g., competitors, trends).
- Focuses only on market share and growth, not profitability or brand strength.
How do I gather data for a BCG Matrix analysis?
You typically need:
- Market growth rates (industry reports, trend analysis).
- Relative market share (your brand vs. top competitor).
- Sales data, performance metrics, and campaign ROI.
When should marketers use the BCG Matrix?
- During annual marketing planning.
- When launching or retiring products.
- To evaluate product mix performance across multiple channels.
Resources
Kader, Md Abdul, and Hanif Hossain. “AN ANALYSIS on BCG GROWTH SHARING MATRIX.” International Journal of Economics, Business and Accounting Research (IJEBAR), vol. 4, no. 01, 26 Mar. 2020, https://jurnal.stie-aas.ac.id/index.php/IJEBAR/article/view/971.
Kukartsev, V V, et al. “The Analysis of Methods for Developing the Marketing Strategies in Agribusiness.” IOP Conference Series: Earth and Environmental Science, vol. 315, no. 2, 23 Aug. 2019, p. 022107, https://doi.org/10.1088/1755-1315/315/2/022107.