In this guide, we’ll explain what a block flow diagram is, its purpose in process design, the key components that make it effective, and how to create one. You’ll also learn how it compares to more detailed diagrams like process flow diagrams, along with its benefits, limitations, and practical uses in engineering workflows.
Block Flow Diagram Definition
A Block Flow Diagram (BFD) is a simplified graphical representation of a process that illustrates the main steps or units in a system. It is a type of engineering block diagram that uses labeled blocks connected by lines or arrows to show the flow of materials and energy. It provides a broad overview of how a process functions without including detailed instrumentation or equipment information. In block diagram engineering, BFDs are typically used in the early stages of process design to communicate system structure, major operations, and overall flow direction.
Purpose of a Block Process Diagram
Provides a simplified process overview that outlines how materials and energy move through major system stages.
Defines system boundaries by showing where the process begins, ends, and interacts with external systems.
Communicates key process steps clearly to engineers, designers, and stakeholders before detailed design begins.
Supports early-stage planning by helping identify inputs, outputs, and major functional blocks.
Acts as a foundation for detailed diagrams such as process flow diagrams (PFDs) and piping & instrumentation diagrams (P&IDs).
Read the piping and instrumentation diagram guide to learn more about when to use them, their key symbols, and how to make them.
When to Use Block Flow Diagrams
Conceptual Process Design: Commonly applied during conceptual design, feasibility evaluation, and training to simplify communication and early-stage decision-making.
Feasibility and Economic Studies: Helps assess process alternatives, energy requirements, and material usage without the complexity of detailed schematics.
Process Optimization: Simplifies visualization of current operations to identify inefficiencies, bottlenecks, or potential improvements.
Process Simulation and Modeling: Provides a structural basis for digital simulations or software models by defining system boundaries and connections.
Communication and Documentation: Used to present process concepts to non-technical stakeholders, management, or clients in a simple, easy-to-understand format.
Educational and Training Purposes: Serves as a teaching tool in block diagram engineering to explain process fundamentals, energy flow, and system behavior without overwhelming detail.
Multidisciplinary Coordination: Helps chemical, mechanical, and control engineers align their understanding of the process during design reviews and collaboration sessions.
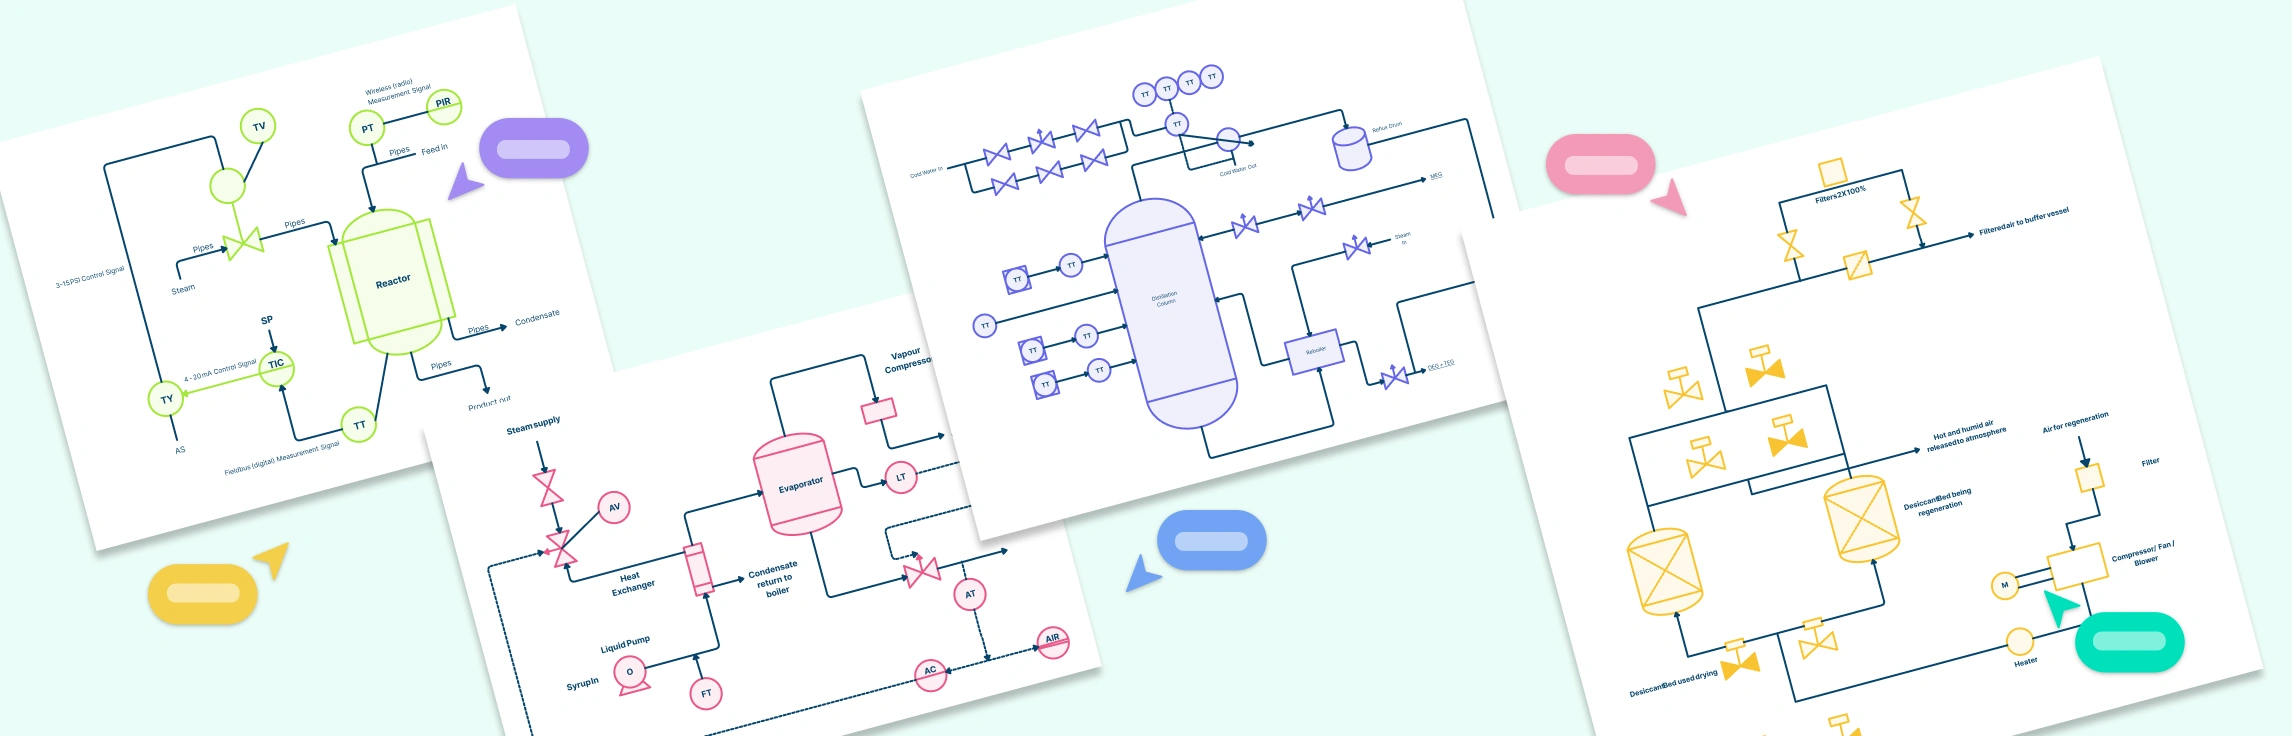
Block Flow Diagram Symbols
Process Blocks or Units: Shown as rectangles, these represent major process stages such as mixing, heating, or separation. Each block is labeled with the name or function of that process step.
Flow Lines and Arrows: Represented by solid lines with arrows, these indicate the direction of material or energy flow between process units. The thickness or style of the line may vary depending on the type of stream.
Inputs, Outputs, and Streams: Displayed as arrows entering or leaving the blocks, they identify raw materials, product streams, or utility flows such as steam, water, or electricity.
Basic Equipment Symbols or Labels: Shown as simplified shapes (for example, circles for pumps, triangles for compressors, or basic icons for reactors and heat exchangers), providing a visual cue for key equipment without detailed specifications.
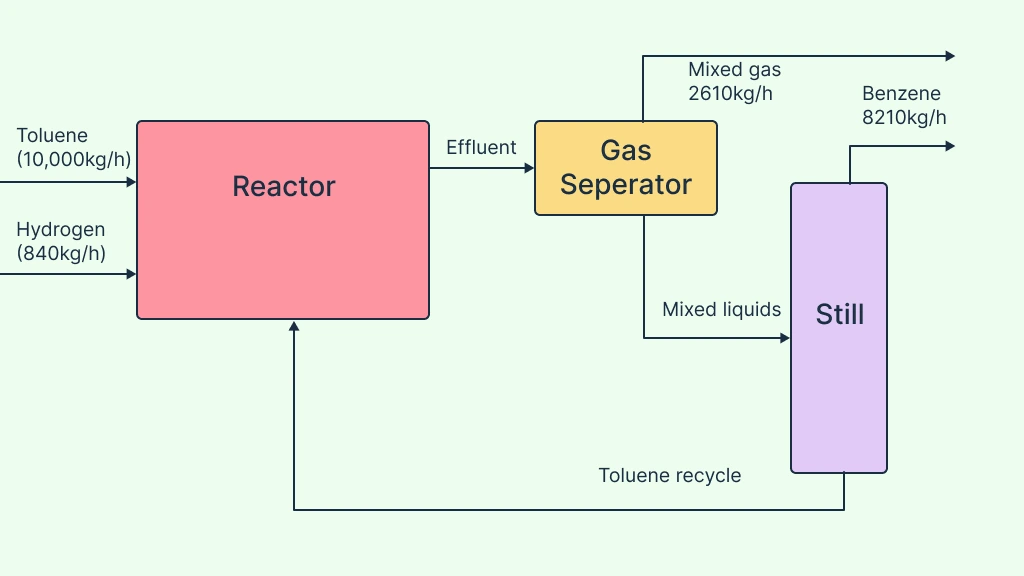
A simple block flow diagram example:
How to Create a Block Flow Diagram
Step 1: Gather Process Information
Start by collecting essential data from conceptual designs, process descriptions, or Process Flow Diagrams (PFDs). Identify the main operations, input and output streams, and the overall process objective. This ensures your diagram accurately represents the system at a high level.
Step 2: Define System Boundaries
Determine where the process starts and ends, and what external systems interact with it. Establishing system boundaries helps you decide which operations to include in the diagram and which to represent as external inputs or outputs.
Step 3: Simplify Complex Systems into Main Functional Blocks
Break down the process into major functional units such as feed preparation, reaction, separation, or purification. Represent each unit as a single labeled block that summarizes its main function without detailed mechanical or control information.
Step 4: Arrange Blocks in Logical Flow Sequence
Position each block from left to right or top to bottom to show the logical order of operations. Use arrows to indicate the direction of material or energy flow. Keep spacing consistent to make the diagram easy to read.
Step 5: Add Inputs, Outputs, and Streams
Include feed streams, product streams, and utility inputs such as air, steam, or water. Label each stream with its name, type, or stream number for easy reference. If useful, you can also indicate whether the flow is continuous, batch, or cyclic.
Step 6: Include Basic Equipment or Process Labels
For clarity, add basic equipment labels or icons. For example, a reactor, pump, or heat exchanger if they help illustrate key transformations or energy transfers. Keep symbols minimal to avoid clutter, as the goal is simplicity rather than detailed representation.
Step 7: Review and Refine the Diagram
Check for clarity, completeness, and logical flow. Ensure that all key operations and streams are represented and that the flow direction aligns with the process narrative. If multiple stakeholders are involved, review collaboratively for accuracy.
Block Flow Diagram Vs Process Flow Diagram
Both block flow diagrams and process flow diagrams are essential tools in process engineering, but they serve different purposes and levels of detail in the design hierarchy. Read the process flow diagram guide to learn more about their symbols, benefits, and when to use them.
Aspect | Block Flow Diagram (BFD) | Process Flow Diagram (PFD) |
Purpose | Provides a high-level overview of the process showing main operations or blocks. | Offers a detailed process view, including equipment, control flows, and major process parameters. |
Level of Detail | Simplified — focuses on overall process sequence and material flow between main units. | More detailed — includes specific equipment names, stream data, operating conditions, and control systems. |
Representation | Each operation or process stage is shown as a single labeled block connected by arrows. | Shows individual equipment with labeled streams, valves, and sometimes key instruments. |
Information Included | - Major process steps or functional blocks. - General material or energy flows. - System boundaries. | - Equipment IDs and stream numbers. - Pressure, temperature, and composition data. - Control and safety systems. |
Users | Used by process engineers and planners during conceptual design and feasibility studies. | Used by design, operations, and instrumentation teams for detailed engineering and analysis. |
Stage of Use | Early-stage conceptual design. | Intermediate to detailed design phase. |
Complexity | Simple and easy to interpret. | More complex and data-driven. |
Output Use | Forms the foundation for PFDs and P&IDs. | Used for equipment sizing, control logic, and detailed documentation. |
Use Creately’s process flow diagram software to visualize and document process systems with clarity and precision. It includes standardized PFD symbols and templates, enabling you to easily design accurate, compliant diagrams that reflect real industrial and chemical processes.
Benefits of Using Process Block Flow Diagrams
Improves Team Collaboration: Enables better coordination between process, mechanical, and control engineers by providing a common visual framework for discussion.
Simplifies Technical Communication: Makes it easier to present process concepts to management, clients, and non-technical stakeholders without overwhelming them with detailed data.
Speeds Up Decision-Making: Allows engineers to compare process alternatives quickly, identify dependencies, and make informed design choices early in a project.
Supports Feasibility and Preliminary Studies: Ideal for evaluating new process ideas, estimating resource needs, and assessing project viability before detailed modeling begins.
Enhances Documentation and Reporting: Provides a concise, visual summary that can be used in project reports, proposals, or design review presentations.
Limitations of Block Process Diagrams
Lack of Instrumentation and Control Details: Block Process Diagrams do not include information about sensors, control valves, or automation systems, making them unsuitable for control or system integration work.
No Equipment or Design Specifications: They omit detailed data such as equipment size, material specifications, and operating parameters that are required for detailed engineering.
Unsuitable for Construction or Operational Planning: BFDs provide only a conceptual view and cannot be used to plan installation, maintenance, or plant operations.
Limited Process Accuracy: Quantitative data such as flow rates, pressures, and temperatures are not shown, so the diagram cannot be used for performance calculations or design validation.
Over-Simplification of Complex Systems: By summarizing entire operations into single blocks, some process interactions or dependencies may be overlooked during early analysis.
Free Block Flow Diagram Templates to Get Started


FAQs about the Process Block Flow Diagram
Can I use BFDs for operational or construction planning?
How detailed should a Block Flow Diagram be?
Are there any standards for creating process block diagrams?
Resources
Lange, Hannes, et al. “Modularization Approach for Large-Scale Electrolysis Systems: A Review.” Sustainable Energy and Fuels, 1 Jan. 2024, https://doi.org/10.1039/d3se01588b.
Zhang, Jiamin, et al. “Sensemaking of Block Flow Diagrams in Chemical Engineering.” Asee.org, 25 June 2023, https://peer.asee.org/sensemaking-of-block-flow-diagrams-in-chemical-engineering.