If you’ve ever confused an ERD with a class diagram, you’re not alone. ERDs show how data is structured in a database, while class diagrams show how that data behaves in software. Use ERDs for database design and class diagrams for object-oriented planning. This guide breaks down their differences, notations, mapping patterns, conversion steps, real-world examples, a migration checklist, and templates to build your own models quickly.
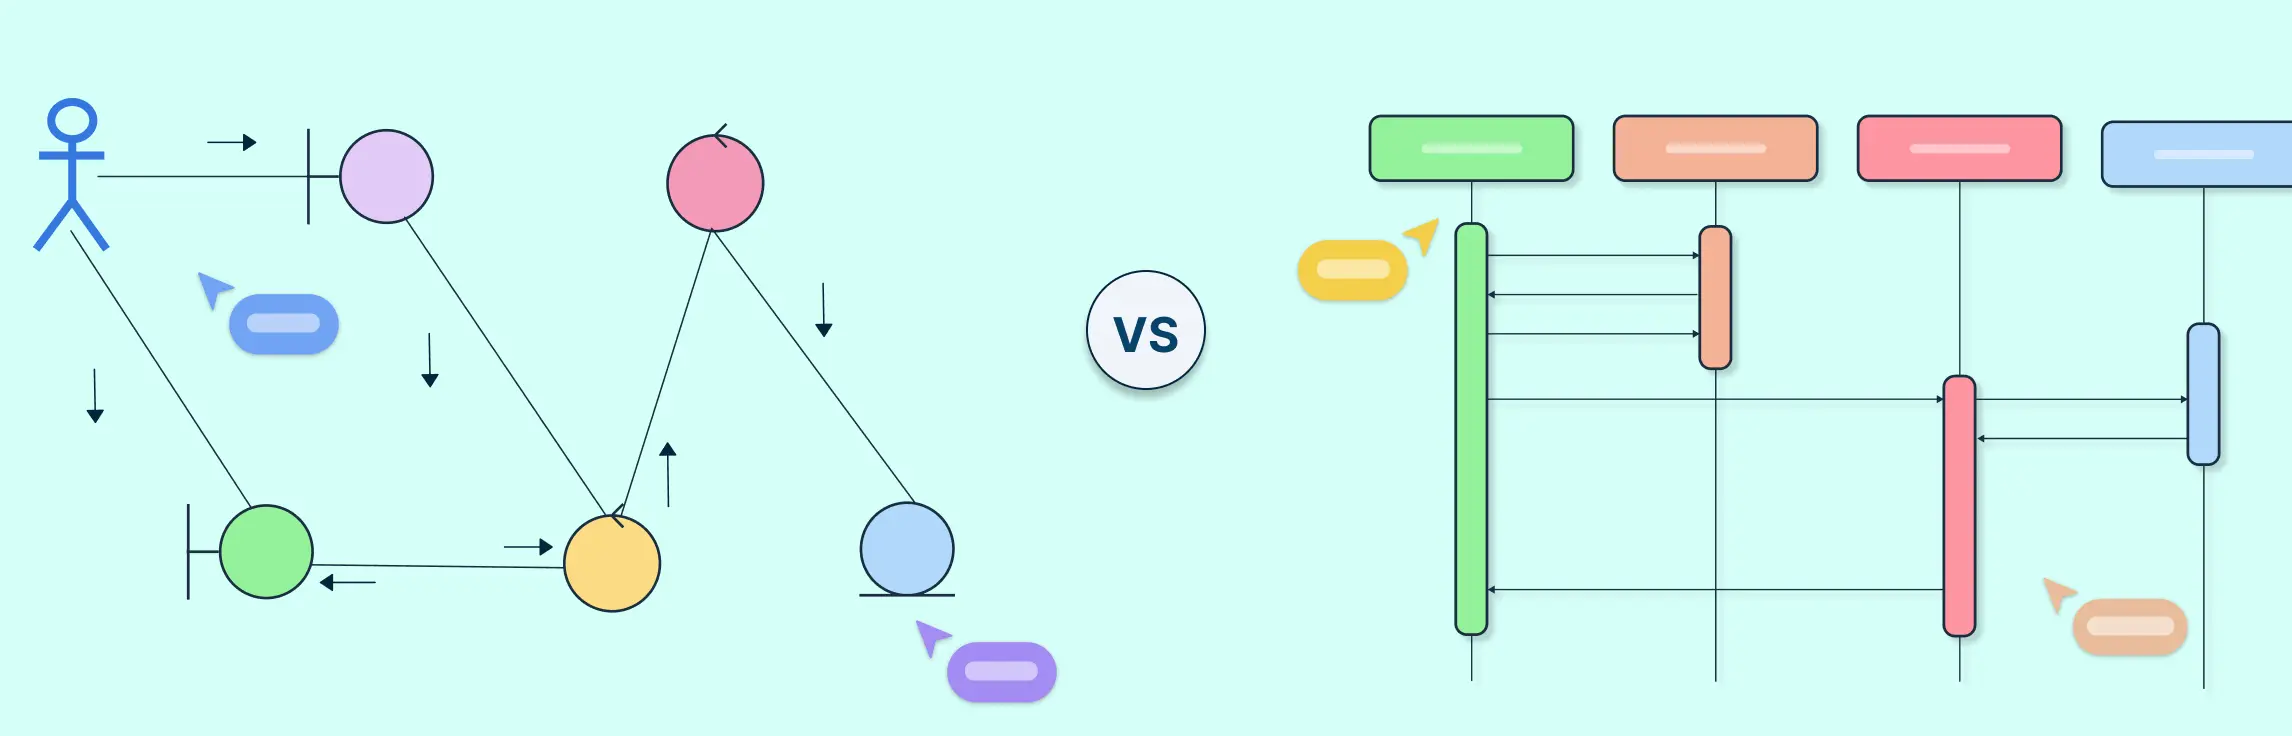
ER Diagram vs Class Diagram: Key Differences
At first glance, ERDs and class diagrams might look similar—boxes, lines, and labels—but they serve very different purposes. ERDs focus on how data is structured inside a database, while class diagrams focus on how objects behave and interact inside software. In short: ERDs are about data; class diagrams are about design and behavior. Here are the key differences between Class and ER diagrams.
| Aspect | ERD (Entity-Relationship Diagram) | UML Class Diagram |
| Purpose & lifecycle stage | Database design, normalization, migration planning | Application design, OO modeling, code architecture |
| Core focus | Entities, attributes, and relationships | Classes, attributes, methods/operations, and object behavior |
| Notation | Attributes only; relationships labeled; cardinality shows “how many” | Attributes + methods; associations labeled; multiplicity shows “how many instances” |
| Level of abstraction | Conceptual or logical view of data | Implementation/system view of objects |
| Who uses it | Database designers, DBAs, data architects | Software developers, architects, system designers |
| Inheritance/Generalization | Rarely shown; not standard | Supported; shows class hierarchies and interfaces |
| Behavior/Methods | Not included | Central; methods show operations classes can perform |
| Strengths | Clear visualization of relationships and participation, good for normalization | Good for modeling object behavior, system structure, and cardinality of associations |
| Weaknesses | Cannot show methods or behavior; limited for software design | Can be more complex; not ideal for database normalization or direct schema planning |
| Example | Customer—Order relationship, with cardinality | Customer class with attributes (name, ID) and methods (placeOrder(), cancelOrder()) |
What Is an ERD (Entity-Relationship Diagram)?
An Entity-Relationship Diagram, or ERD, is a visual way to show how data is organized and connected inside a system. Think of it as a map of your database—it defines what information you’re storing, how it’s grouped, and how different parts relate to each other.
Database designers and DBAs create ERDs to plan and refine data structures before writing a single line of SQL. They’re also helpful for normalizing data, preventing redundancy, and simplifying migrations or database updates later on.
What Is a UML Class Diagram?
A UML class diagram shows the static structure of an object-oriented system. It visualizes how different parts of your software—classes, their properties, and how they interact—fit together. Think of it as a blueprint for your codebase before you start building it.
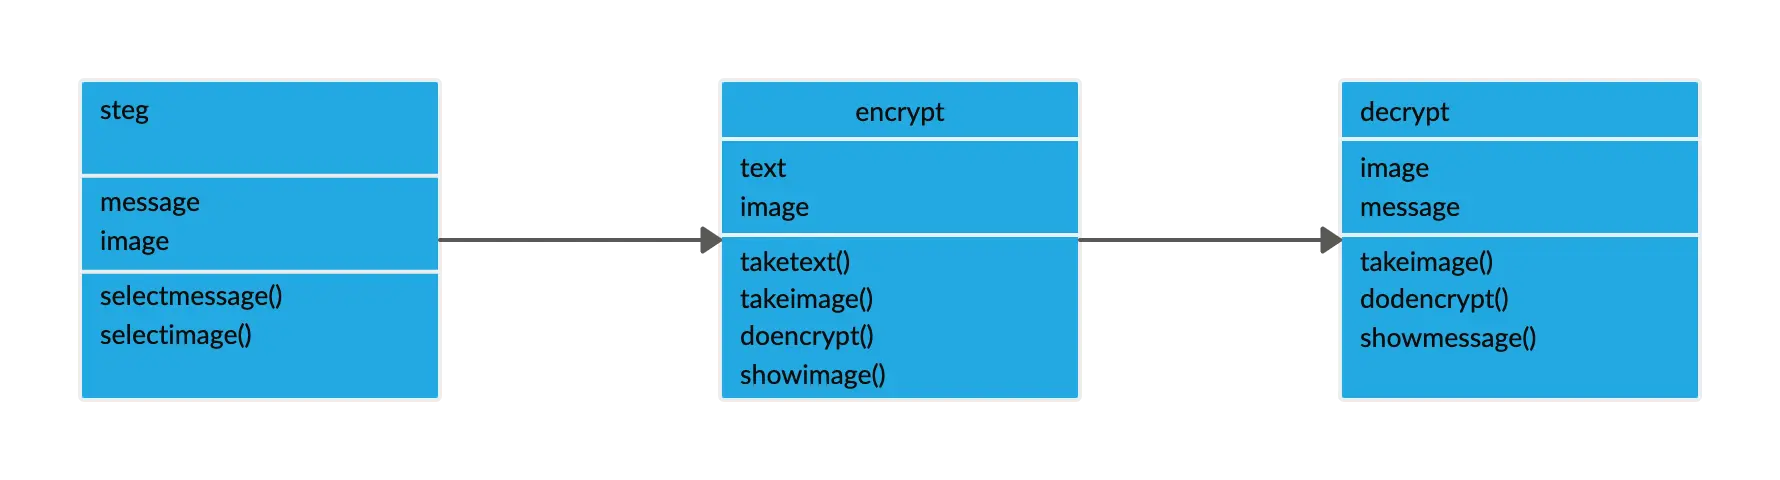
Software architects and developers create class diagrams to plan system structure, design APIs, or prepare for code generation. They’re also handy for documenting large systems or communicating architecture across teams before coding begins.
How to Convert an ERD to a Class Diagram
Converting an ERD to a class diagram isn’t just about drawing boxes. It’s about turning database structures into software objects with behavior. Here’s a step-by-step breakdown:
Step 1: Identify all entities and turn them into classes
Look at each entity in your ERD. These are typically nouns like
Customer,Order, orProduct.Action: Create a class for each entity. Name the class exactly like the entity (capitalize it if you’re following standard coding conventions).
Tip: Keep the name simple and singular (
Customer, notCustomers).
Step 2: Map attributes to class properties
Each attribute in your ERD becomes a property (or field) in the class.
Action: For each entity, list all its attributes as class properties.
Example:
Customerentity hascustomer_id,name,email. In the class diagram, theCustomerclass will have these as attributes.Tip: If your database uses nullable fields, note whether these properties are optional in your class.
Step 3: Convert relationships to associations
Look at how entities are connected in your ERD. Each relationship becomes an association in the class diagram.
One-to-one: Draw a direct association line between classes.
One-to-many: Draw a line with multiplicity
1..*on the “many” side.Many-to-many: Create a new associative class to represent the relationship. This class will often have attributes of its own.
Action: For each relationship, decide whether it becomes an association or an associative class. Add multiplicities.
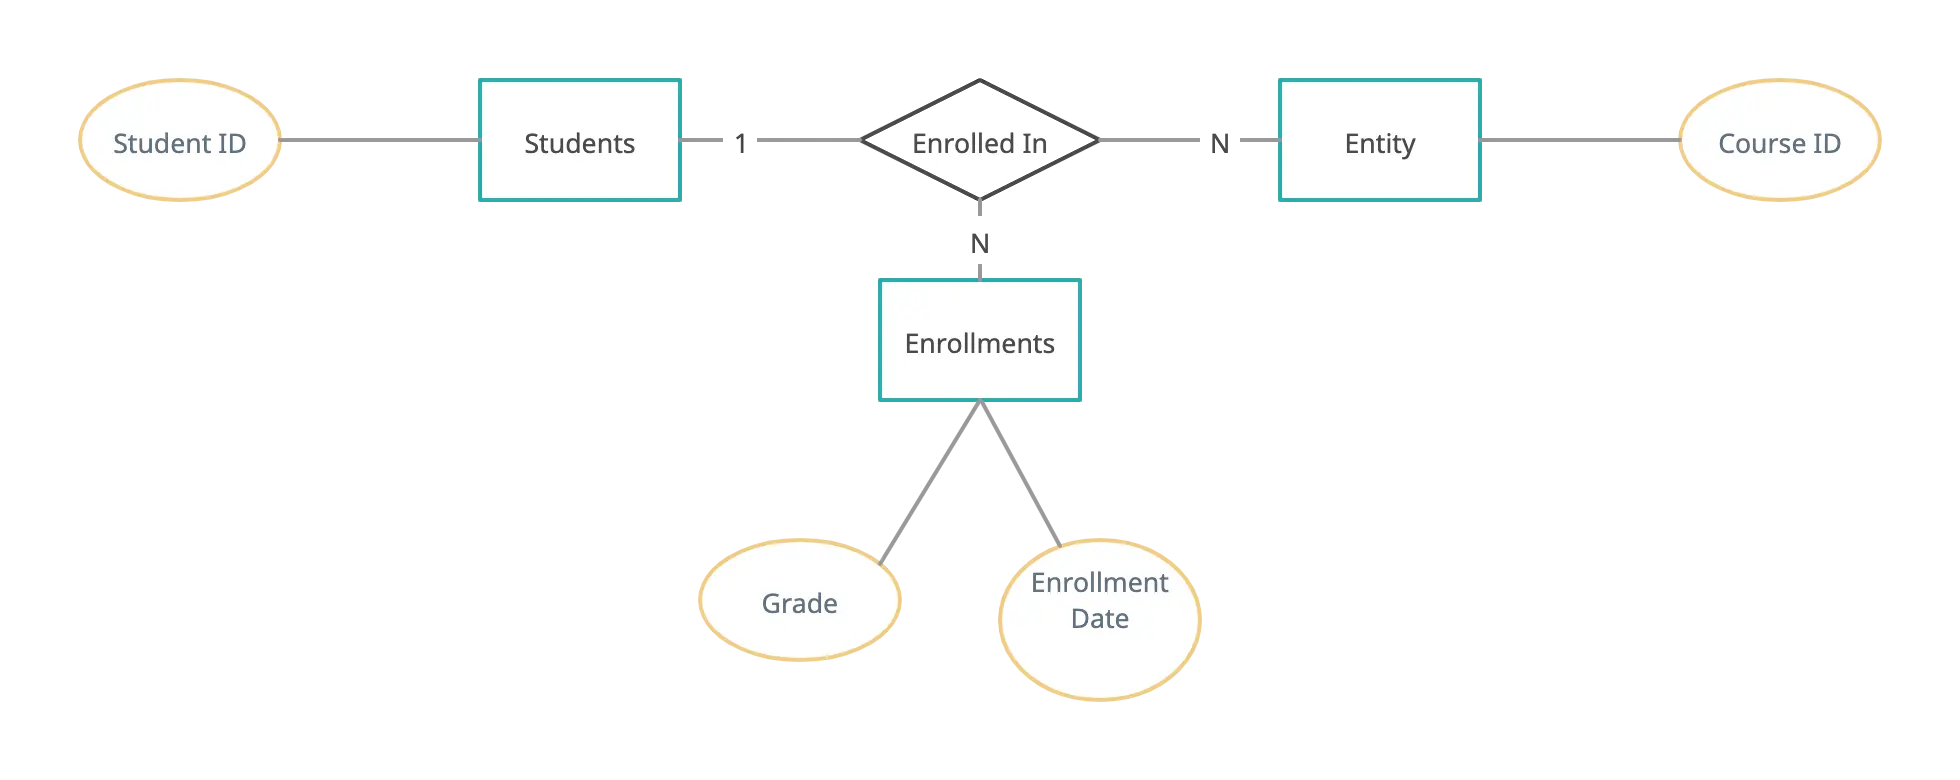
Step 4: Handle composite keys
If an entity uses a composite key (two or more attributes together form a primary key), this often becomes a value object or a combination of properties in the class.
Action: Identify composite keys and decide whether to create a new class/value object or just include them as multiple attributes.
Example: An
Enrollmententity usesStudentID + CourseID→ ClassEnrollmenthas both as attributes.
Step 5: Handle weak entities
Weak entities depend on a parent entity for their identity.
Action: In your class diagram, nest the weak entity as a composed object inside the parent class.
Example:
OrderItemis a weak entity dependent onOrder. In the class diagram, theOrderclass contains a list ofOrderItemobjects.
Step 6: Add multiplicity and cardinality
Multiplicity tells you how many instances of one class relate to another.
Action: Translate the ERD cardinality into class diagram multiplicity notation.
Example: One
Customercan have manyOrders →Customerclass has0..*association toOrder.
Step 7: Add methods and behavior
ERDs don’t include methods, but class diagrams do. Think about what operations each class should perform.
Action: Add relevant methods that represent actions in the system.
Example:
Customerclass →place_order(),cancel_order().Orderclass →calculate_total().
Step 8: Review and refine the design
Check the diagram for consistency. Make sure associations and multiplicities make sense, and that weak entities and composite keys are modeled properly.
Action: Denormalize if needed for performance or coding convenience, but keep relationships clear.
Tip: Ensure methods reflect real behavior and don’t clutter the diagram.
When ERD Is Better (Use Cases)
ERDs shine when your focus is on data first. They’re perfect for understanding, organizing, and optimizing how information is stored. Use an ERD in situations like:
Database-first projects: Planning your schema before you write any code.
Normalization: Reducing data redundancy and ensuring data integrity.
Data migration: Moving or consolidating data between systems.
Reporting / data warehouses: Designing structures for analytics and reporting.
Database governance: Keeping track of relationships, dependencies, and compliance requirements.
When Class Diagram Is Better (Use Cases)
Class diagrams are best when your focus is on how the software works—not just the data it stores. They’re ideal in scenarios like:
Object-oriented (OO) design: Modeling classes, objects, and their interactions before coding.
API design: Planning endpoints and the data each class exposes or consumes.
Domain-driven design (DDD) modeling: Capturing complex business logic and entities in your software.
Code generation: Preparing models that can directly translate into code or ORM classes.
Helpful Resources
Explore the different types of ER diagrams, including conceptual, logical, and physical models. Learn how each type helps visualize database structure and relationships effectively.
Learn about key ER diagram symbols and their meanings, including entities, relationships, attributes, and keys.
Discover the essential class diagram symbols and their meanings, including classes, attributes, operations, and relationships.
Explore ready-to-use class diagram templates to design and visualize object-oriented systems.
Learn how to make a class diagram step by step, from identifying classes and attributes to defining relationships and methods.
Understand class diagram relationships, including associations, aggregations, compositions, and inheritance.
Common Notation Variants & Enterprise Preferences
Not all diagrams look the same—different organizations and tools use slightly different notation styles. Here’s a quick overview:
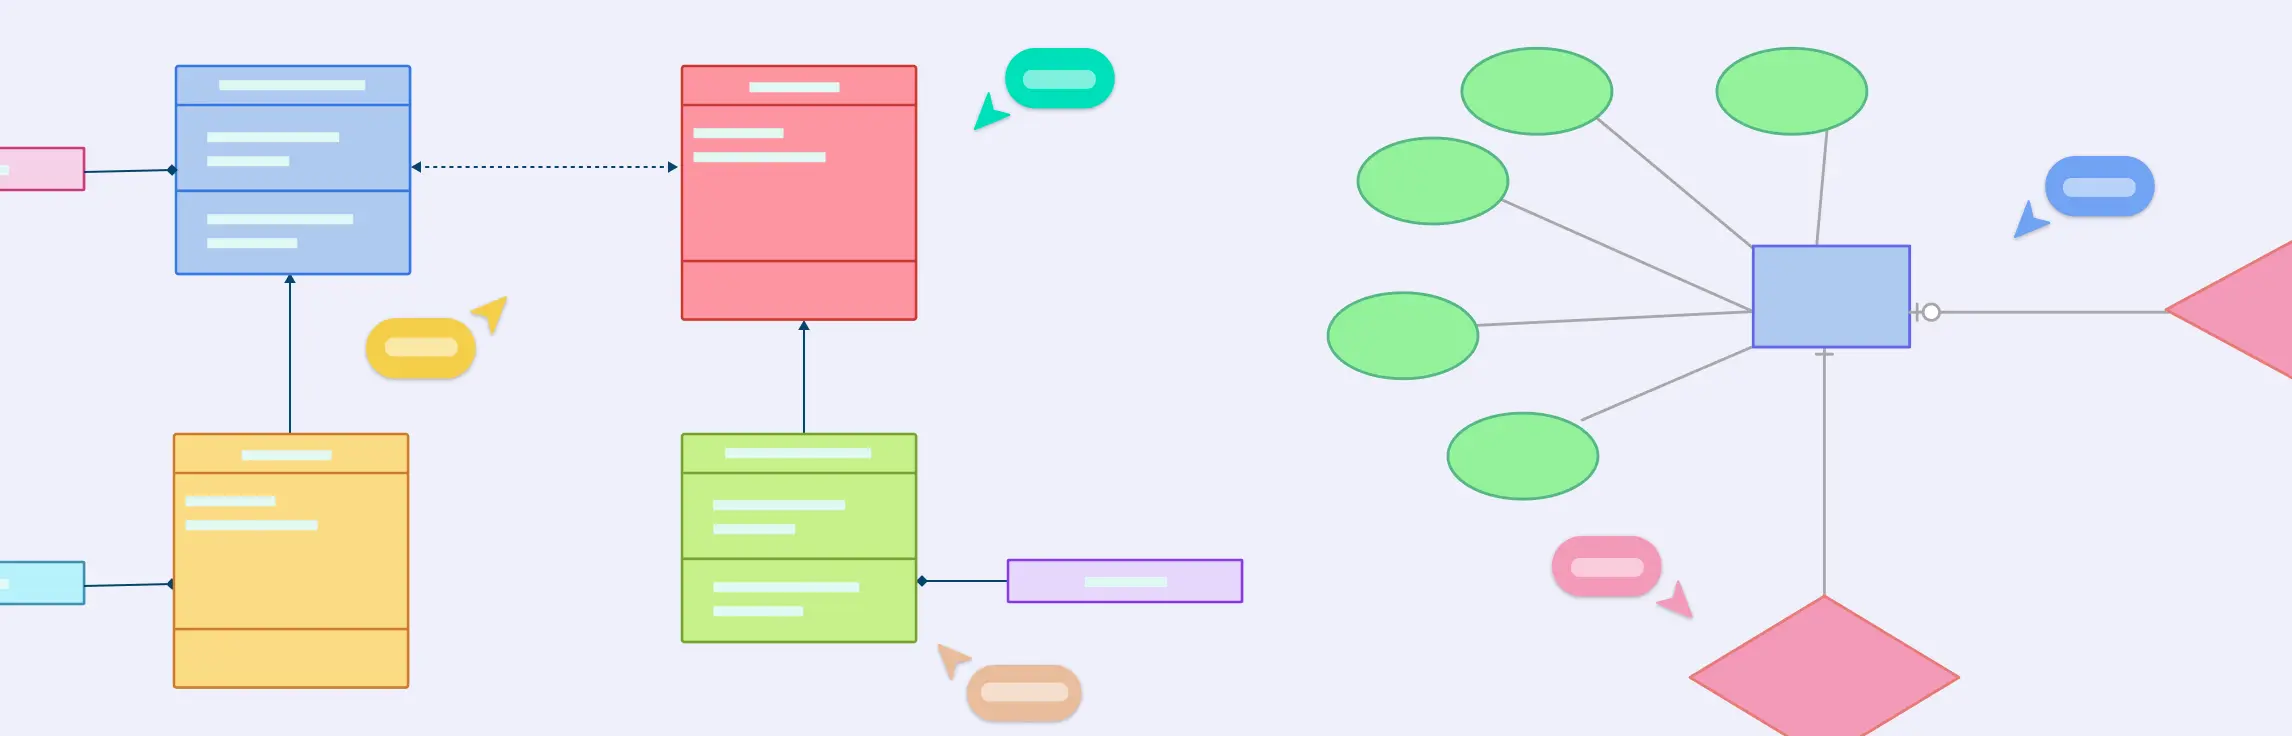
ERD notations
Chen notation: Uses rectangles for entities, diamonds for relationships, and ovals for attributes. It’s classic and easy to read for conceptual models.
Crow’s Foot notation: Uses rectangles for entities and lines with “crow’s feet” to indicate cardinality (one-to-many, many-to-many). Very popular in enterprise database design.
UML-style ERD: Some ERDs adopt UML class diagram symbols for consistency when modeling both data and objects.
Class diagram variants
UML versions: UML has evolved over time (UML 1.x, UML 2.x), but the main class diagram symbols remain consistent: classes, attributes, methods, associations, and multiplicities.
Dialects: Some teams use simplified or customized versions for readability, like showing only attributes or ignoring visibility for small diagrams.
Tooling & enterprise preferences
Support for both diagrams: Tools that let you create ERDs and class diagrams in one environment help maintain consistency.
Creately: Supports both ERD and UML class diagrams with drag-and-drop shapes, real-time collaboration, built-in notation styles (Chen, Crow’s Foot, UML), customizable templates, and easy export options (PNG, SVG, PDF). This makes it easy to share diagrams with teams or include them in documentation.
Best Practices & Checklist
Follow these practical steps to get the most out of ERDs and class diagrams:
Start conceptually with ERD for data-critical systems: Begin with a high-level ERD to map entities, relationships, and rules before diving into software design. This ensures your data structure is solid from the start.
Keep class diagrams aligned with code: Update class diagrams whenever you refactor or add new functionality. This keeps your design documentation accurate and useful for current development.
Collaborative workflow: DBAs and developers should sync through canonical models. Use diagrams as a common language to avoid miscommunication and ensure database and application layers stay in harmony.
Versioning and migration: Keep track of diagram versions and link them to migration scripts or schema changes. This helps maintain a clear history and makes audits or rollbacks easier.
Use templates and notation consistently: Stick to one notation style per project and leverage templates to save time and maintain clarity across your diagrams.
Ready-to-Use Templates for ER Diagrams and Class Diagrams
Here are some pre-made ERD templates for you to get started with.
ATM ERD Diagram


ER Diagram for Online Shopping System

ER Diagram for Medical Records Management

ER Diagram for Tracking, Borrowing, and Returning Activities
And here are some Class diagram templates to get a head start.
ATM Class Diagram

Video Game Class Diagram

Enterprise Cloud Class Diagram

Bank Loan Class Diagram