Ever felt like your brain is a jumbled mess of ideas, all fighting for attention? You’re not alone! Whether you’re planning a project, studying for an exam, or just trying to organize your thoughts, it can sometimes feel like you’re trying to untangle a giant knot of Christmas lights. That’s where cluster diagrams come to the rescue!
Think of a cluster diagram as a visual map of your thoughts. It’s like spreading out all those tangled ideas on a table and grouping similar ones together. Instead of a confusing mess, you end up with neat little clusters of related information, all connected to a central theme.
What is a Cluster Diagram?
A cluster diagram is a non-linear graphic organizer that visually represents clusters—groups of related information, objects, or ideas—around a central theme or concept. Unlike linear diagrams that follow a strict sequence, cluster diagrams branch out from a central idea, creating a web of related elements. This structure allows for a more flexible and holistic approach to organizing information, making it easier to explore and understand the relationships between various ideas or components.
Cluster diagrams are particularly useful in brainstorming sessions, where ideas flow in multiple directions and need to be categorized quickly. By organizing elements based on common factors, these diagrams help to identify patterns, connections, and hierarchies within complex information. This visual clarity not only aids in comprehension but also enhances problem-solving and decision-making processes, as it allows users to see the bigger picture while still focusing on specific details.
In essence, a cluster diagram maps out a core concept and its connected subcategories, providing a clear, structured view of complex information. It is widely used in various fields, including education, business, and research, to organize thoughts, develop ideas, and facilitate discussions. Whether you’re outlining a project plan, analyzing data, or exploring new concepts, a cluster diagram can be a powerful tool to structure your thoughts and make sense of intricate relationships.


Cluster Diagrams Vs Mind Maps
While cluster diagrams are versatile and widely used, they are often compared to other diagram types such as mind maps and network diagrams. A mind map, similar to a cluster diagram, starts with a central idea but tends to branch out in a structured, hierarchical manner. ideas in a non-linear, associative format. Mind maps and cluster diagrams are both visual tools for organizing information, but they differ in structure and purpose. Mind maps have a radial, hierarchical structure starting from a central topic, ideal for structured note-taking and brainstorming. Cluster diagrams, on the other hand, have a more flexible layout with interconnected groups of ideas, better suited for exploring complex relationships and identifying patterns. While mind maps follow a tree-like organization from general to specific, cluster diagrams allow for more diverse arrangements of related concepts. Mind maps primarily show hierarchical connections, whereas cluster diagrams can illustrate more intricate relationships between ideas.Check out our intuitive mind map maker to get started creating mind maps
Cluster Diagram vs Concept Maps
Cluster diagrams and concept maps are both effective tools for organizing and visualizing information, but they differ in structure and focus. A cluster diagram centers around a single main idea, with related subcategories branching out to form groups of connected information. This method emphasizes grouping similar ideas together, making it easier to see relationships within each cluster but not necessarily detailing how different clusters interact. In contrast, a concept map is more interconnected, with multiple ideas linked through labeled relationships, showing not just groupings but also the connections between various concepts. While cluster diagrams are ideal for brainstorming and categorizing ideas quickly, concept maps provide a more detailed exploration of how different ideas or concepts interrelate, making them useful for understanding complex systems or processes.
To explore more on cluster diagrams check out our Cluster Diagram Templates.
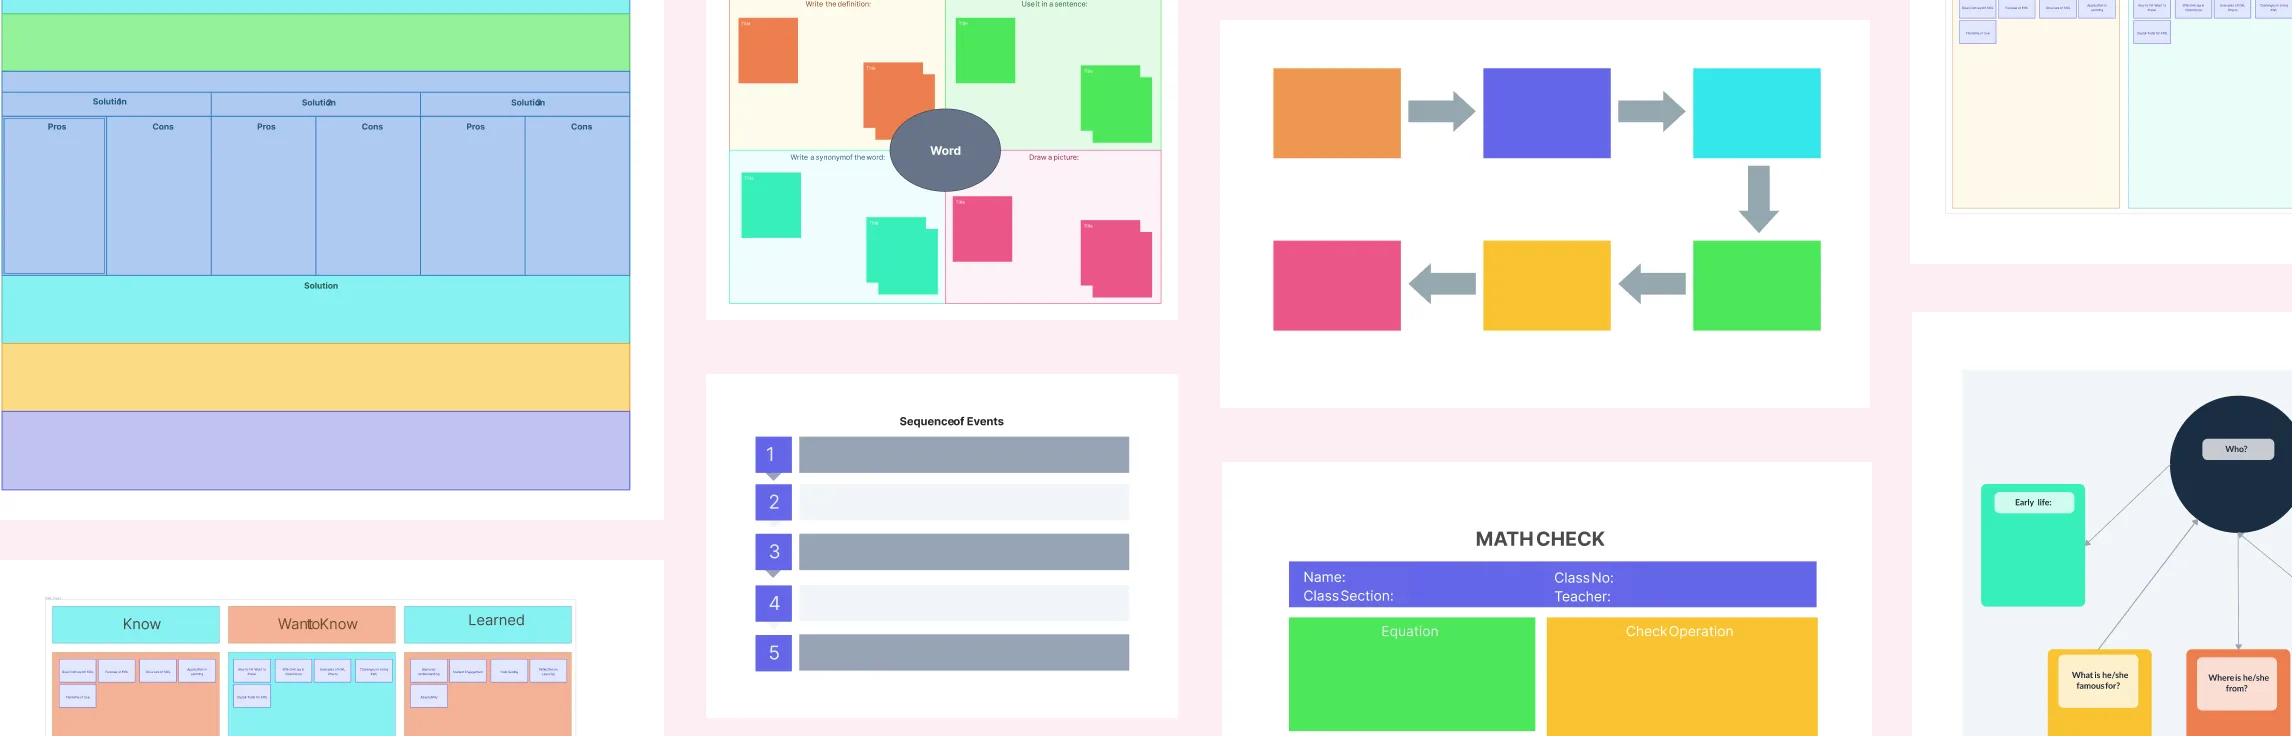
Types of Cluster Diagrams
Cluster diagrams come in various forms, each serving a unique purpose depending on the nature of the information being organized. Two common types are the General Cluster Diagram and the Two-Cluster Diagram.
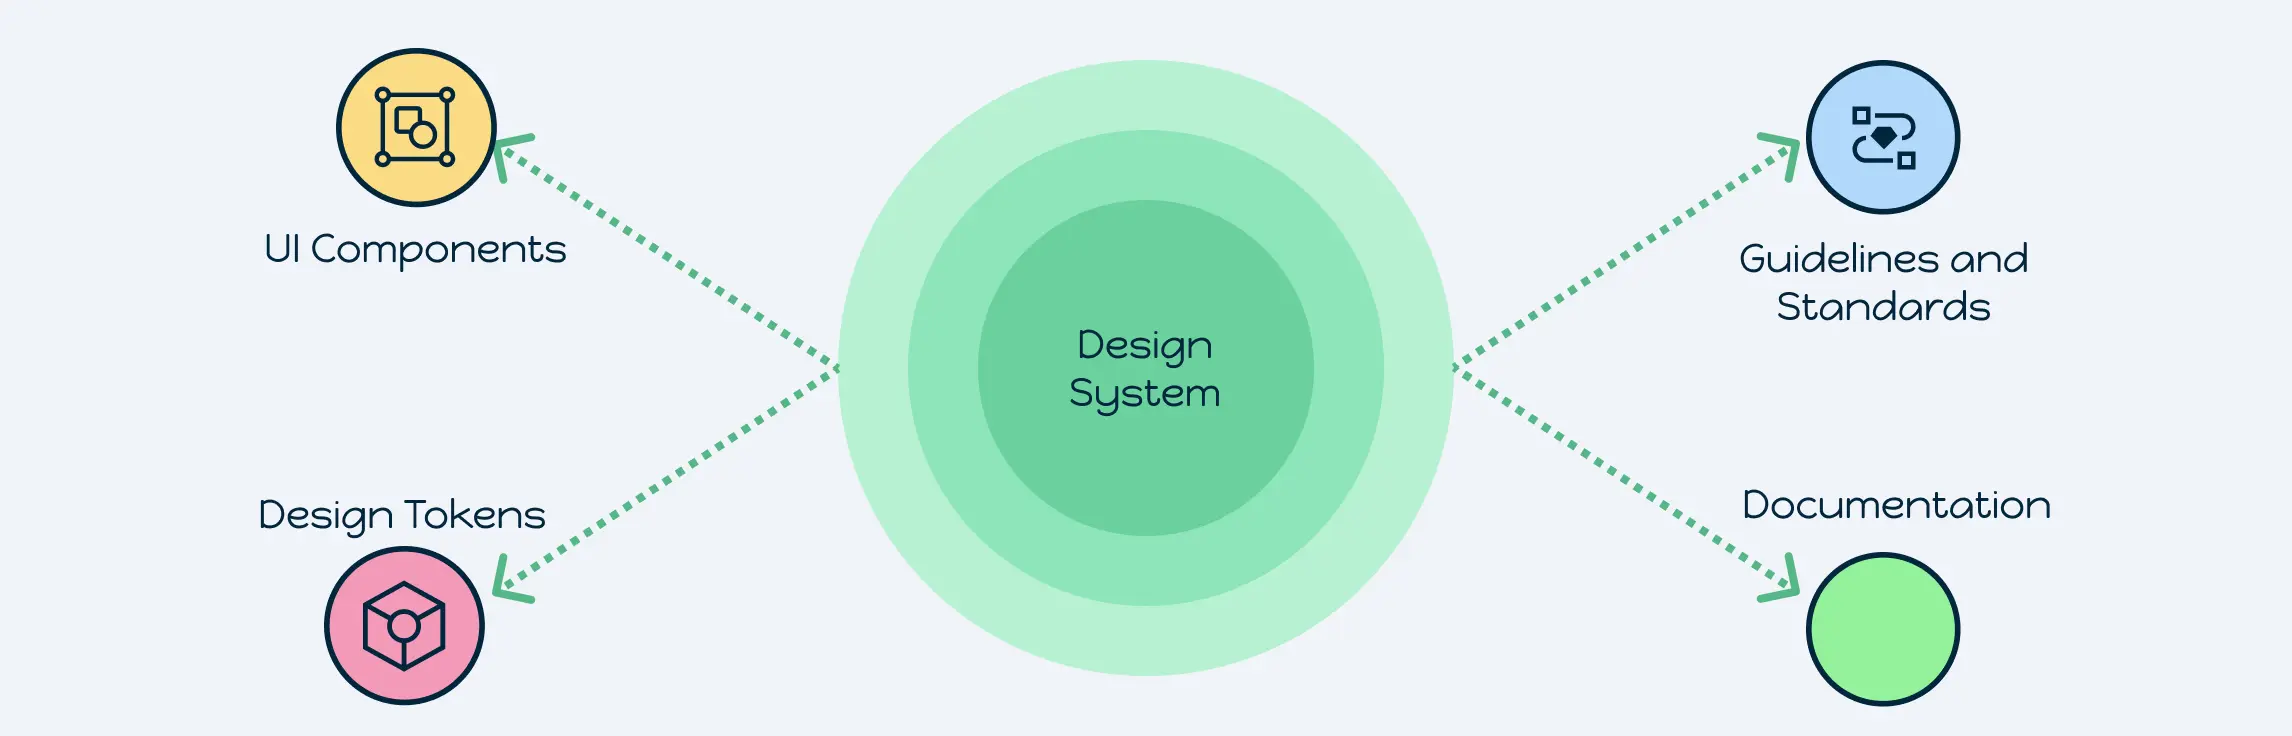
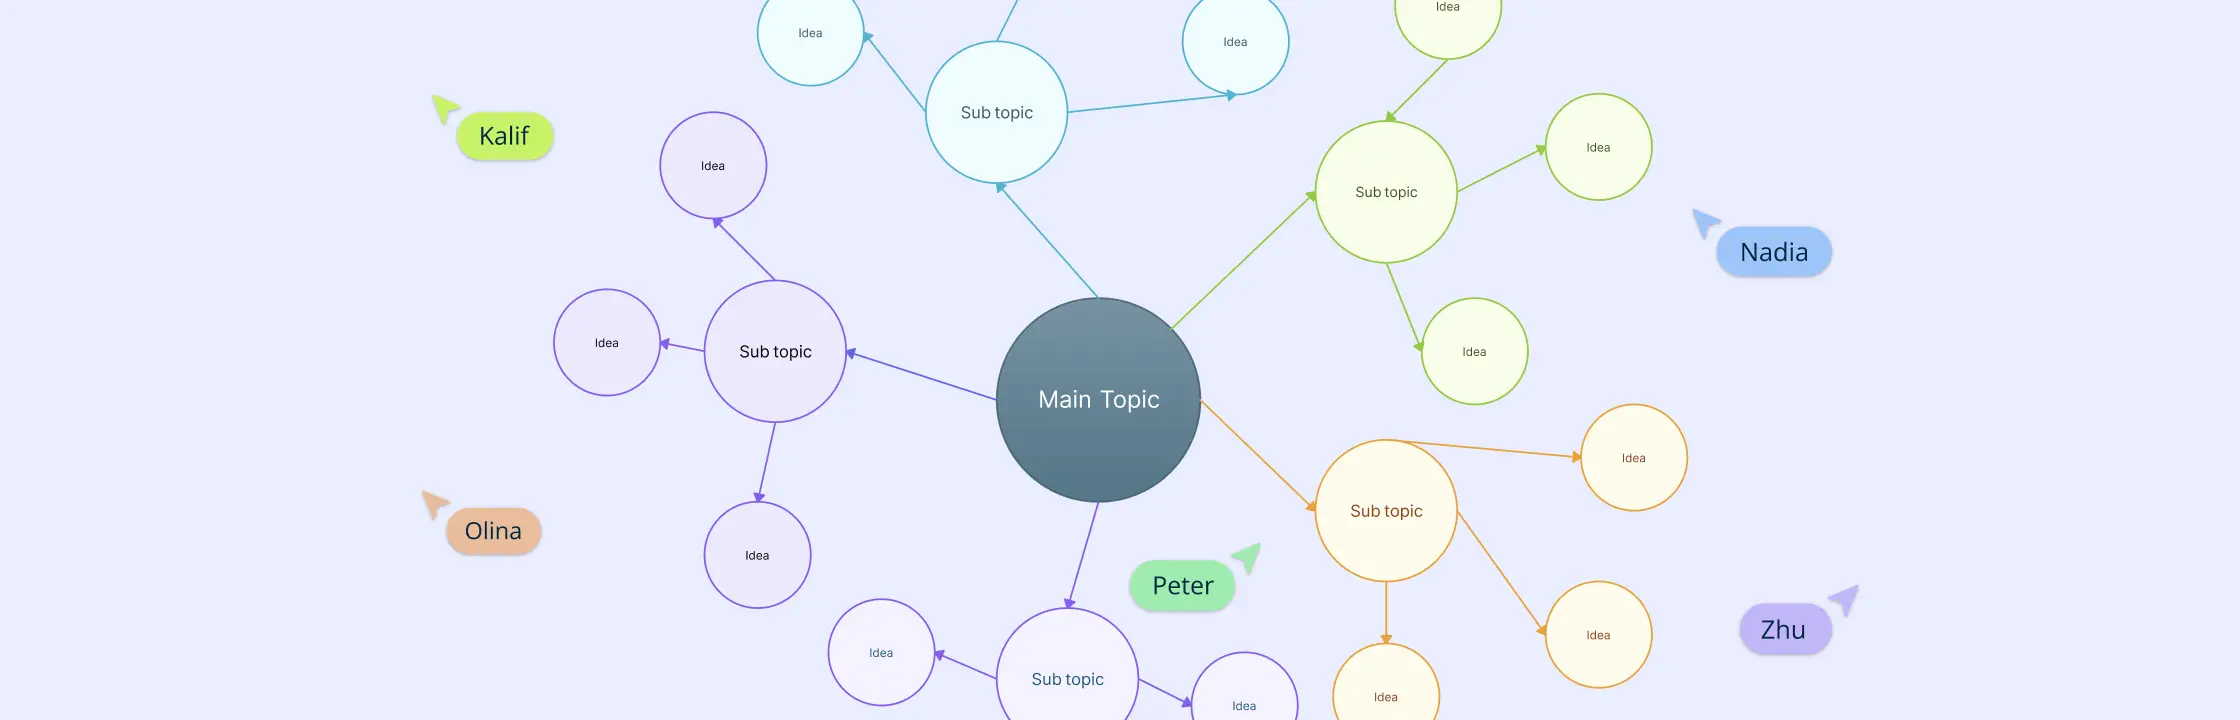
General Cluster Diagram
A General Cluster Diagram is the most commonly used form, where a central idea or theme is placed at the center of the diagram, and related subcategories branch out from it. Each branch represents a different cluster of related ideas, facts, or concepts, with further sub-branches extending as needed. This type of diagram is versatile and can be used in a wide range of applications, such as brainstorming sessions, project planning, or educational contexts. The primary goal is to visually organize information into distinct groups, making it easier to understand and explore relationships within the same cluster.

Two-Cluster Diagram
A Two-Cluster Diagram is a more specialized form of cluster diagram, used to compare and contrast two central ideas or themes. In this structure, two main nodes are placed on either side of the diagram, and related clusters of information branch out from each node. This format is particularly useful for comparative analysis, allowing you to visually explore the similarities and differences between two concepts or groups. It can be effectively used in decision-making processes, where comparing options or ideas side by side is crucial. The Two-Cluster Diagram helps in clearly delineating the characteristics or elements of each cluster, making it easier to draw comparisons and identify key distinctions.

Uses of Cluster Diagram
Project Management Applications
Cluster diagrams are indispensable tools in project management. They help visualize project timelines, resource allocations, and task dependencies organically. By structuring complex projects into manageable clusters, teams can better prioritize tasks and anticipate potential bottlenecks.
Technical and Network Documentation
In the realm of IT and network administration, cluster diagrams serve as excellent visual aids for network documentation. They map out network topologies, system architectures, and infrastructure components, facilitating easier management and troubleshooting of IT systems. Precision control tools and templates make Creately an ideal platform for creating these technical diagrams.
Educational Uses
Educational professionals can greatly benefit from cluster diagrams for lesson planning and instructional designs. These diagrams help in organizing curriculum content, brainstorming teaching strategies, and mapping out educational objectives, greatly enhancing classroom efficiency and student understanding.
Business Strategy and Marketing
Cluster diagrams also hold significant value in business strategy and marketing. They can be used to visualize market segments, plot strategic initiatives, and track competitor activities, culminating in more robust and effective marketing plans. Creately’s comprehensive templates and data integration capabilities make it easier to detail multi-level business strategies and streamline marketing efforts.
Writing
In writing, cluster diagrams are used to organize ideas, plot narratives, and develop complex arguments. They help writers visually structure their thoughts, making it easier to outline and develop coherent and engaging content.

Insurance
In the insurance industry, cluster diagrams aid in mapping out policy options, coverage details, and risk factors. They facilitate the organization of complex insurance products and processes, improving clarity and decision-making.
City Planning
City planners use cluster diagrams to visualize urban development, zoning regulations, and infrastructure projects. By organizing these elements into clusters, planners can better assess and design city layouts, ensuring efficient use of space and resources.
Topic Study
For academic and research purposes, cluster diagrams help in studying and organizing complex topics. They allow researchers and students to break down and connect various aspects of a subject, aiding in deeper understanding and comprehensive analysis.
Benefits of Using a Cluster Diagram
Improved Planning and Visualization
Cluster diagrams significantly enhance organizational planning by visually representing the relationships and hierarchies between different pieces of information. Unlike linear charts or lists, cluster diagrams offer a non-linear format that encourages the natural flow of ideas. By organizing data around central themes and creating connections between related subcategories, these diagrams make complex information easier to digest and interpret.
Enhanced Collaboration
One of the major benefits of using cluster diagrams is the facilitation of effective team collaboration. When multiple team members are working on a project, visual tools like these make it easier to communicate ideas and coordinate efforts. By allowing everyone to visualize the project’s structure and flow, cluster diagrams can help ensure that all team members are on the same page, reducing misunderstandings and increasing productivity.
Simplifies Complex Brainstorming Sessions: Cluster diagrams provide a clear and organized framework for brainstorming, helping teams generate and categorize ideas more efficiently.
Details Multi-Level Ideas: These diagrams make it easier to break down complex concepts into manageable subcategories, displaying multiple levels of detail in an intuitive format.
Improves Idea Recall: Visual elements in cluster diagrams can aid memory retention, making it simpler to recall important information during discussions or presentations.
By adopting tools like Creately, which supports collaborative planning and detailed visualization through comprehensive templates, teams can immensely benefit from using cluster diagrams. This not only simplifies the brainstorming process but also ensures a structured and coherent approach to project planning and execution.
Steps to Draw an Effective Cluster Diagram

Step 1: Start With a Theme
Initiating a cluster diagram begins with selecting a central theme or idea that will act as the core around which all other elements will revolve. This central idea guides the direction of the entire diagram and ensures coherence throughout. Think of it as the nucleus of your brainstorming process, anchoring every subcategory and detail.
Step 2: Create Subcategories
Next, generate subcategories branching out from the central theme. These subcategories are crucial for organizing your thoughts and structuring your diagram logically. For instance, if your central theme is ‘Project Management,’ subcategories might include ‘Resource Allocation,’ ‘Timeline Planning,’ and ‘Risk Management.’
Step 3: Fill Out the Branches
Develop the subcategories further by adding detailed ideas and information beneath each branch. This step involves populating the diagram with relevant data points, examples, or actionable steps. The goal is to cover every necessary aspect of each subcategory to ensure all critical points are addressed.
Step 4: Customize the Diagram
The final touch involves customizing your cluster diagram to make it visually engaging and easy to understand. Use color-coding to differentiate between branches, add labels for clarity, and incorporate visuals where needed. This not only enhances visual appeal but also improves the readability and memorability of the information.
For more detailed steps and practical templates, consider using tools like Creately. Creately offers cluster diagram templates that can help you create impactful diagrams with minimal effort. The collaborative planning and visualization tools provided by Creately ensure that your diagrams are not only comprehensive but also tailored to your specific needs.
Tips for Optimizing Your Cluster Diagram
Use of Color-Coding
Color-coding is an essential tip for optimizing your cluster diagram. By assigning different colors to branches and subcategories, you can enhance visual clarity and easily distinguish different levels and ideas. For instance, using a unique color for each main subcategory makes it instantly recognizable.
Maintaining Logical Hierarchy
Ensuring a logical hierarchy in your cluster diagram is crucial for readability. Start with a clear central theme and branch out systematically. Each branch should logically connect to the central theme and subsequent branches. This method mirrors the structured approach used in network or mind maps, making complex information easier to digest. Regularly reviewing the diagram to maintain this logical flow prevents confusion and enhances comprehension.
Regularly review your diagram to maintain logical flow.
Ensure branches are systematically connected.
Regular Reviews and Updates
Cluster diagrams are not static; they need regular updates to stay relevant and accurate. Periodically revisiting and modifying the diagram ensures that it reflects the latest information and ideas. This is particularly important in dynamic environments like project management or business strategy development, where situations and understandings evolve.
Incorporating Team Feedback
Soliciting feedback from team members can lead to a more comprehensive and effective cluster diagram. Encourage your team to provide input and suggest improvements. Collaborate using tools like Creately, which support real-time updates and annotations. This will not only refine the diagram but also foster a collaborative spirit, leveraging collective expertise for better results.
How Creately Helps in Creating Cluster Diagrams
Creately offers a suite of tools that make cluster diagram creation both intuitive and effective. With drag-and-drop functionality, users can easily add nodes, branches, and sub-branches to their diagrams. The platform provides a variety of shapes, icons, and fonts to choose from, allowing for a high degree of customization. This flexibility ensures that every diagram can be tailored to meet the specific needs of a project or team, making complex concepts easier to digest and share.
Comprehensive Templates
A standout feature of Creately is its extensive library of templates. Whether you are working on project management, educational lesson plans, or technical documentation, Creately has a template to get you started quickly. These templates are designed by experts and can be further customized to fit individual requirements. By utilizing these ready-made frameworks, users can save time and focus on the content of their diagrams rather than the layout.
Collaborative Planning Tools
One of Creately’s most compelling features is its collaborative planning tools. The platform supports real-time collaboration, allowing team members to work on the same diagram simultaneously. Features like in-app video conferencing and real-time cursors enable seamless communication, making it easy to brainstorm and iterate on ideas. Team members can also add comments and track changes, ensuring that everyone is aligned and informed throughout the project lifecycle.
Integration with Other Software
Creately seamlessly integrates with a wide range of other software and platforms, enhancing its utility in professional settings. Whether you need to incorporate data from a spreadsheet or export your diagram into a presentation, Creately supports multiple formats and integrations. This interoperability ensures that your cluster diagrams can be shared and utilized across various stages of project planning and execution, making it a versatile tool in any workflow.