So you want to learn Entity Relationship diagrams? This ER diagram tutorial will cover what is an ER diagram, its usage, history, components of ER diagram, and how to use Creately to draw them. We’ve also added some templates for you to get started quickly.
ER Diagram Definition
An Entity Relationship Diagram (ERD) is a visual representation of different entities within a system and how they relate to each other. It is a tool used to design and model relational databases, and shows the logical structure of the database. ER diagrams use ERD symbols to represent entities, attributes, and relationships, which help to illustrate the relationships between the entities in the database. It consists of entities (which represent objects or concepts, like “Customer” or “Product”) and relationships (which represent how these entities are connected or interact with each other, like “owns” or “buys”). In modern organizations, redesigning systems is common, with 92% of companies reporting organizational redesign as important and 80%+ actively restructuring or recently restructured (Deloitte, 2016).
Entities are depicted as rectangles, and relationships are shown as diamonds. Lines connecting entities and relationships represent the connections between them, often indicating the type of relationship (such as one-to-one, one-to-many, or many-to-many).
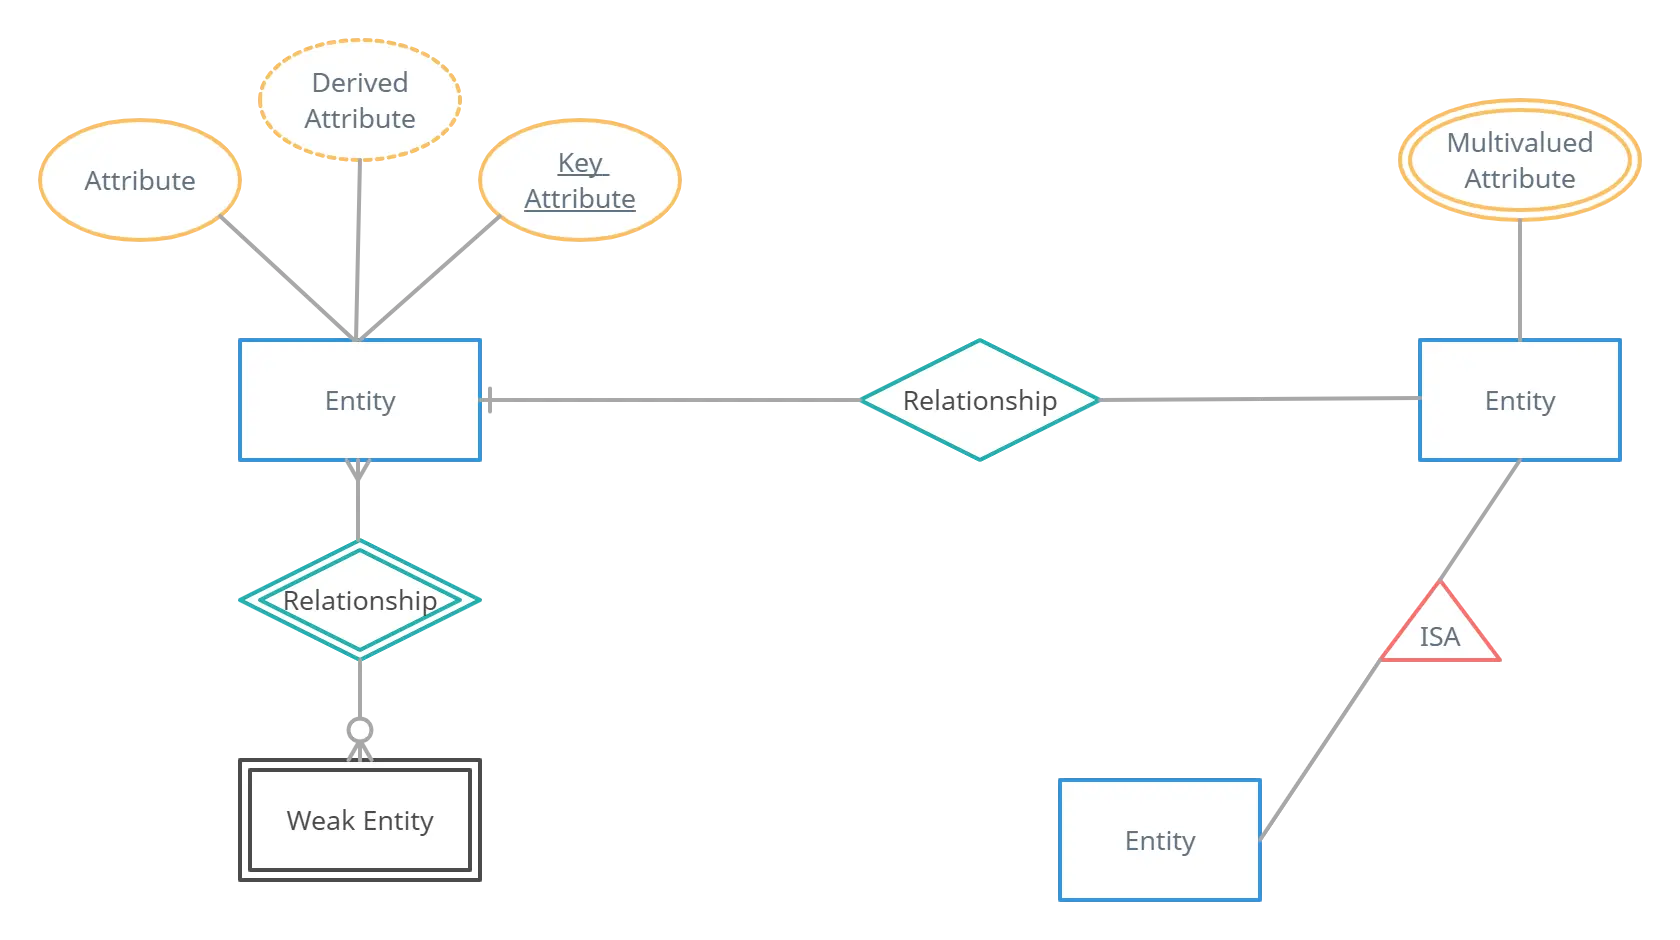
Entity Relationship Diagram (ERD) Symbols and Notations
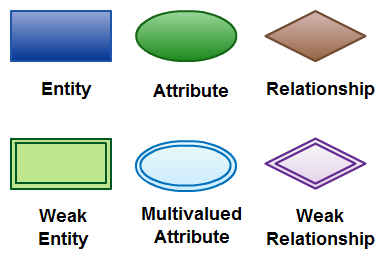
There are three basic elements in an ER Diagram: entity, attribute, relationship as follows.
1. Entity
An entity can be a person, place, event, or object that is relevant to a given system. For example, a school system may include students, teachers, major courses, subjects, fees, and other items. Entities are represented in ER diagrams by a rectangle and named using singular nouns.
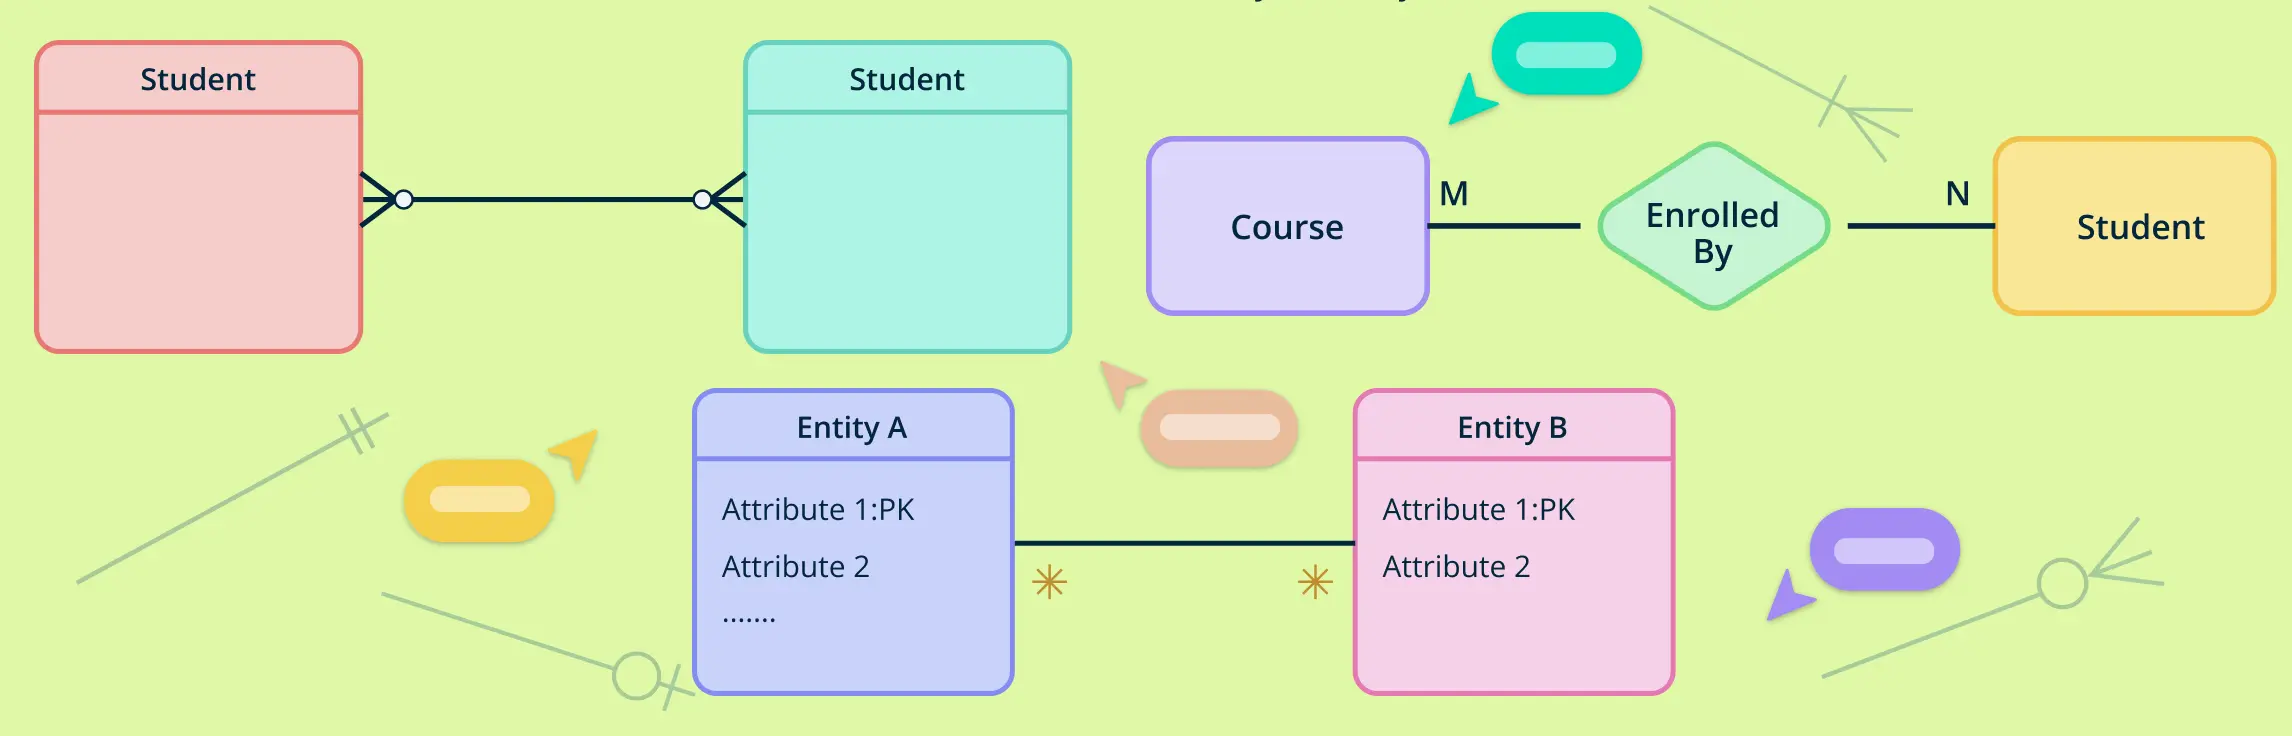
Weak Entity
A weak entity is an entity that depends on the existence of another entity. In more technical terms it can be defined as an entity that cannot be identified by its own attributes. It uses a foreign key in ER diagrams combined with its attributed to form the primary key. An entity like order item is a good example for this. The order item will be meaningless without an order so it depends on the existence of the order.

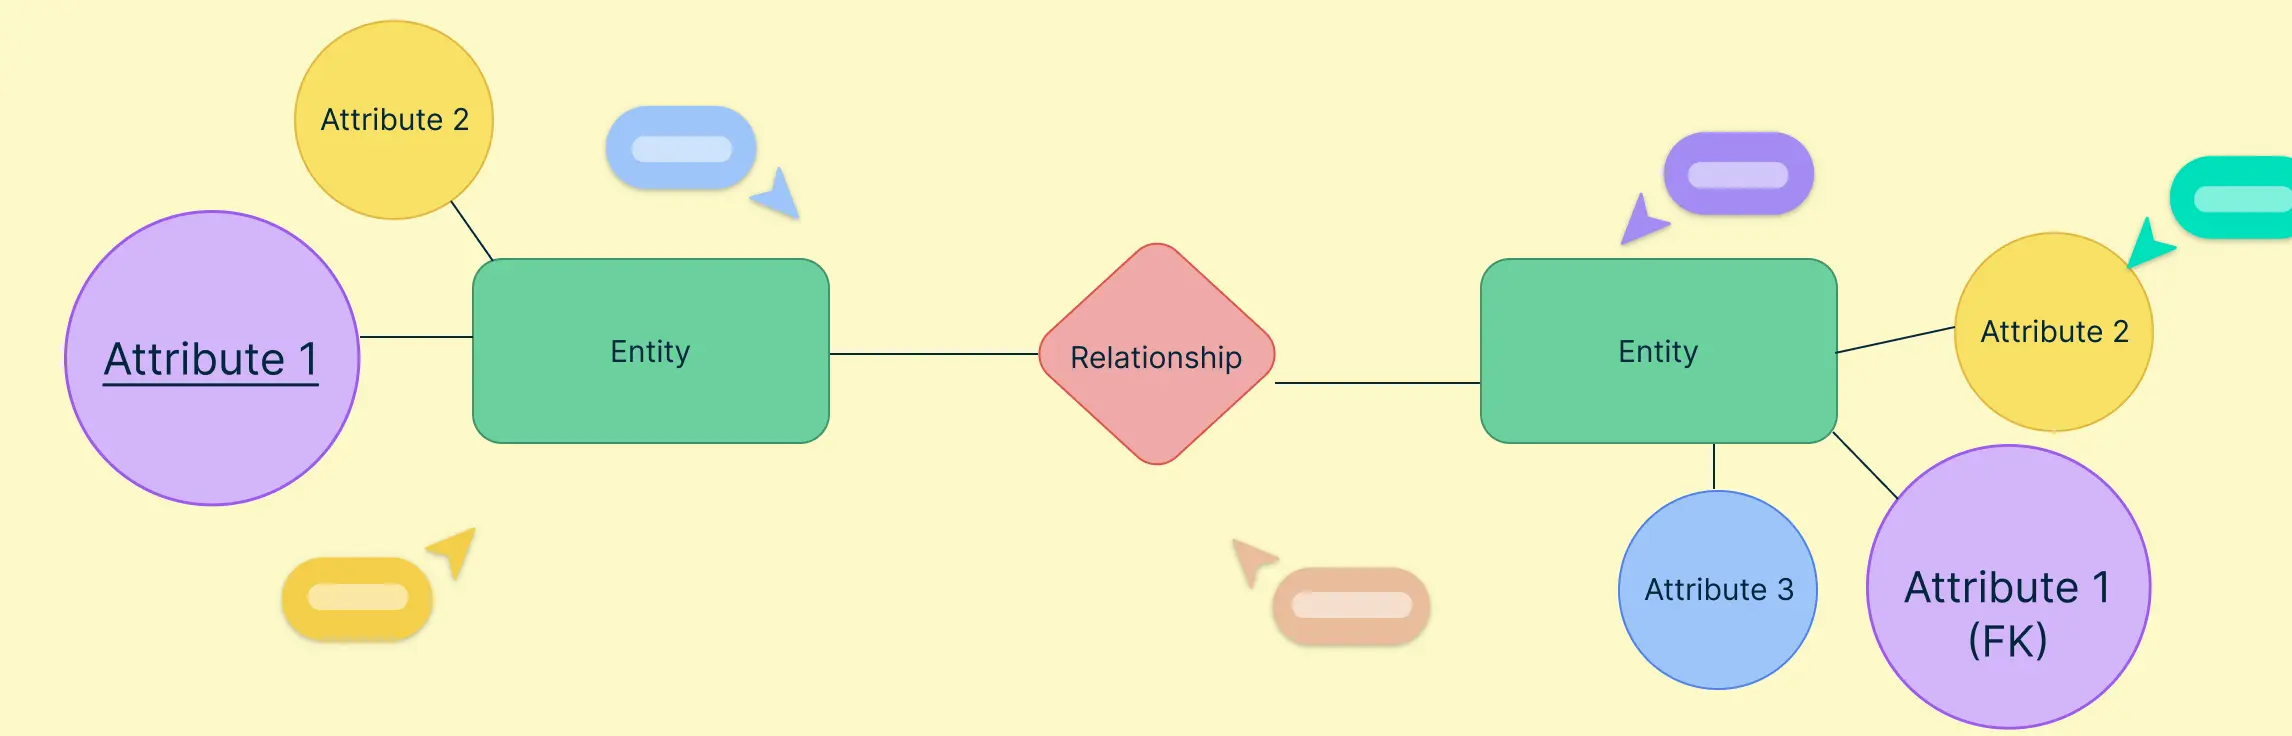
2. Attribute
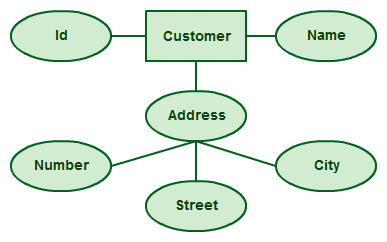
An attribute is a property, trait, or characteristic of an entity, relationship, or another attribute. For example, the attribute Inventory Item Name is an attribute of the entity Inventory Item. An entity can have as many attributes as necessary. Meanwhile, attributes can also have their own specific attributes. For example, the attribute “customer address” can have the attributes number, street, city, and state. These are called composite attributes. Note that some top level ER diagrams do not show attributes for the sake of simplicity. In those that do, however, attributes are represented by oval shapes.
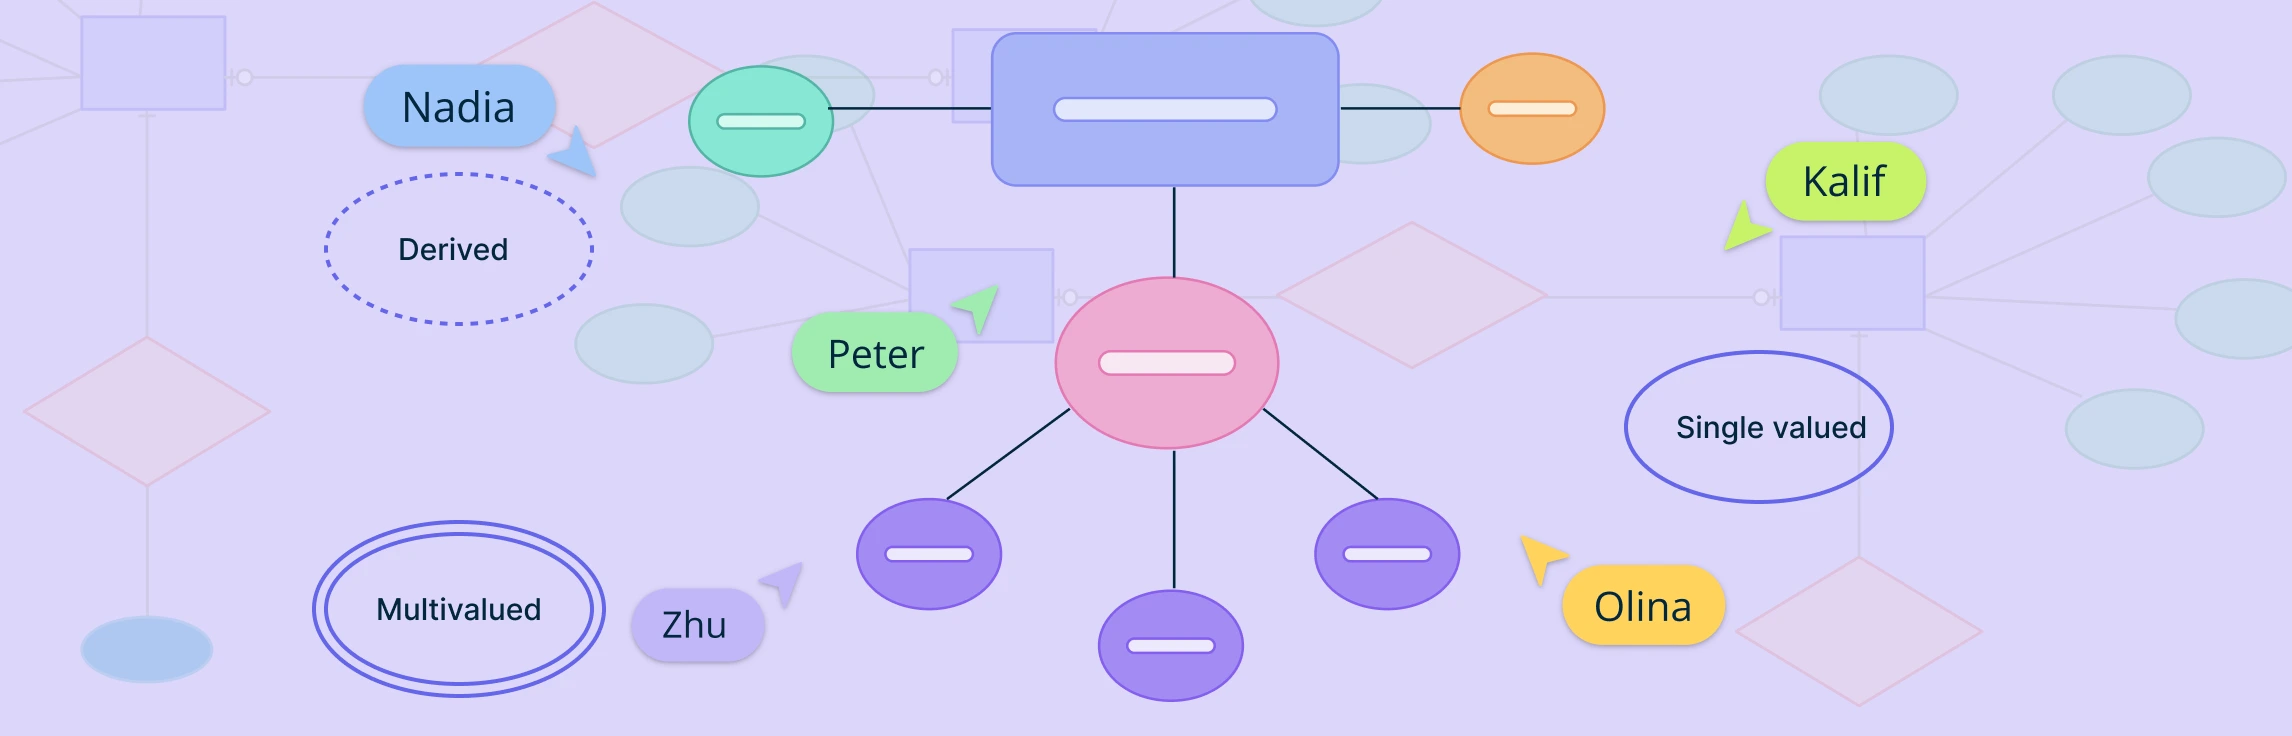
Multivalued Attribute
If an attribute can have more than one value it is called a multi valued attribute. It is important to note that this is different from an attribute having its own attributes. For example, a teacher entity can have multiple subject values.

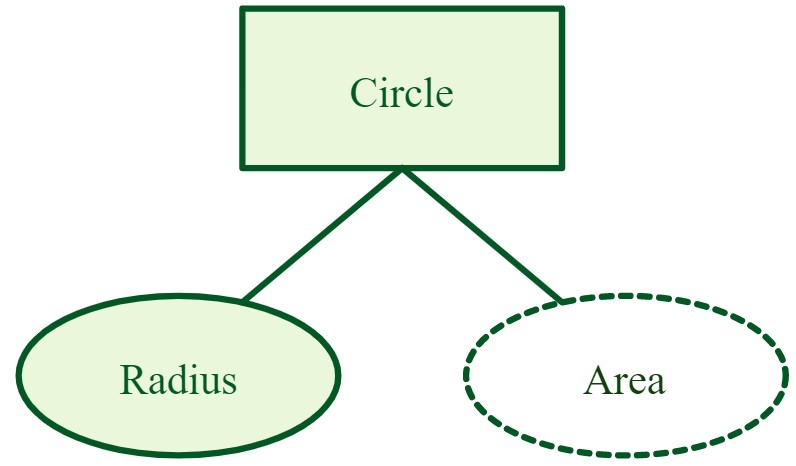
Derived Attribute
An attribute based on another attribute. This is found rarely in ER diagrams. For example, for a circle, the area can be derived from the radius.
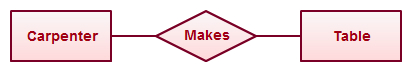
3. Relationship
A relationship describes how entities interact. For example, the entity “Carpenter” may be related to the entity “table” by the relationship “builds” or “makes”. Relationships are represented by diamond shapes and are labeled using verbs.
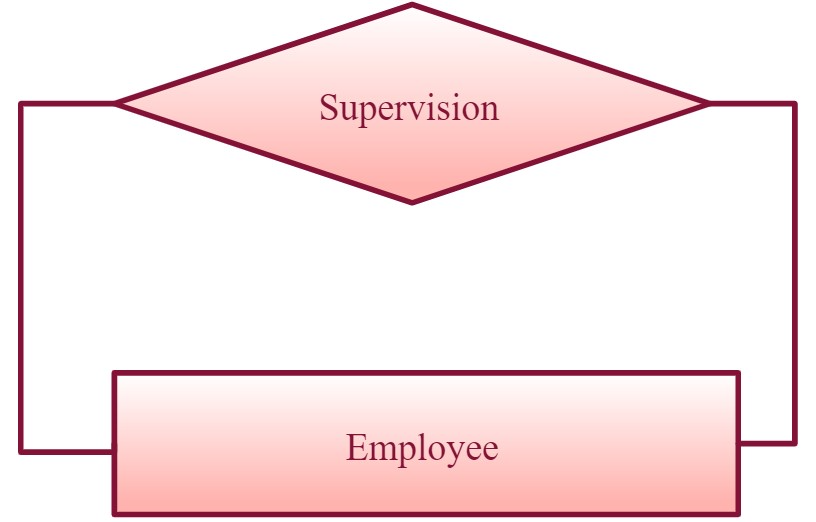
Recursive Relationship
If the same entity participates more than once in a relationship it is known as a recursive relationship. In the below example an employee can be a supervisor and be supervised, so there is a recursive relationship.
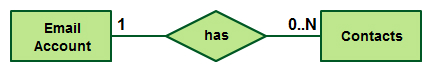
Cardinality and Ordinality
These two further defines relationships between entities by placing the relationship in the context of numbers. In an email system, for example, one account can have multiple contacts. The relationship, in this case, follows a “one to many” model. There are a number of notations used to present cardinality in ER diagrams. Chen, UML, Crow’s foot, Bachman are some of the popular notations. Creately supports Chen, UML and Crow’s foot notations.The following example uses UML to show cardinality.
Features and Components of ER Diagrams
To learn what an ER diagram is, you need to understand its components.
Entities
An entity represents a real-world object, concept, or thing about which data is stored in the database. It could be a person, place, thing, event, or concept.
Characteristics
- Attributes: Entities have attributes that describe their properties or characteristics.
- Instances: Each entity has instances or occurrences, representing individual occurrences of the entity in the real world.
- Identity: Each instance of an entity is uniquely identifiable and can be distinguished from other instances.
- Relationships: Entities can be related to other entities through relationships, forming connections within the database schema.
Types of entities
- Strong entities: Also known as regular entities, these entities have attributes that uniquely identify each instance. They can exist independently of other entities.
- Weak entities: A weak entity does not have a primary key attribute of their own and depends on a related strong entity (owner entity) for their existence. They are identified by their relationship with the owner entity.
- Associative entities: Also called many-to-many entities, these entities are used to represent relationships between relationships. They arise in many-to-many relationships and typically contain attributes in addition to the foreign keys linking the associated entities.
Types of entity keys
- Simple key: A single attribute serves as the primary key.
- Composite key: A combination of two or more attributes serves as the primary key. It is used when no single attribute uniquely identifies each instance.
- Surrogate key: An artificially generated identifier, such as an auto-incremented integer, is used as the primary key. It is often added when no suitable natural key exists or when there are concerns about stability or size of natural keys.
Attributes
Attributes are the characteristics or properties of entities. They describe the details of each entity. For example, attributes of a “Customer” entity might include “Customer ID,” “Name,” and “Email Address.”
Characteristics
- Name: Each attribute has a name that identifies it within the entity.
- Data type: Attributes have a data type that specifies the kind of data they can hold, such as text, number, date, etc.
- Constraints: Attributes may have constraints that define rules or conditions for the values they can contain, such as uniqueness or requiredness.
- Domain: Attributes have a domain, which is the set of all possible values that the attribute can take.
- Nullability: Attributes may allow null values, meaning they can have no value assigned to them for some instances of the entity.
Types of attributes
- Simple attribute: A single atomic value is stored in the attribute. Example: Name, Age.
- Composite attribute: An attribute that can be divided into smaller sub-parts, each representing a distinct attribute.Example:Address (composed of Street, City, Zip Code).
- Single-valued attribute: An attribute that holds a single value for each instance of the entity.
- Multi-valued attribute: An attribute that can hold multiple values for each instance of the entity. Example: Phone Numbers.
Relationships
ERD relationships show how entities are connected or related to each other in the database. They represent interactions or associations between entities. Examples include “owns,” “buys,” or “works for.”
Characteristics
- Name: Each relationship has a name that describes the nature of the association between entities.
- Directionality: Relationships can be unidirectional or bidirectional, indicating the flow or direction of the association between entities.
- Cardinality: Cardinality specifies the number of instances of one entity that can be associated with instances of another entity in a relationship. It defines the minimum and maximum occurrences of related entities.
- Degree: The degree of a relationship indicates the number of entities participating in the relationship. Relationships can be unary (involving a single entity), binary (involving two entities), ternary (involving three entities), etc.
- Attributes: Relationships can have attributes that describe additional information or properties about the association between entities.
- Recursive relationships: Some relationships involve an entity being related to itself, known as recursive relationships. They represent connections or interactions within the same entity.
Types of relationships
- One-to-one (1:1): Each instance of one entity is associated with exactly one instance of another entity.
- One-to-many (1:N): In one-to-many relationships, each instance of one entity is associated with multiple instances of another entity, but each instance of the other entity is associated with only one instance of the first entity.
- Many-to-one (N:1): Multiple instances of one entity are associated with exactly one instance of another entity.
- Many-to-many (M:N): Multiple instances of one entity are associated with multiple instances of another entity, and vice versa.
- Recursive relationships: An entity is related to itself through a relationship. This can represent hierarchical structures or self-referential associations.
Cardinality
Cardinality specifies the number of instances of one entity that can be associated with the number of instances of another entity in a relationship. It describes the minimum and maximum number of occurrences of one entity that can be associated with occurrences of another entity.
- Minimum cardinality: Specifies the minimum number of instances required in a relationship.
- Maximum cardinality: Indicates the maximum number of instances allowed in a relationship.
- Directionality: Determines if the relationship is one-way or two-way.
- Completeness: Shows whether participation in the relationship is mandatory or optional.
- Multiplicity: Defines the range of valid occurrences for each entity.
- Constraint enforcement: Ensures data integrity by enforcing rules on entity participation.
Drawing ER Diagrams Using Creately
You can draw entity relationship diagrams manually, especially when you are just informally showing simple systems to your peers. However, for more complex systems and for external audiences, you can use Creately free ER diagram maker to craft visually engaging and precise ER diagrams.
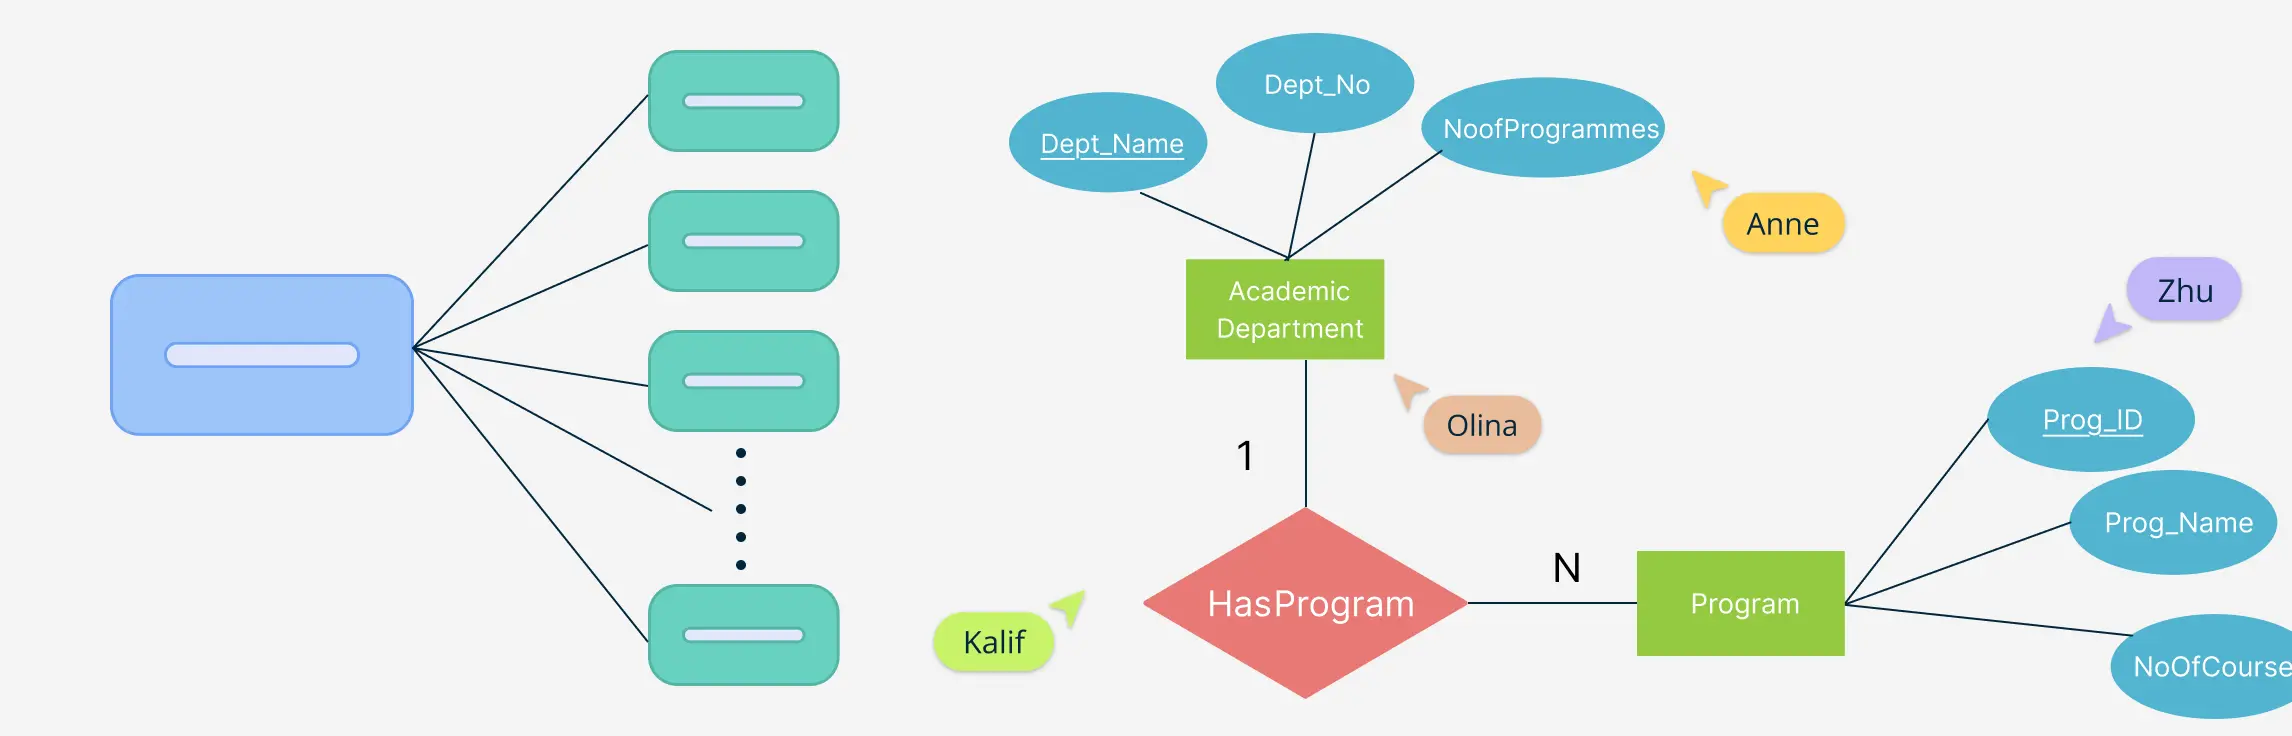
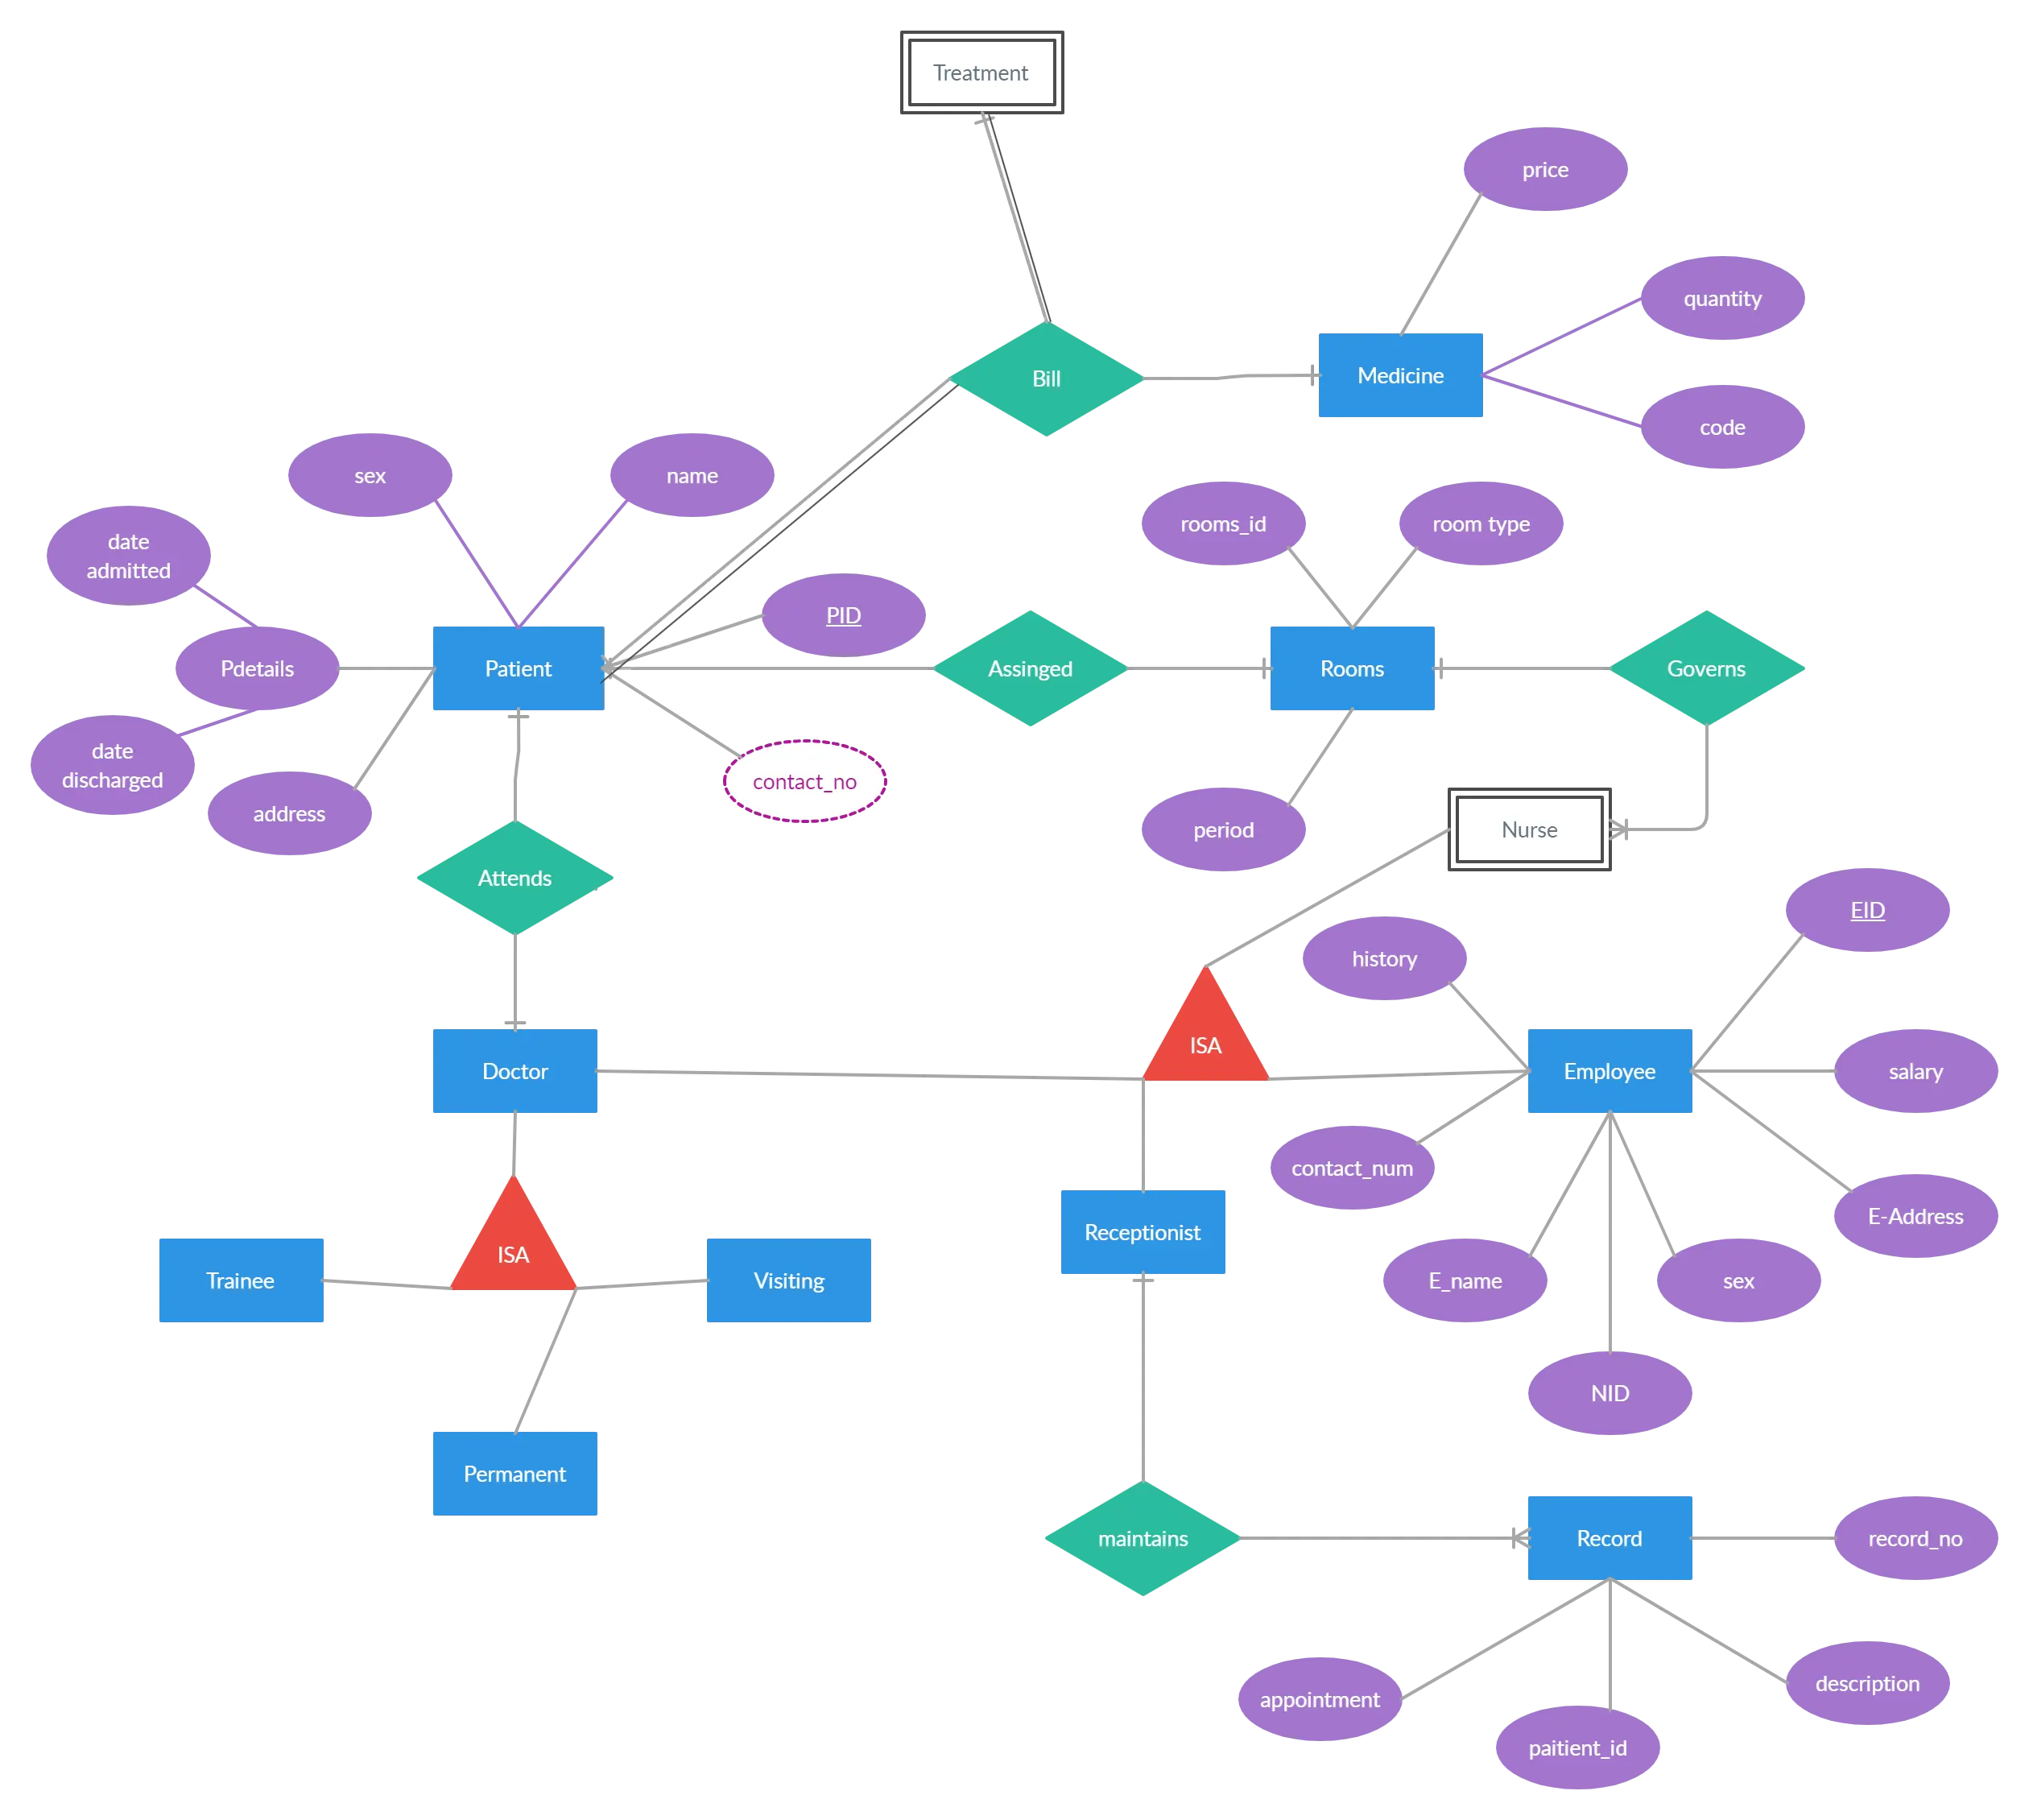
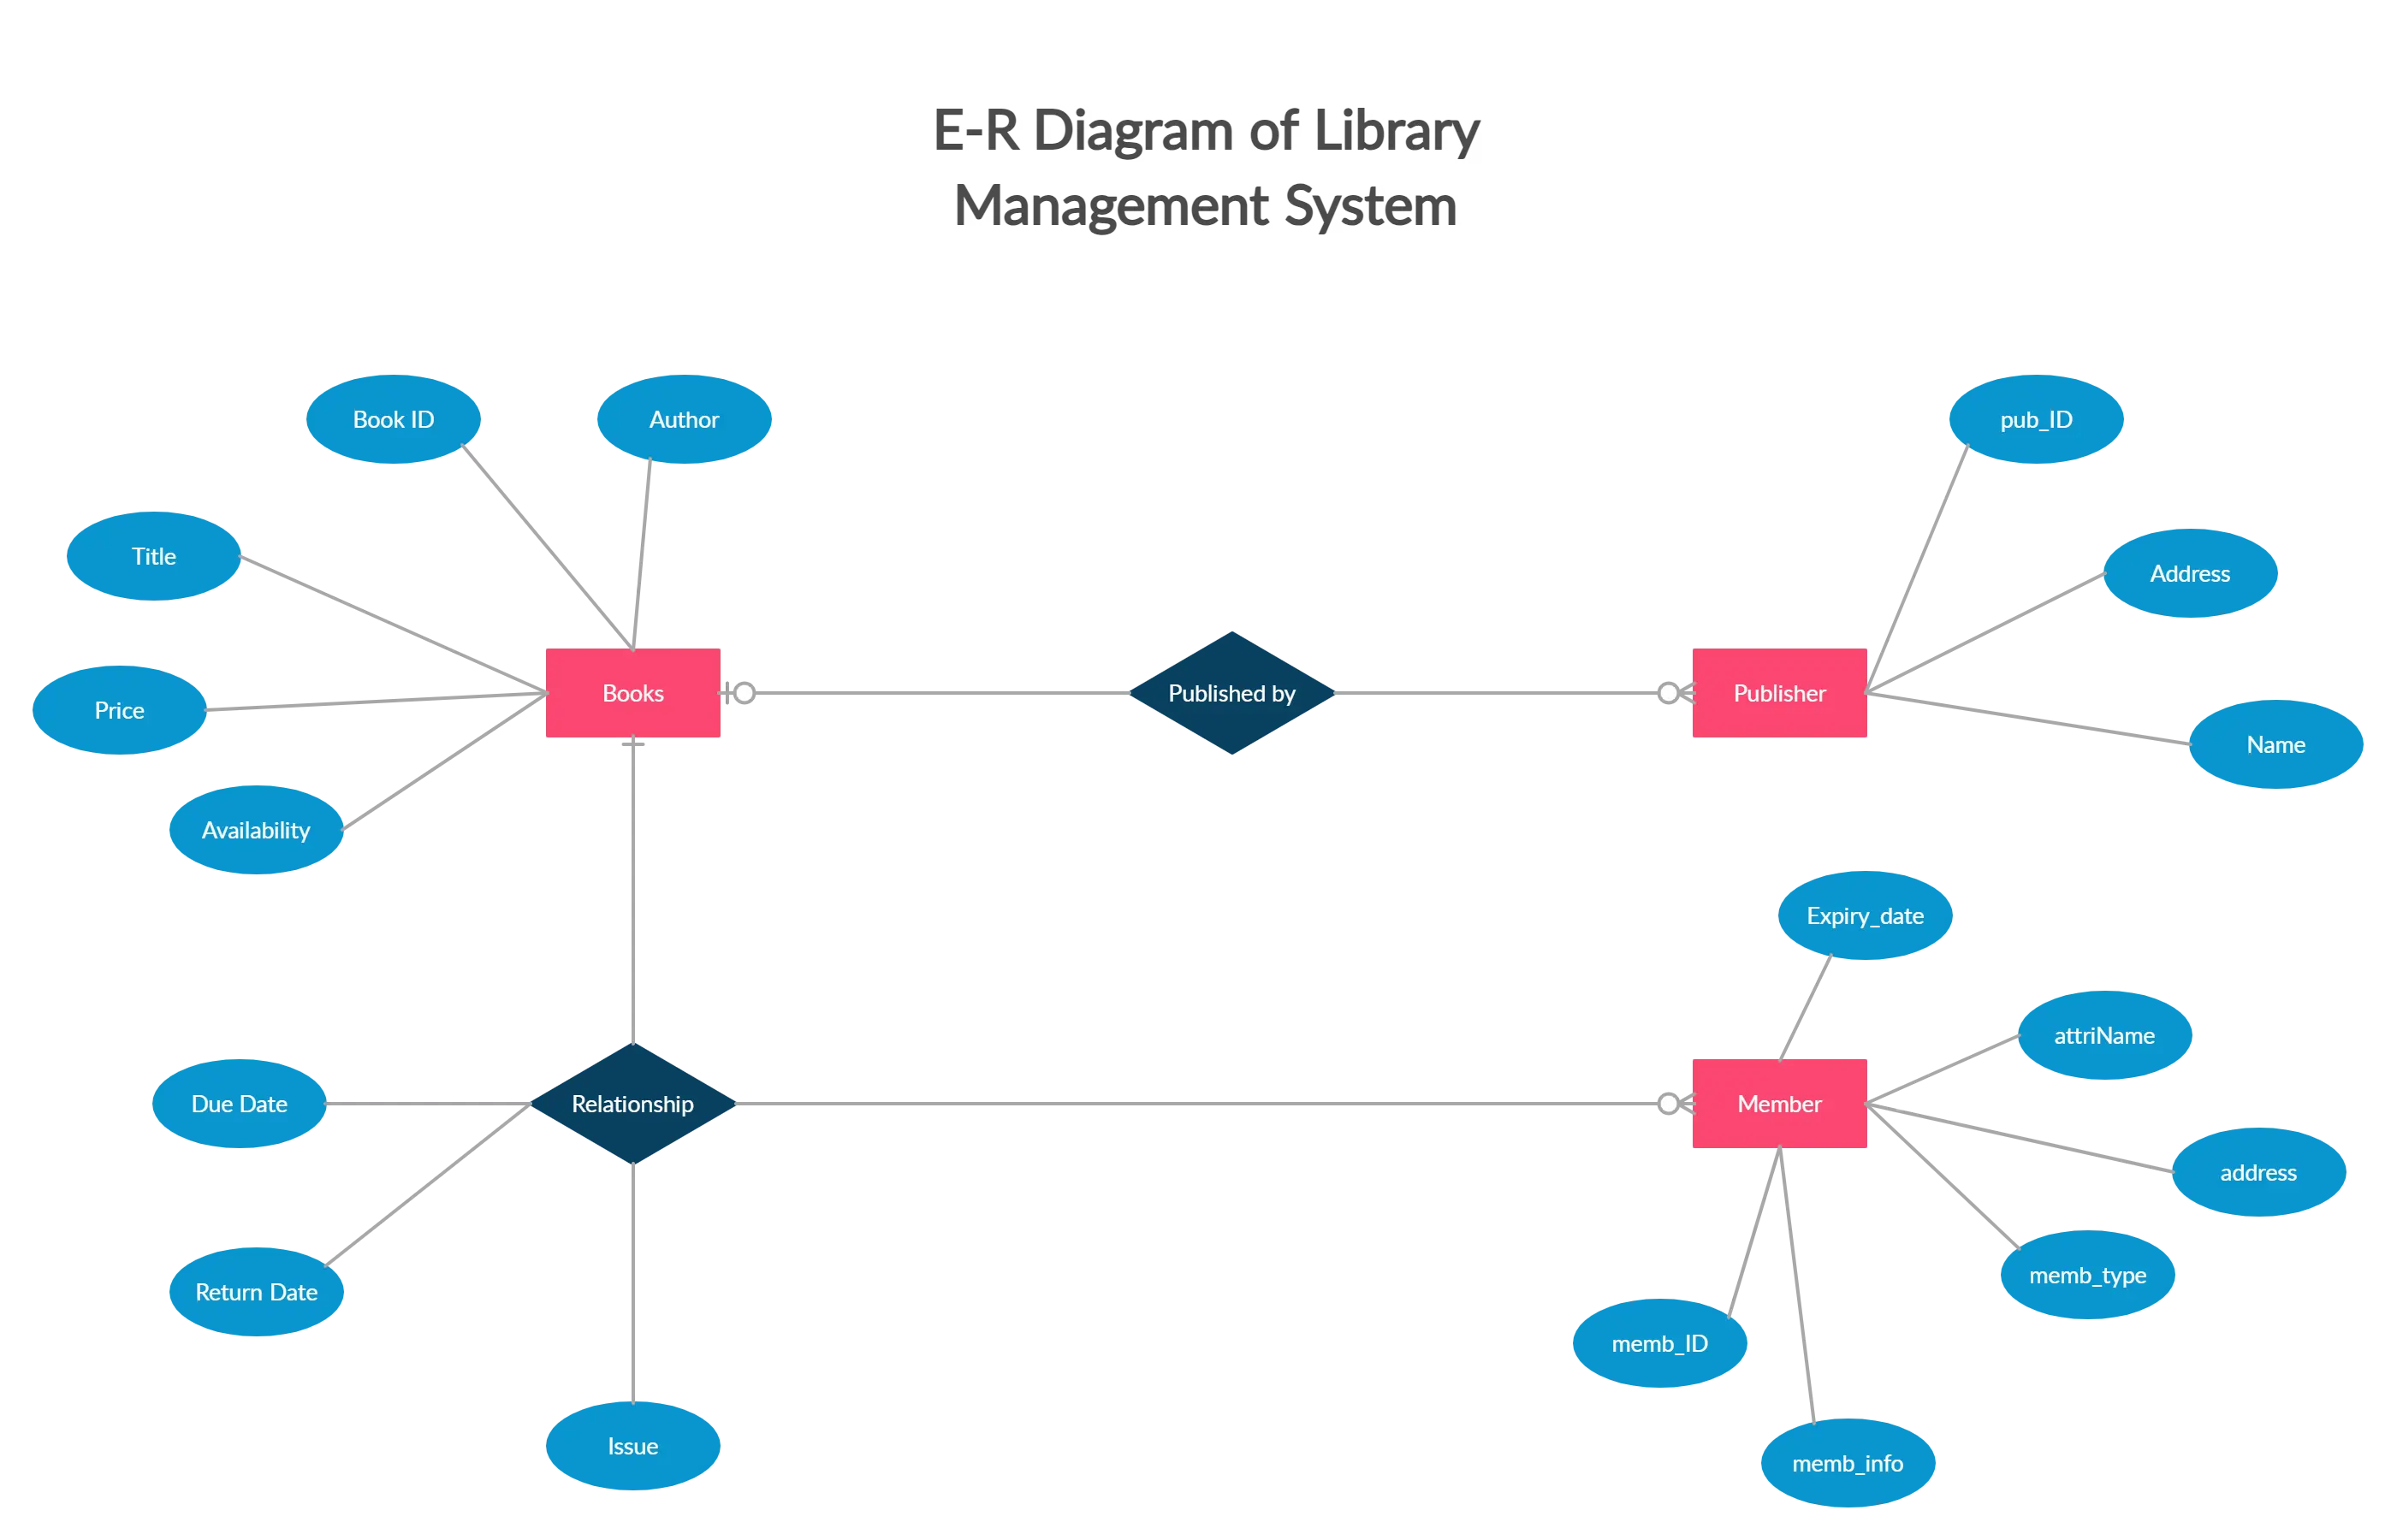
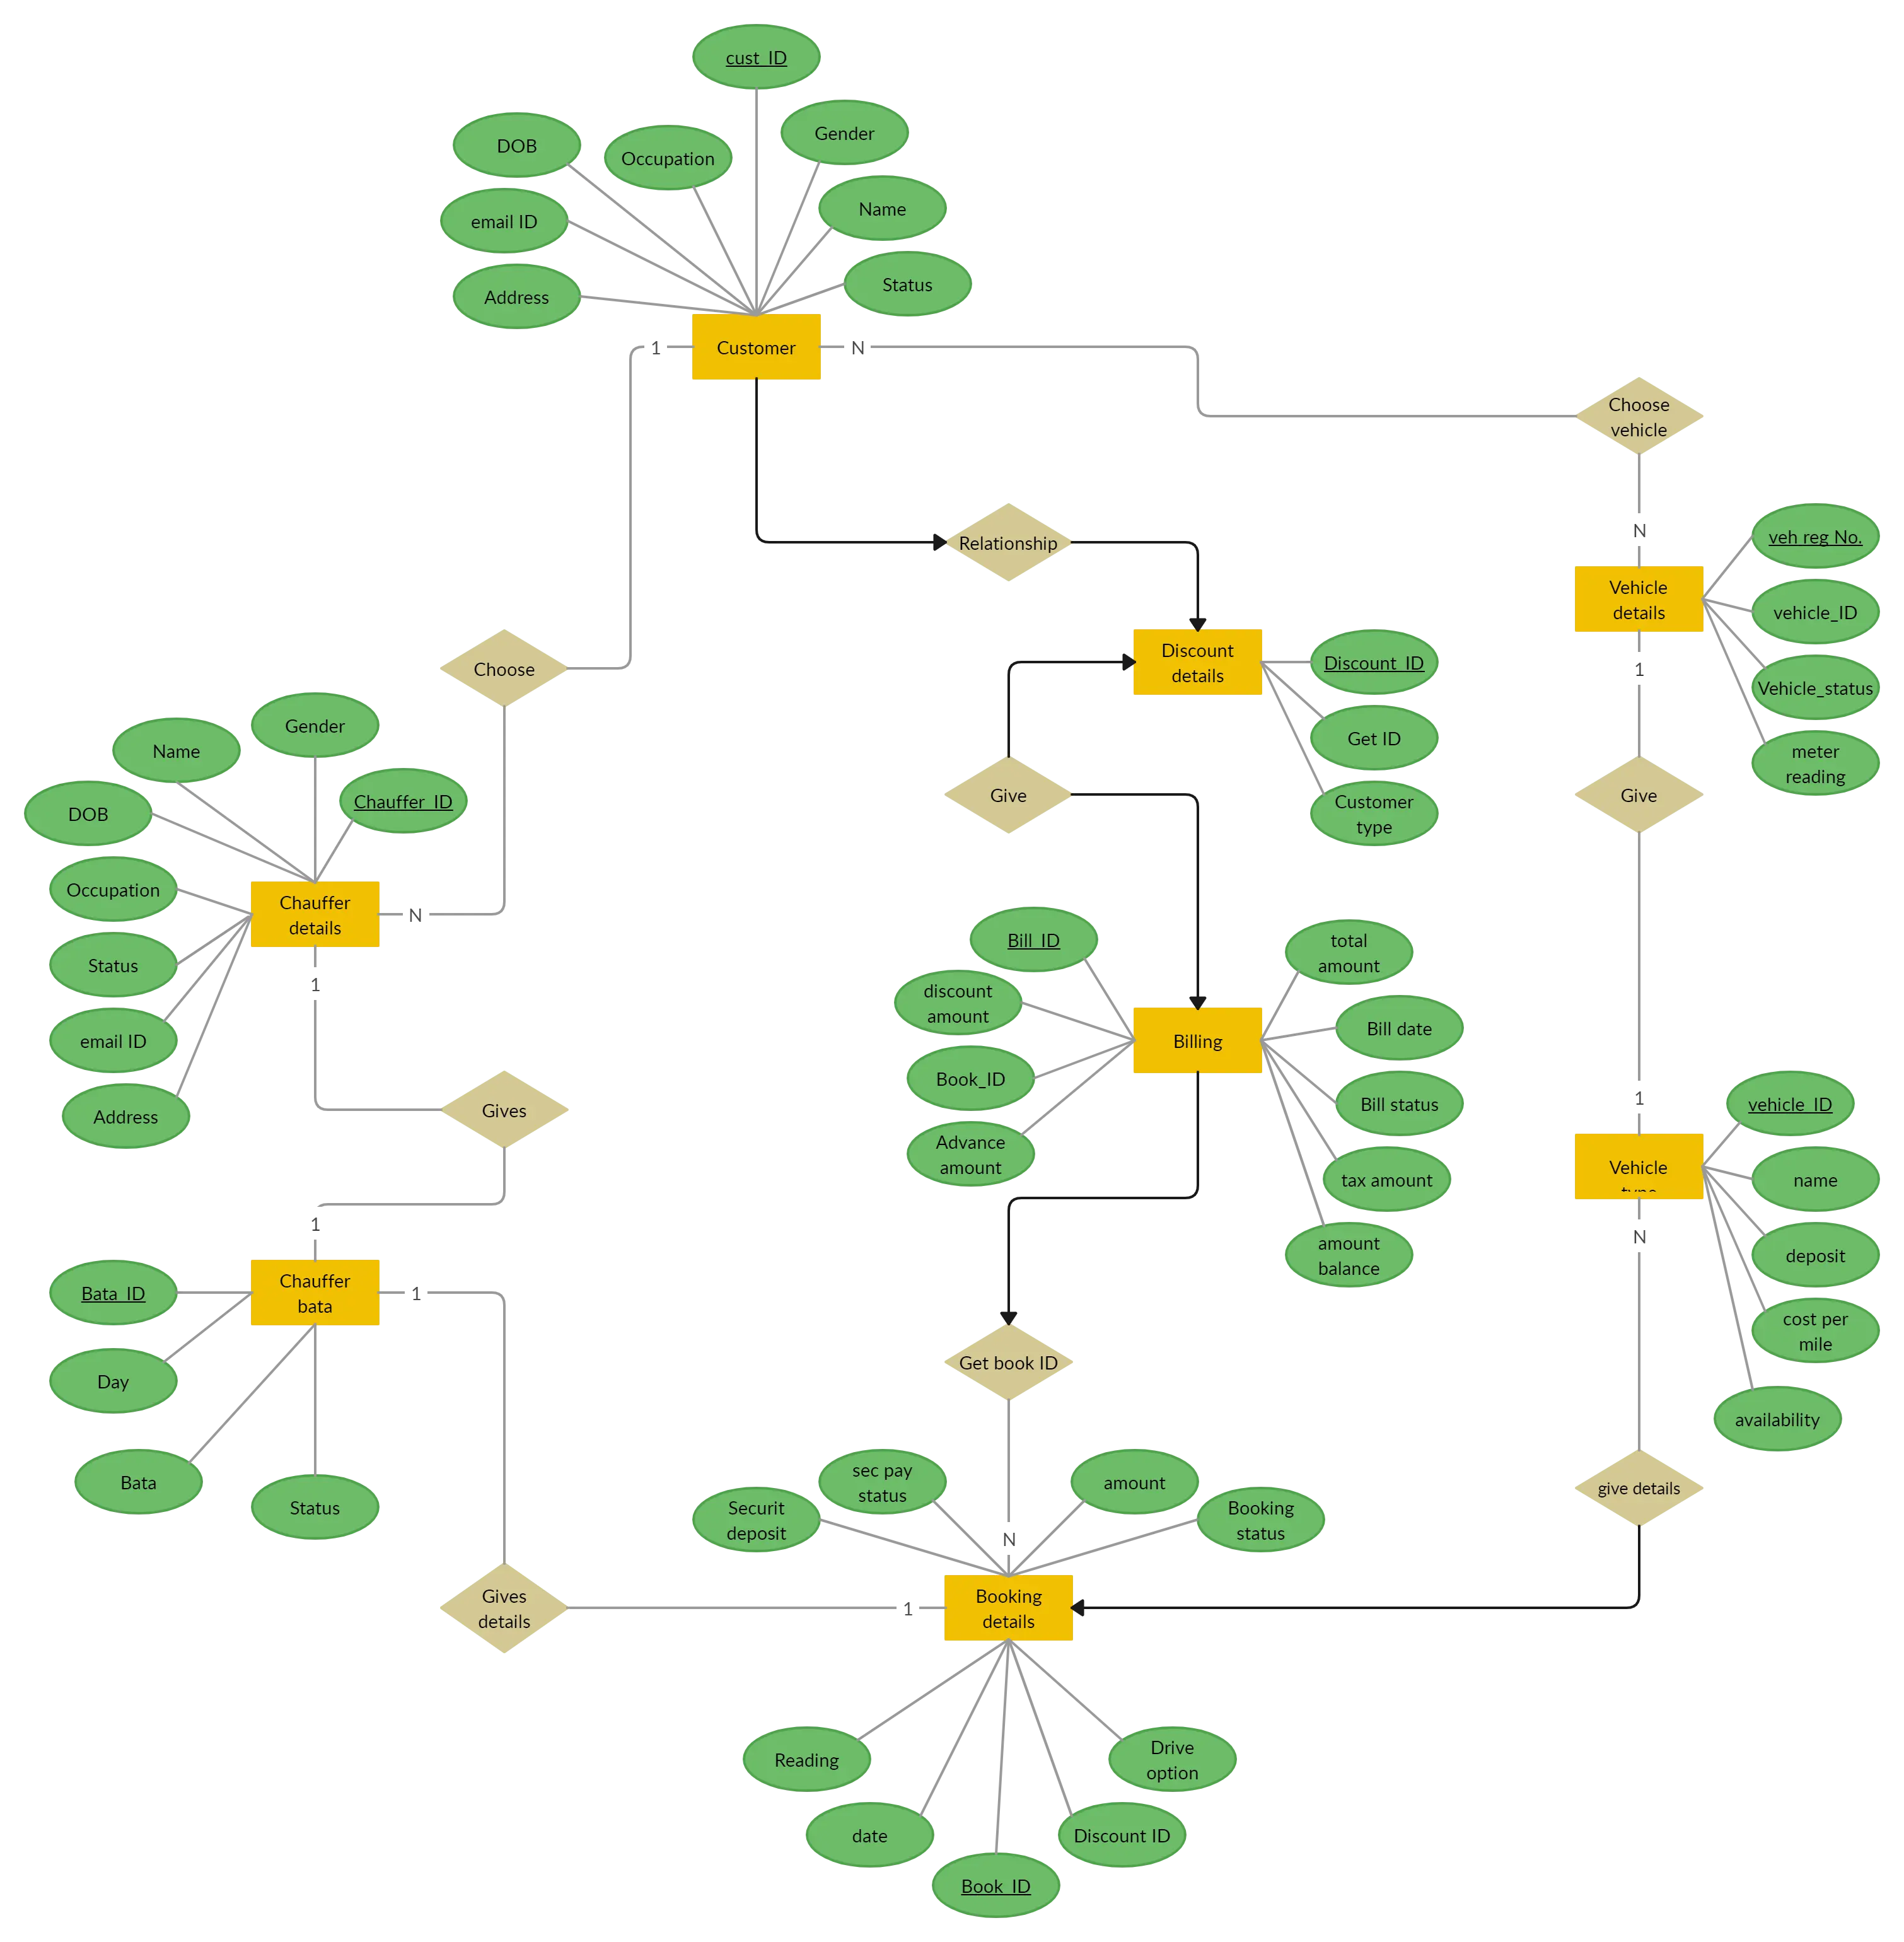
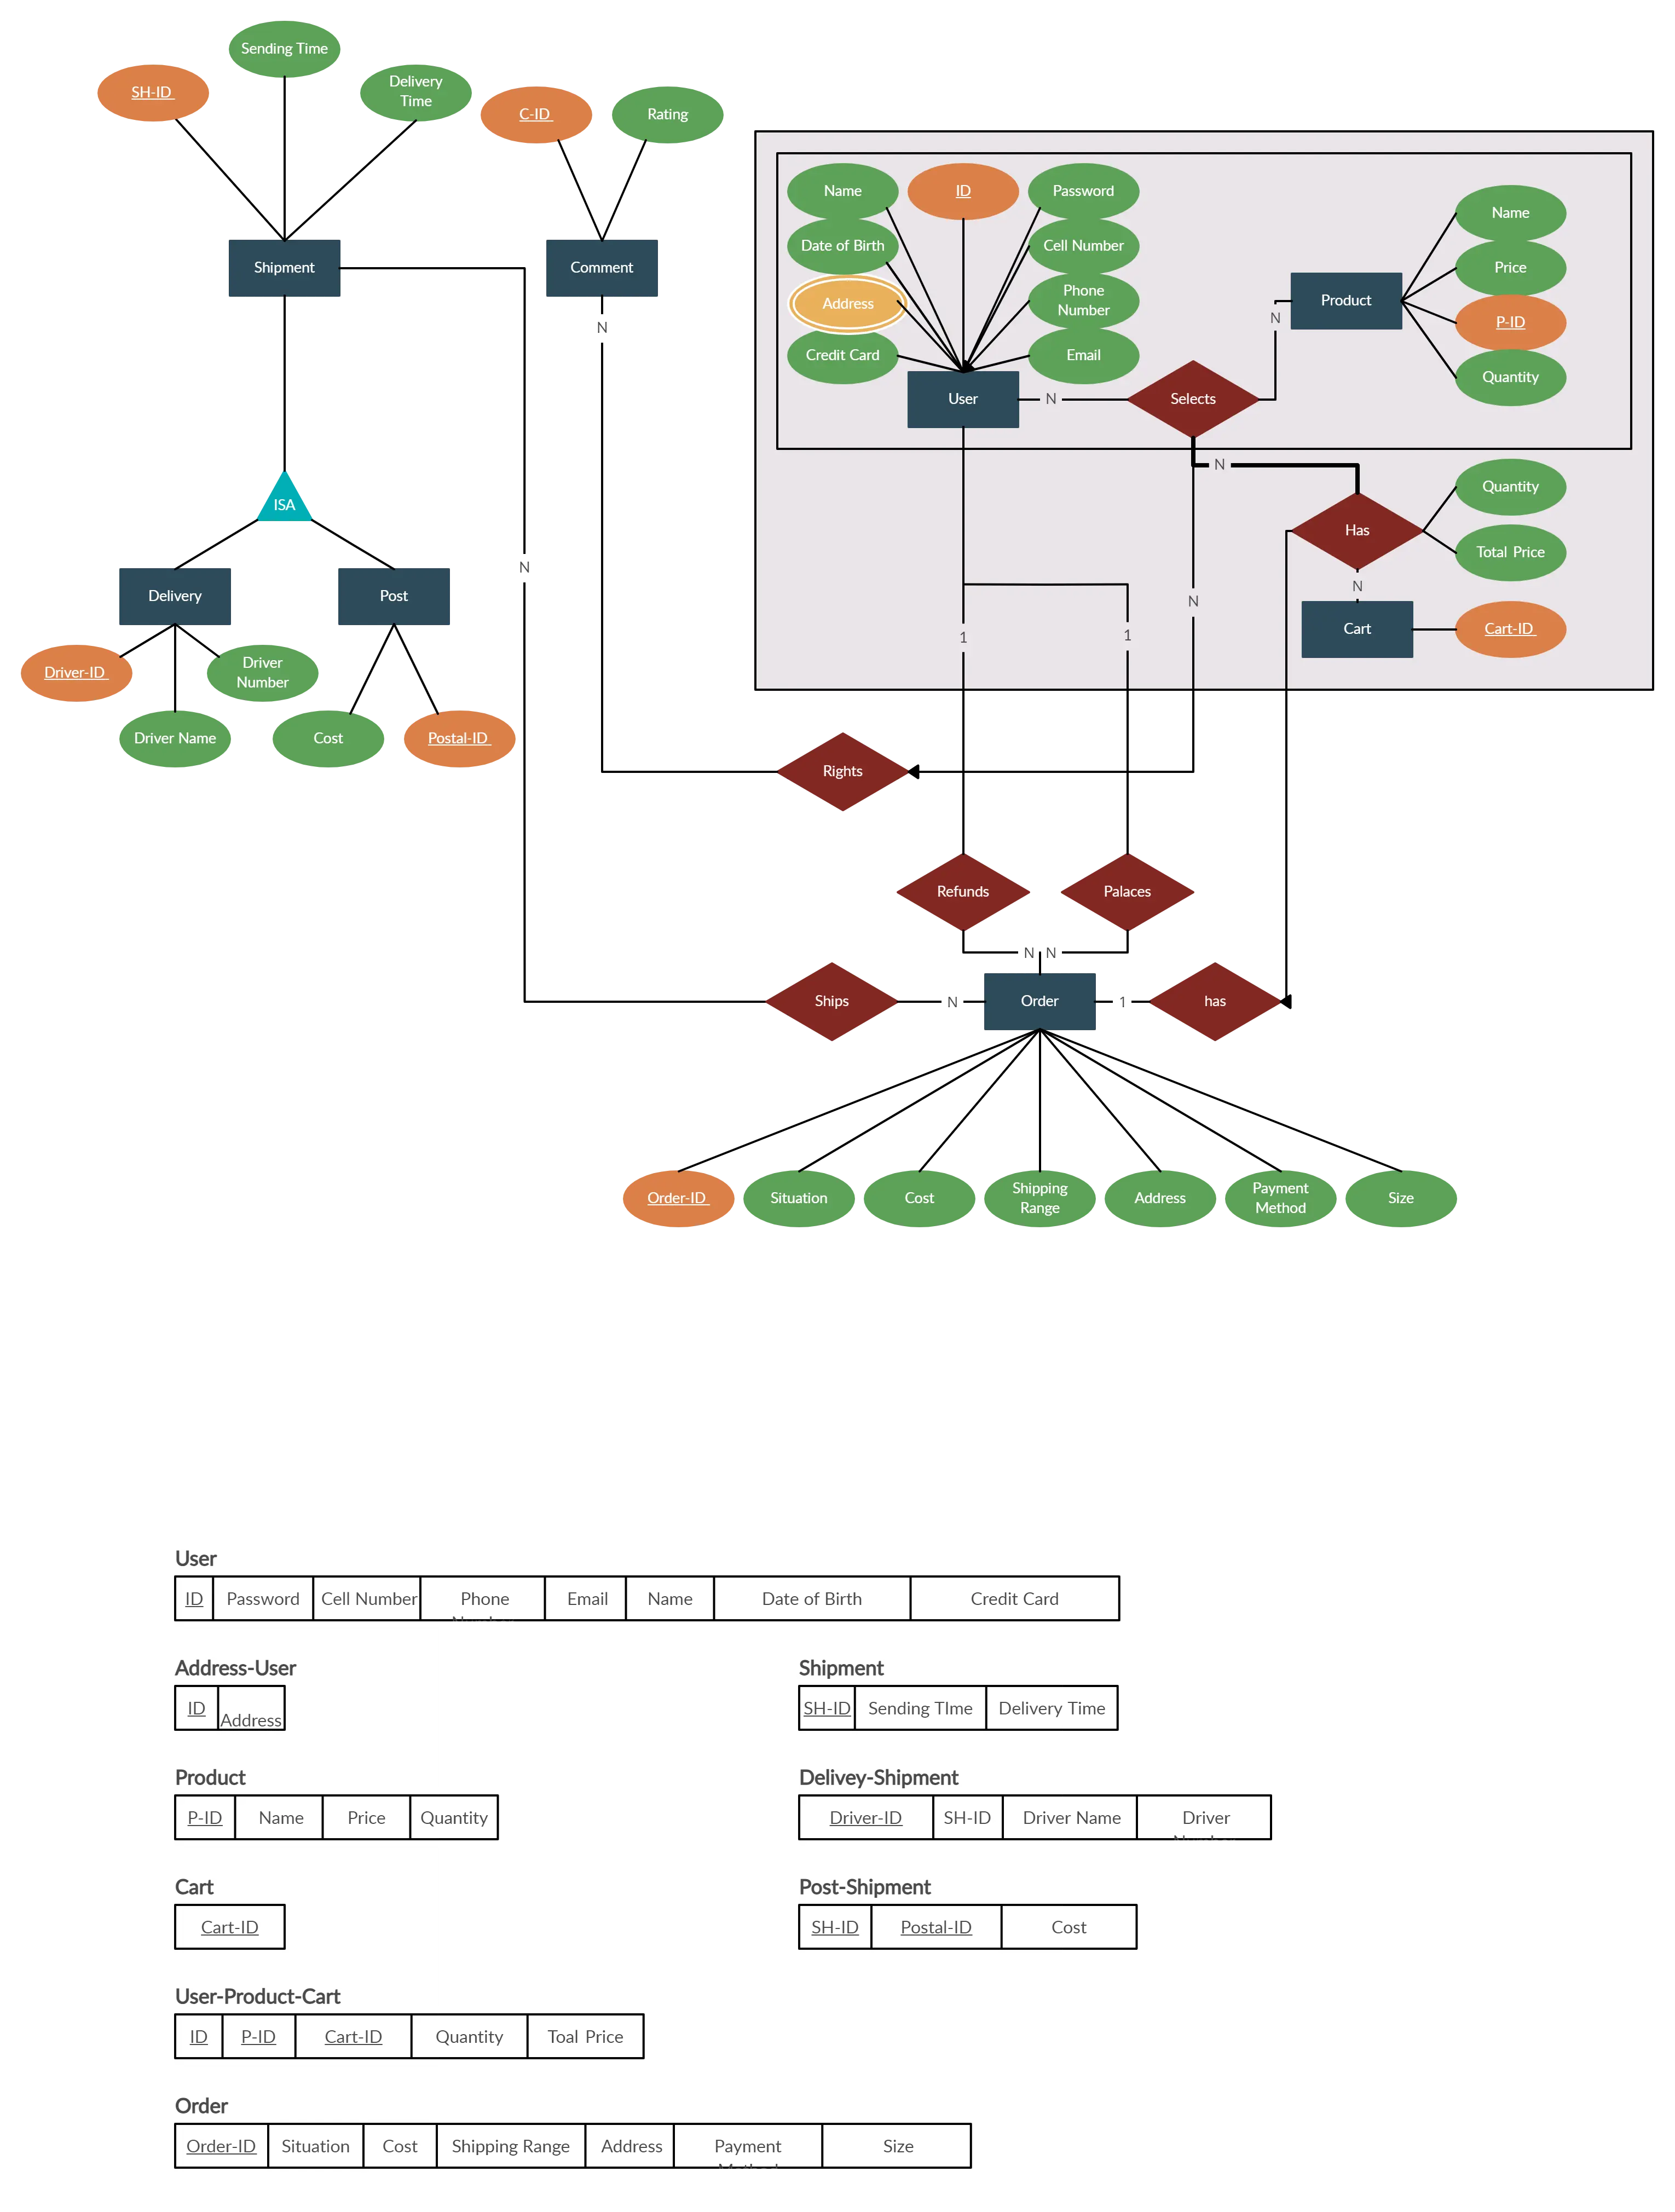
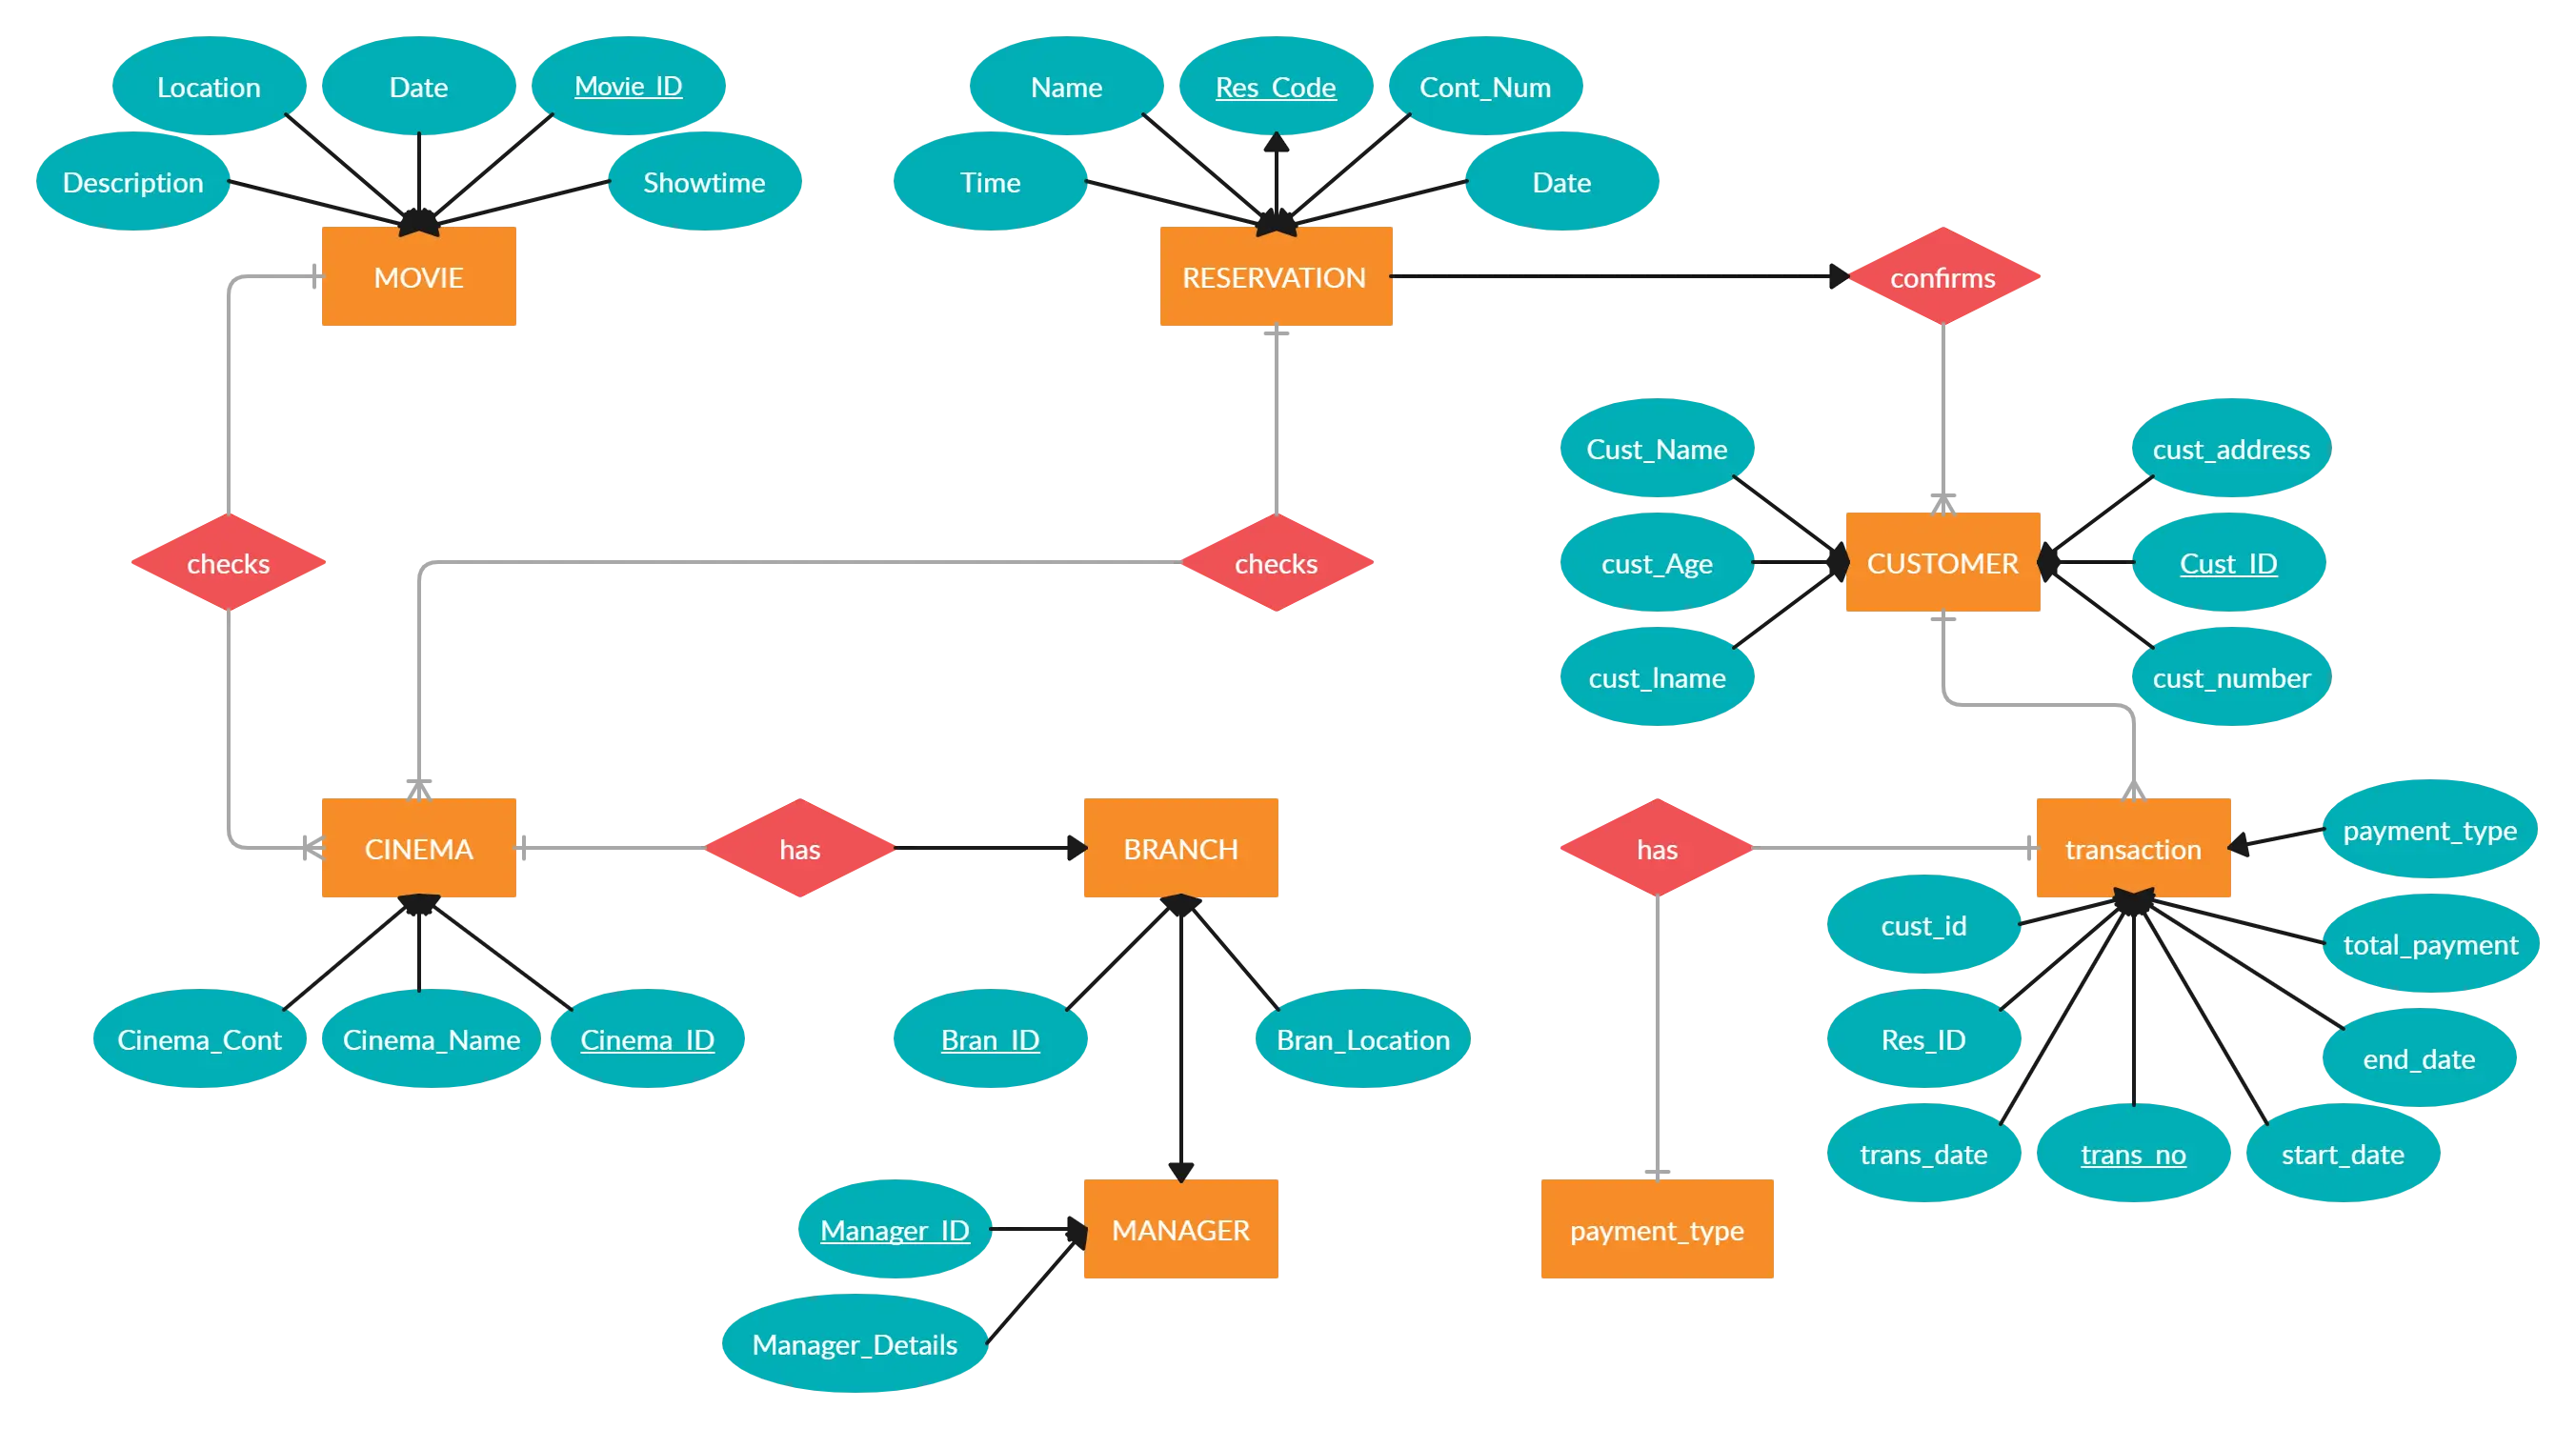
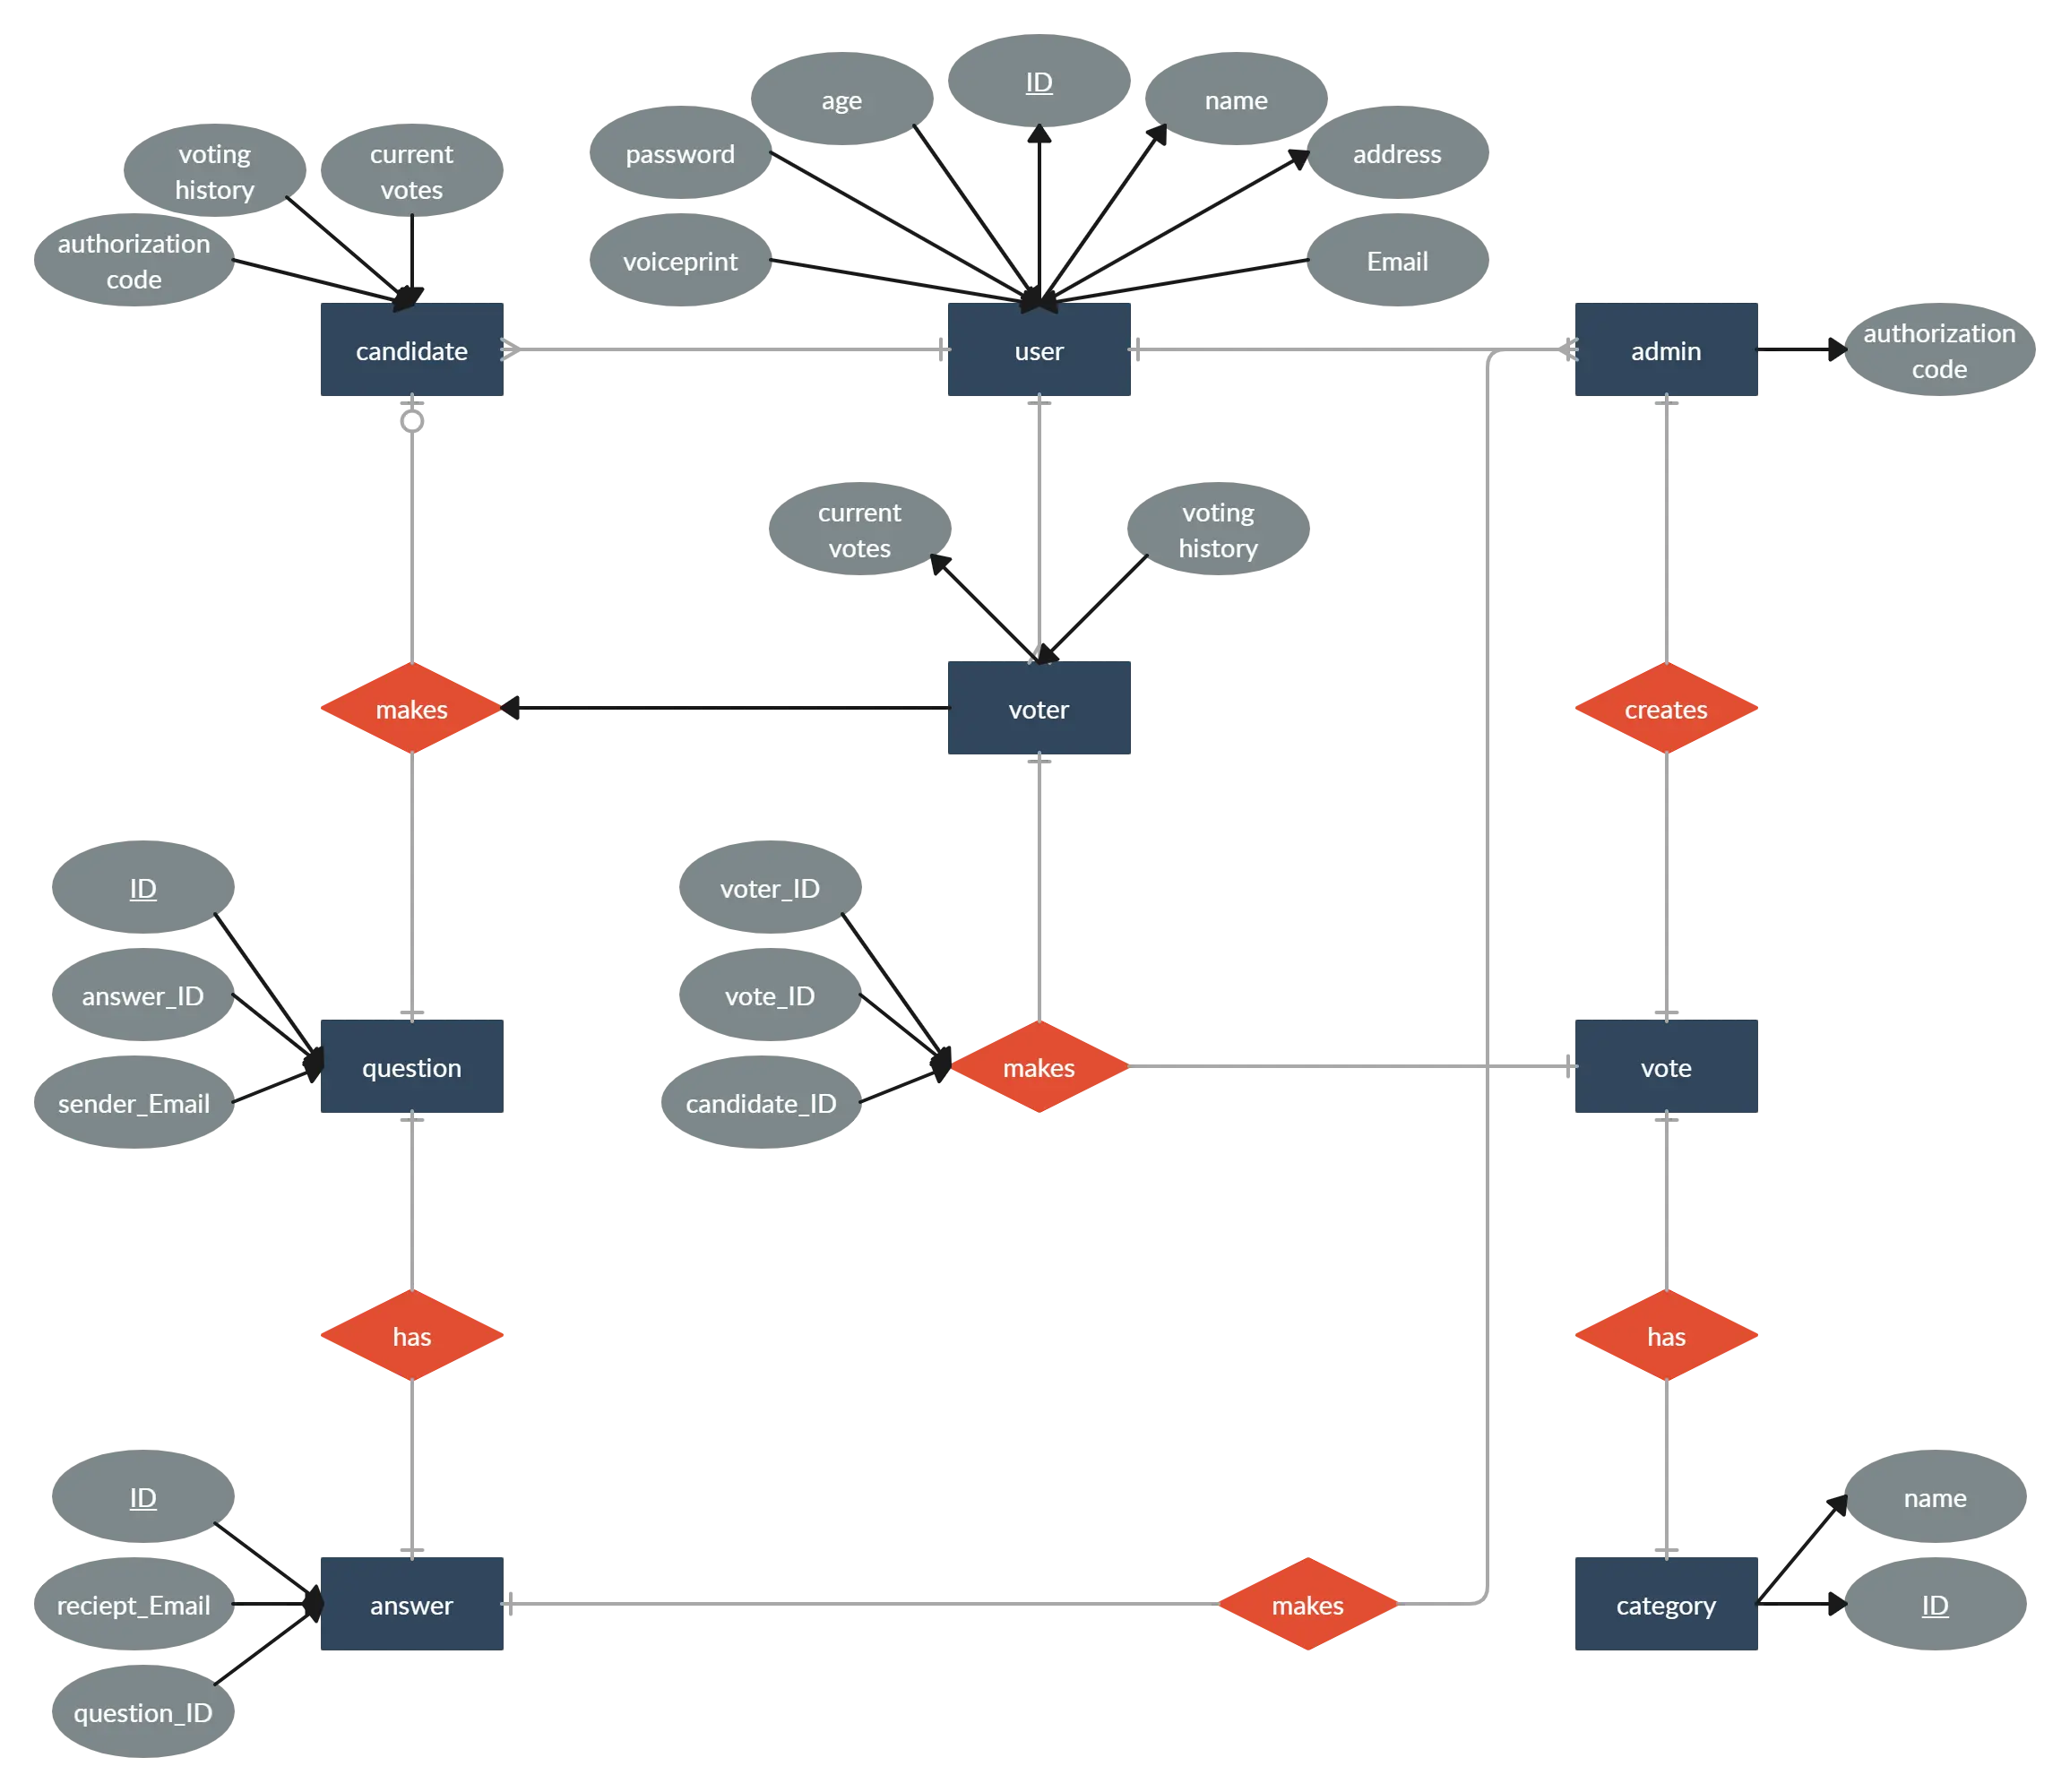
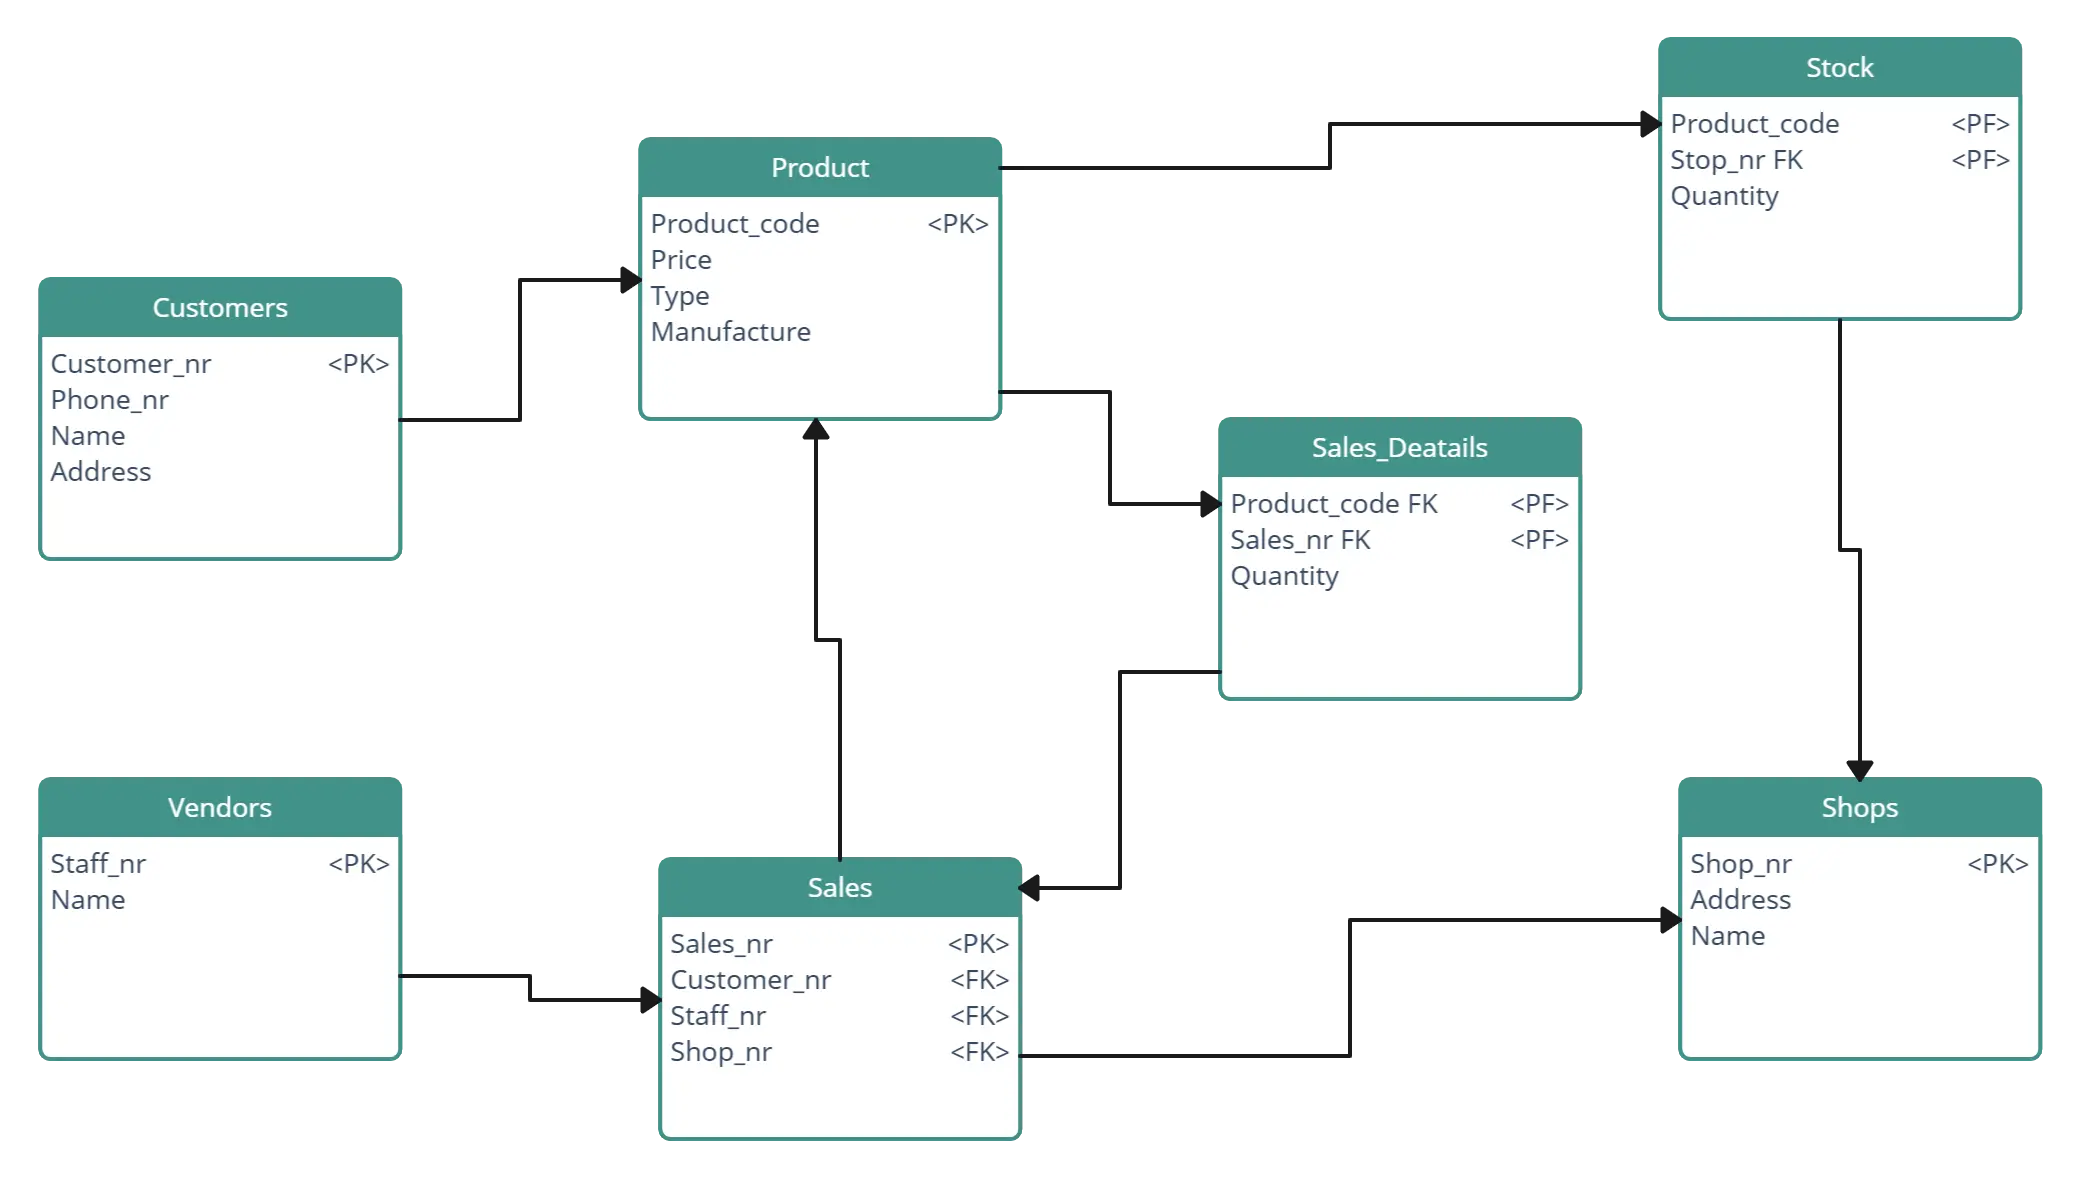
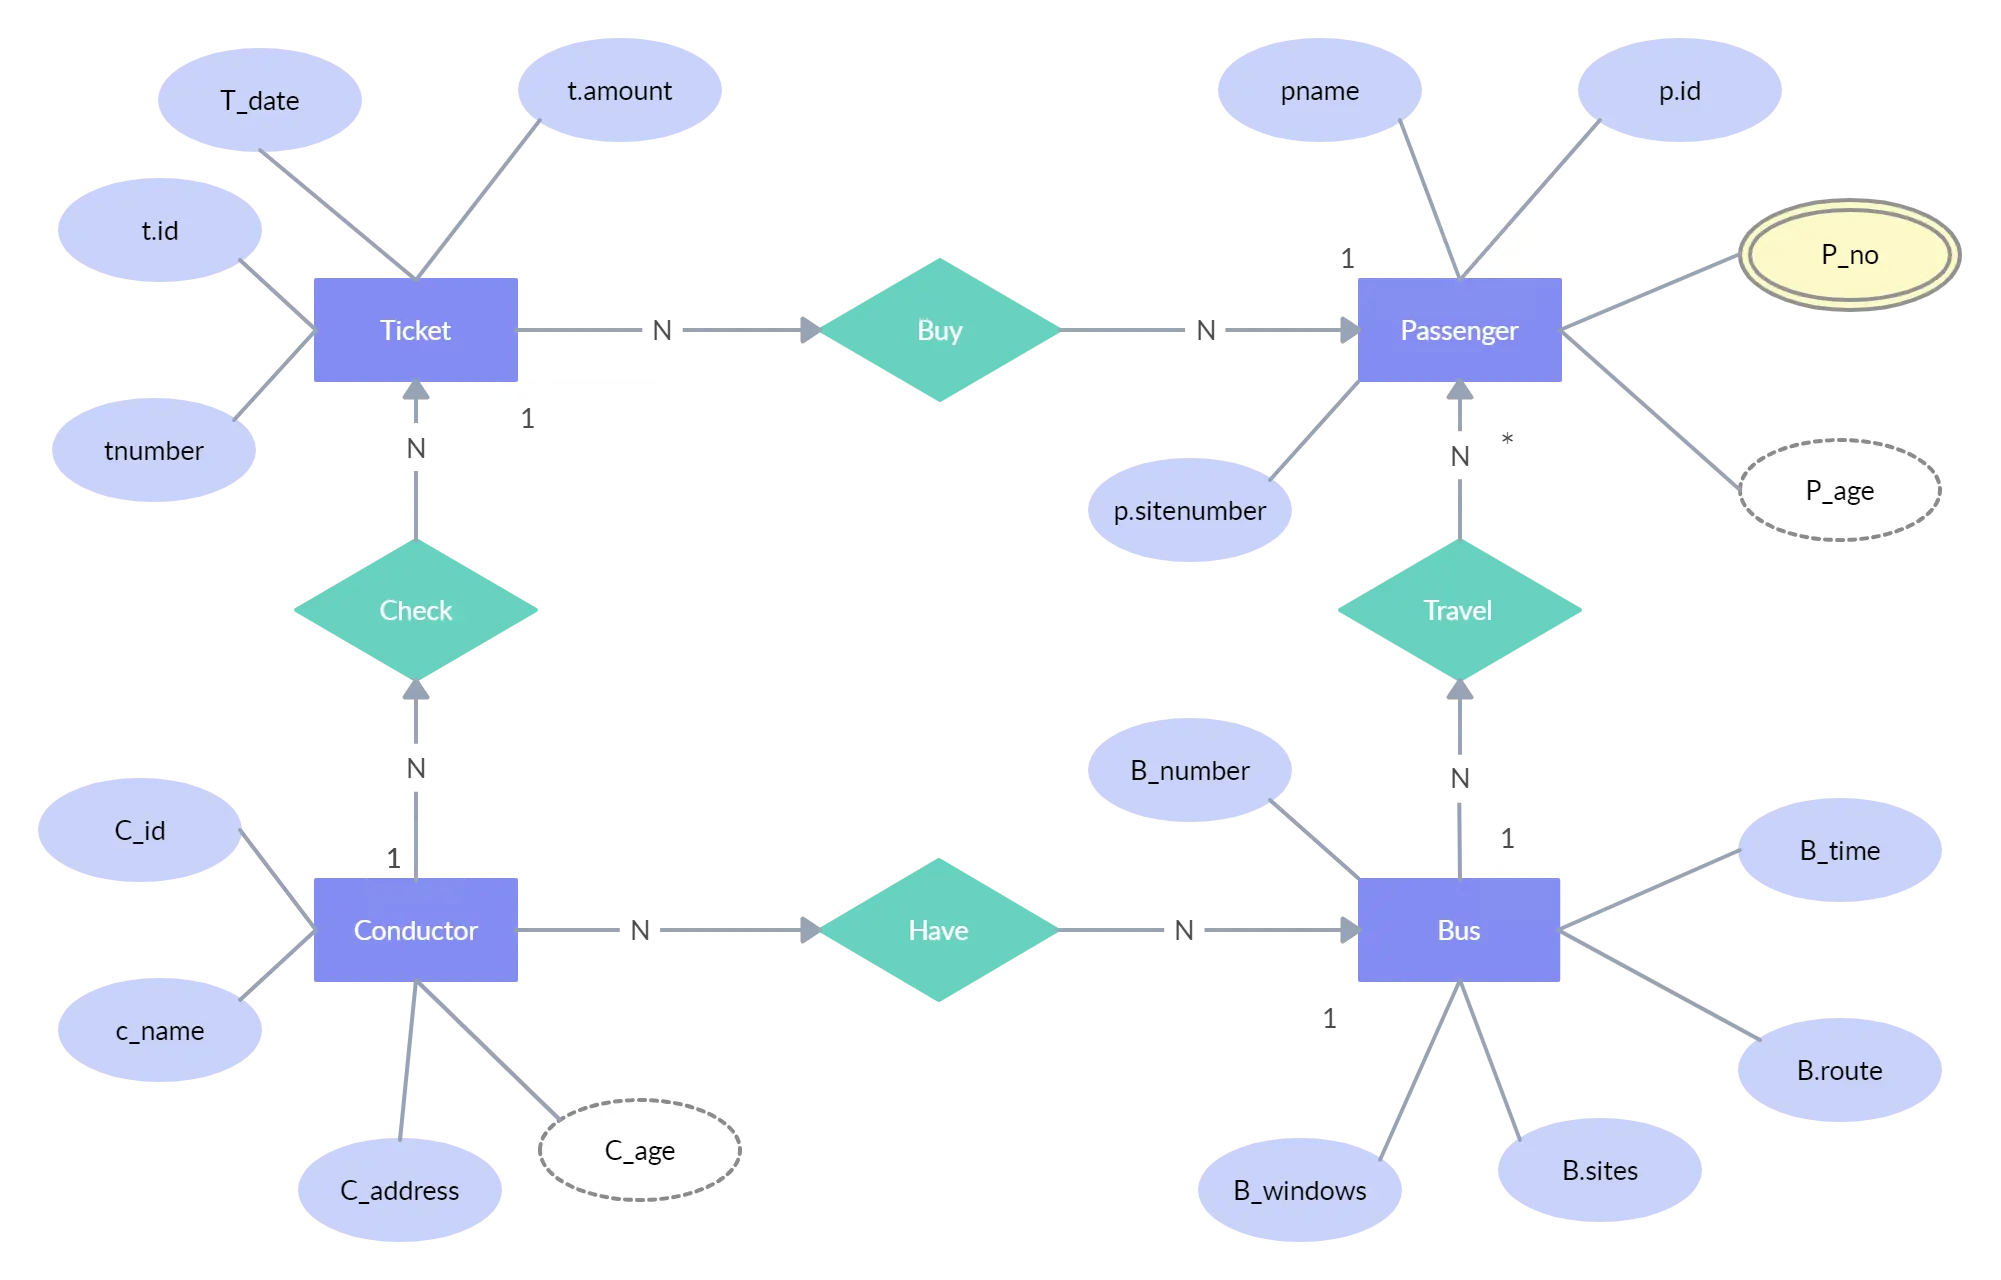
ER Diagram Templates
Below are some ER diagram templates so you can get started quickly. Clicking on the image and in the new page that opens click the “Use as Template” button. For more templates, check our pre-made ER diagram templates.


Uses of ER Diagrams?
ER diagrams are essential tools for designing, communicating, maintaining, and optimizing databases. They facilitate collaboration, ensure data integrity, and contribute to the efficient management of database systems. Here are several uses of ER diagrams.
Database design: ER diagrams are used to design databases. They provide a visual representation of how different pieces of information, called entities, are related to each other. This helps in planning the structure of the database before it’s built.
Communication: ER diagrams act as a common language between people involved in developing databases, such as developers, designers, and clients. They help everyone understand how the database will work and how data will be organized. Better communication and collaboration in interaction-heavy work has been associated with 20-25% productivity gains (Keller and Meaney, 2013).
Database maintenance: Even after a database is created, ER diagrams remain useful for maintenance. They help developers understand the existing structure and make changes or updates as needed while ensuring the integrity of the database.
Documentation: ER diagrams serve as documentation for the database system. They provide a detailed overview of the database schema, including entities, attributes, and relationships. This documentation helps in troubleshooting issues and training new team members.
Identifying redundancy and inconsistencies: By visualizing relationships between entities, ER diagrams help identify redundant or inconsistent data in the database design. This allows for optimization and ensures data accuracy. In matrixed organizations, 43% of employees report complexity harms decision quality and speed, reinforcing the need for clear and consistent data models (Marmolejo et al., 2021).
Database optimization: ER diagrams aid in optimizing database performance. By understanding entity relationships, developers can design efficient queries and data retrieval strategies, leading to improved performance and scalability.
Integration with development tools: ER diagrams can be integrated into various development tools and database management systems. Many software tools provide features for creating, editing, and generating code from ER diagrams, streamlining the database development process.
References
ResearchGate. (n.d.). (PDF) A Comparative Analysis of Entity-Relationship Diagrams. [online] Available at: https://www.researchgate.net/publication/243781001_A_Comparative_Analysis_of_Entity-Relationship_Diagrams.
Sciencedirect.com. (2016). entity relationship diagram - an overview | ScienceDirect Topics. [online] Available at: https://www.sciencedirect.com/topics/computer-science/entity-relationship-diagram.
FAQs about Entity Relationship Diagrams
Why are ER diagrams important?
What are the common mistakes to avoid when creating ER diagrams?
- Not defining the entities and relationships clearly
- Overcomplicating the diagram by including too many entities and relationships
- Using inconsistent naming conventions for entities and attributes
- Failing to specify cardinality and participation constraints for relationships
- Using unclear or ambiguous symbols or terminology
What types of relationships can be represented in an ER diagram?
ER diagrams can represent several types of relationships, such as:
- one-to-one,
- one-to-many, and
- many-to-many relationships.
What are the three types of data models in ER diagrams?
- Conceptual Model
- Logical Model
- Physical Data Model
What are the best practices to follow when creating ER diagrams?
- Provide a precise and appropriate name for each entity, attribute, and relationship in the diagram.
- Remove vague, redundant or unnecessary relationships between entities.
- Never connect a relationship to another relationship.
- Make effective use of colors.
What are the benefits of creating ER diagrams?
- ER diagrams constitute a very useful framework for creating and manipulating databases.
- ER diagrams are readily translatable into relational tables which can be used to quickly build databases.
- Applied in describing the different relationships and operations within an organization.