When you review family health history, the hardest part is not capturing conditions. It’s spotting inherited risk across generations quickly. Genogram Health View mode helps you see those patterns at a glance by color-coding conditions across the family. In this guide, you’ll learn how to add the right medical data for a genogram health assessment, turn on Health View, and use it to review hereditary patterns faster during genetic counseling and clinical preparation.
What Is Genogram Health View Mode?
Health View is a genogram visualization mode that highlights medical data across the diagram. When activated, individuals are automatically color-coded according to the health conditions recorded in their profile. This condition-based genogram view allows clinicians to quickly identify,
- Recurring diseases across generations.
- Clusters of similar diagnoses among relatives.
- Patterns that may suggest hereditary risk.
Instead of manually reviewing medical records for each family member, clinicians can analyze hereditary trends directly from the genogram.
Adding Medical Conditions to Highlight in Health View
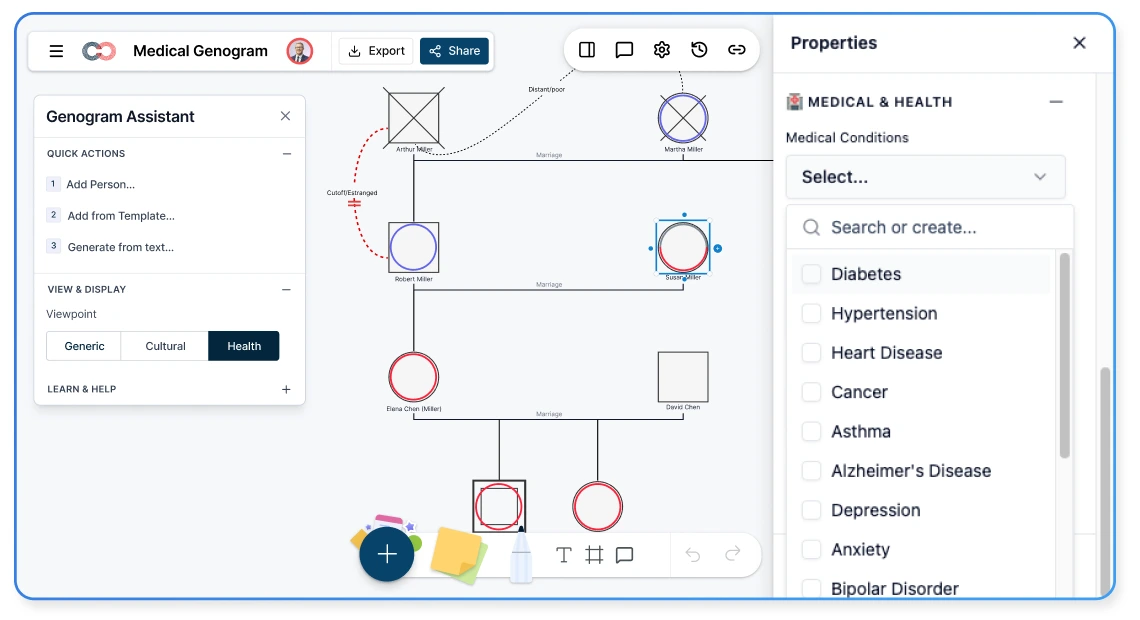
Before activating Health View mode, clinicians should first add the medical conditions to individuals in the genogram. To do this, select a person in the diagram and mark the applicable conditions in the Properties panel. Adding this information ensures that Health View has the necessary data to highlight patterns across the family.
The medical conditions highlighted in Health View Mode include:
- Diabetes
- Hypertension
- Heart Disease
- Cancer
- Asthma
- Alzheimer’s Disease
- Depression
- Anxiety
- Bipolar Disorder
- Schizophrenia
- Autism Spectrum Disorder
- ADHD
- Down Syndrome
- Anemia
- Albinism
- Obesity
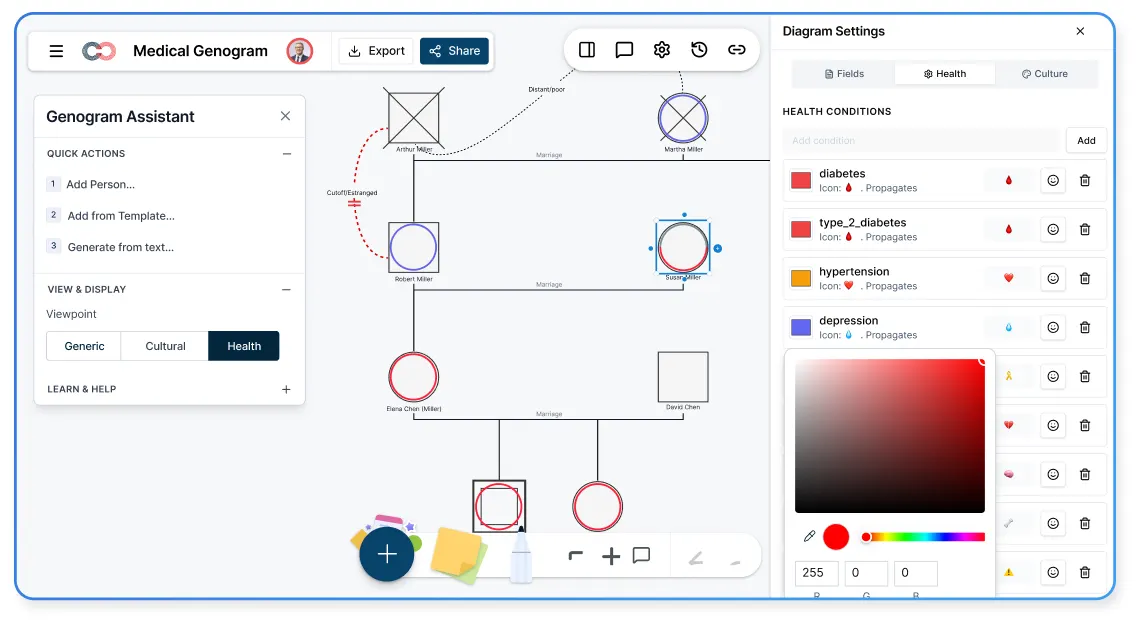
Activating the Medical & Genetic Field Pack
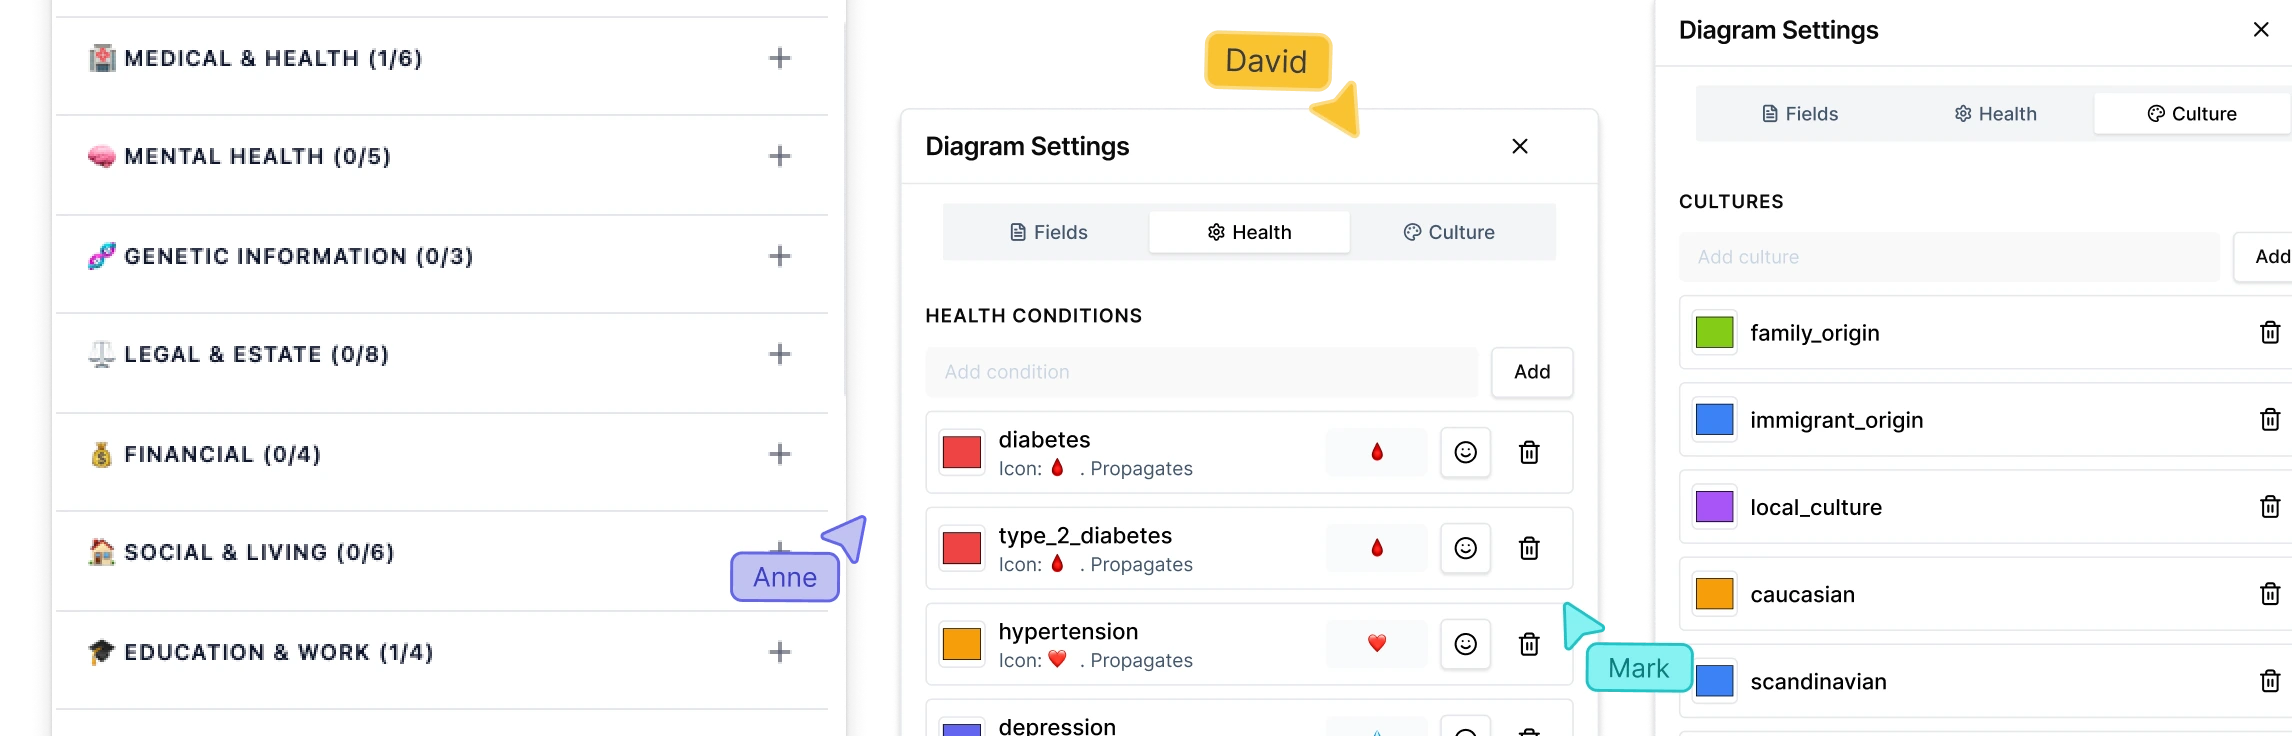
These data fields come from the Medical & Genetic field pack, which store the clinical data used to identify hereditary patterns. You can activate this field pack by selecting a person in the genogram, and clicking on the Diagram Settings panel. Here, you can even customize the colors that are assigned for the medical conditions you plan on tracking.
Read our genogram field packs guide to learn which field packs are available, the data fields they cover, and how to activate the ones you need.
How to Turn On Health View Mode
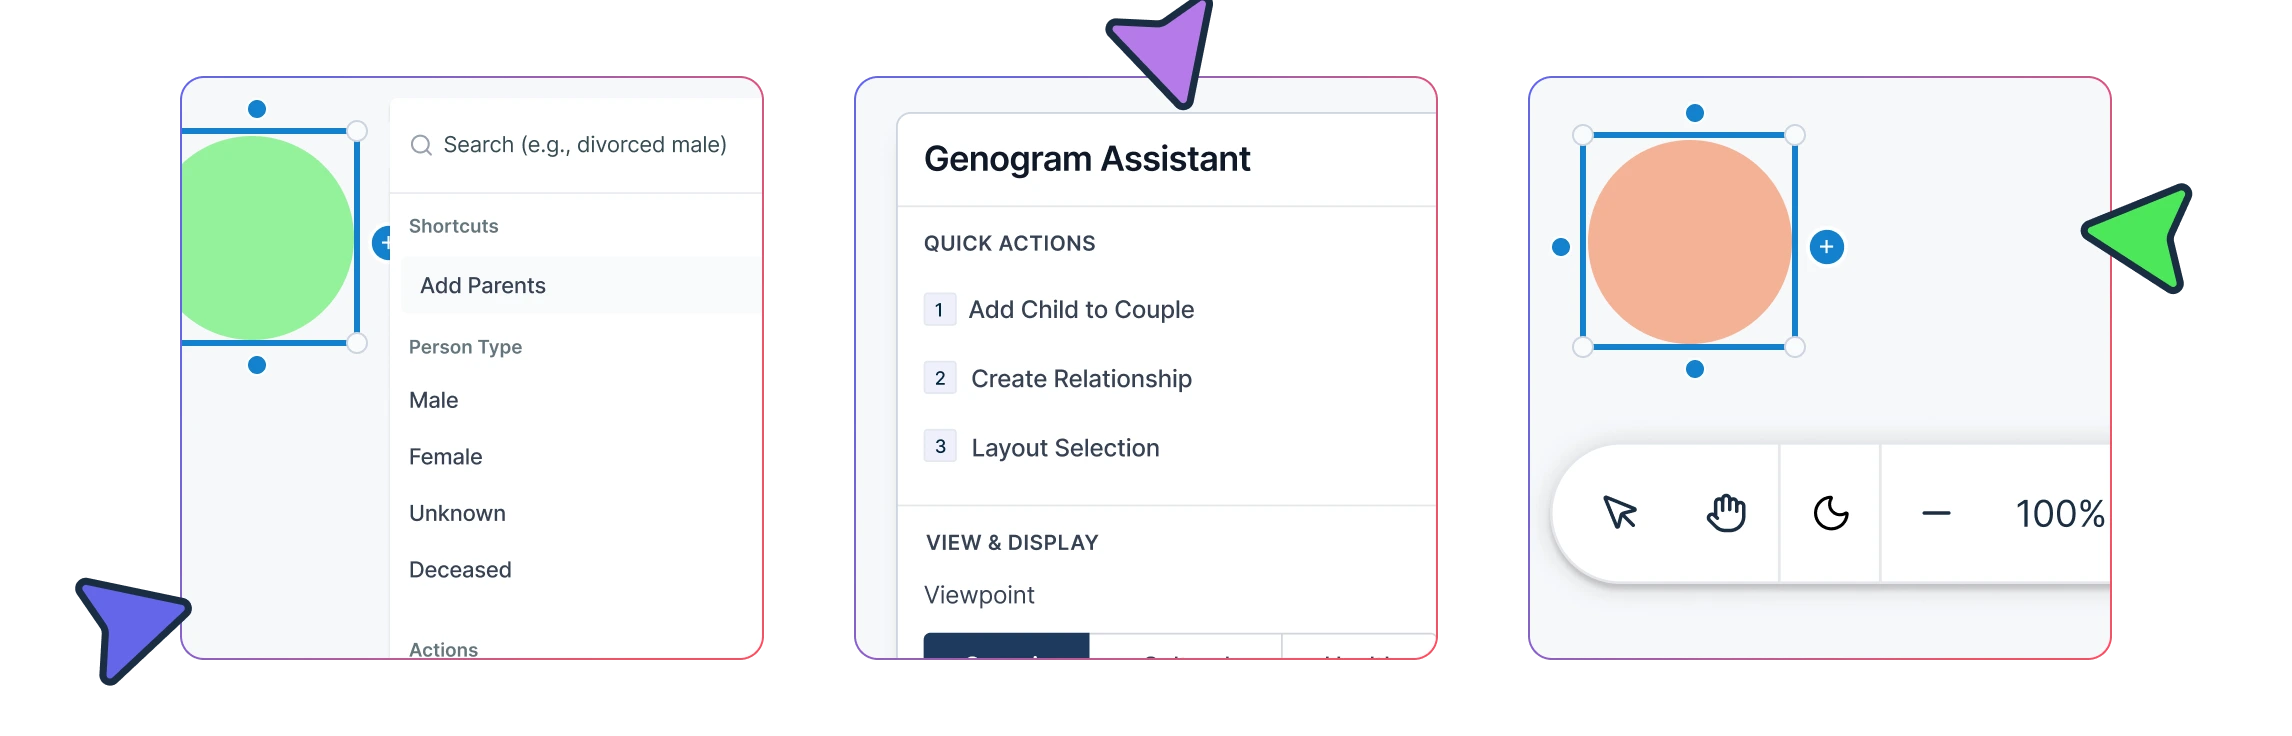
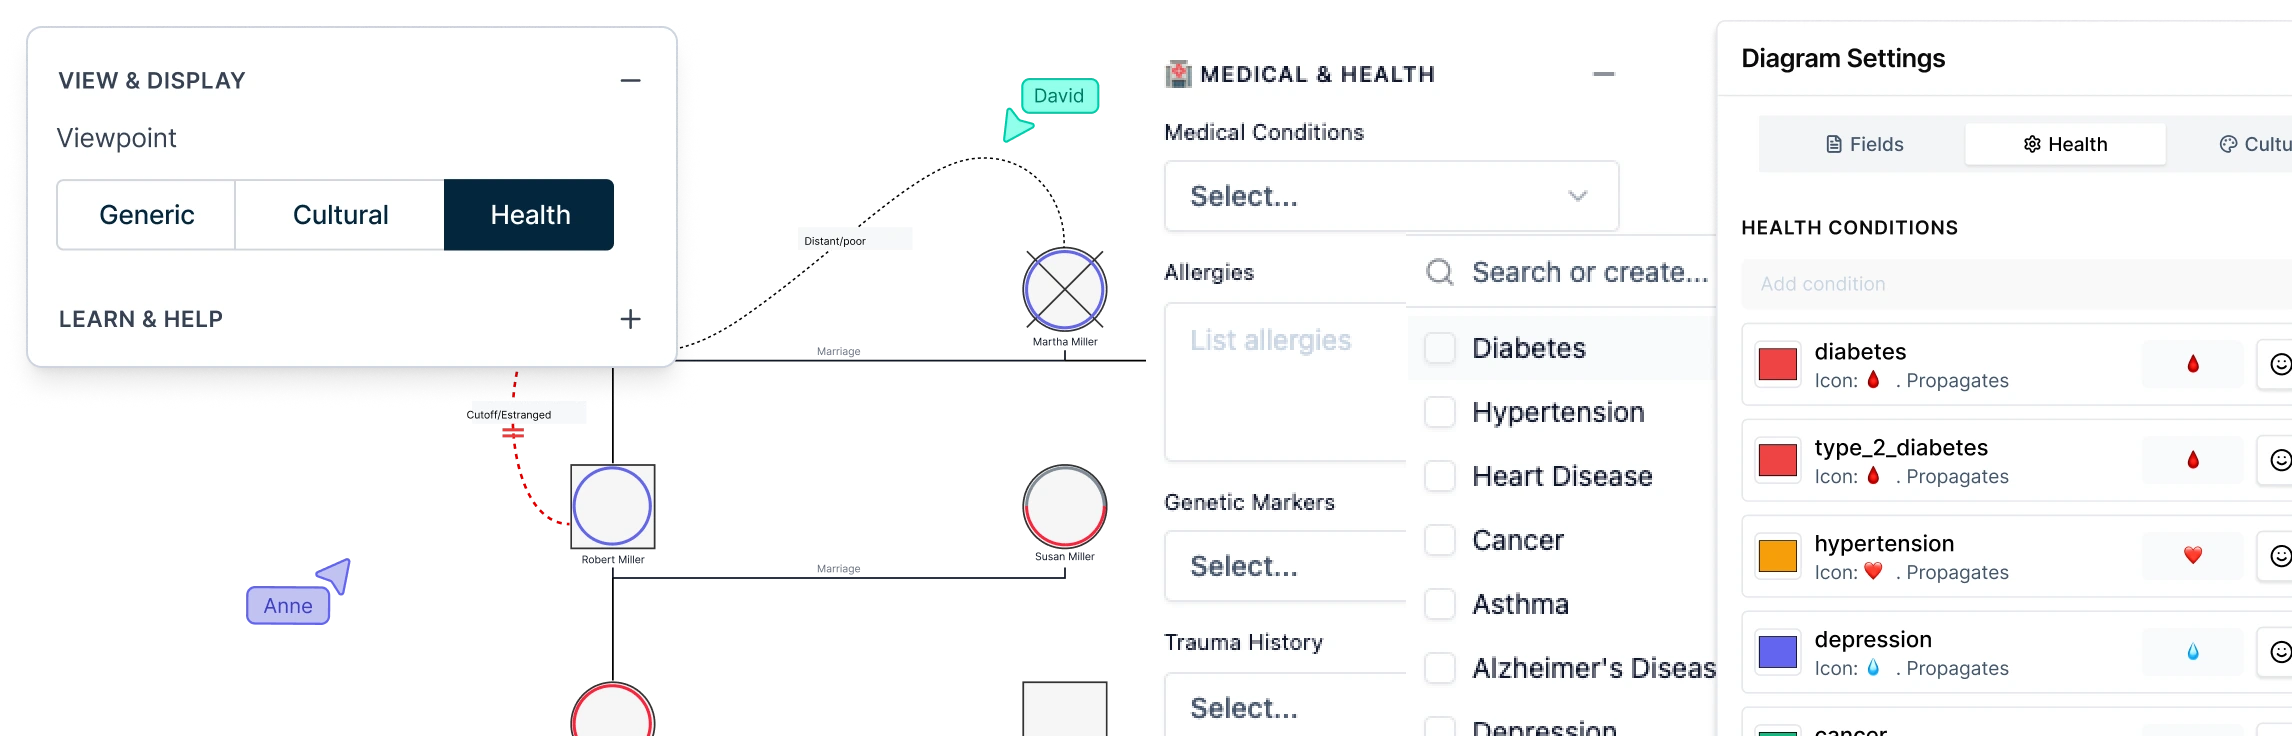
Once medical data has been added to the genogram, clinicians can activate Health View in seconds. Open the Viewpoint selector in the Genogram Assistant panel and choose Health View. The genogram will immediately update, highlighting individuals who share the same medical condition with the same color indicator so hereditary patterns become visible across the family structure.
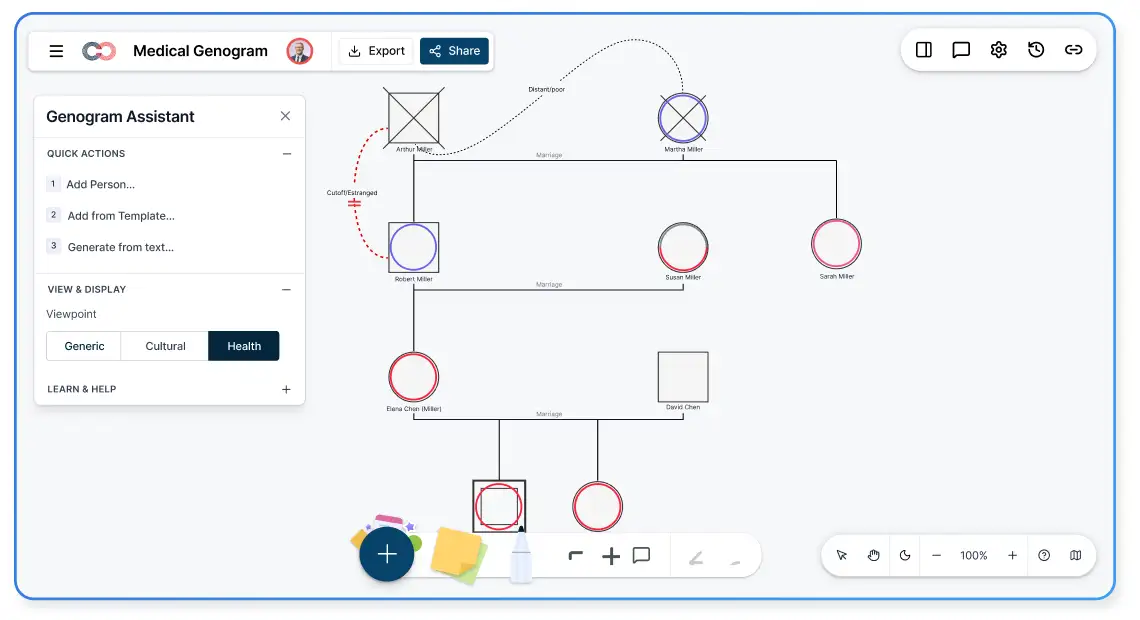
Once Health View is enabled, Creately’s medical genogram software lets clinicians scan the genogram to identify possible hereditary trends, recurring diseases, and generational risk factors without reviewing each individual’s medical record separately.
What Hereditary Patterns to Look For
The examples below show common hereditary patterns that may become visible when scanning the genogram in Health View mode. These visual indicators can suggest hereditary trends, but they should always be interpreted alongside detailed family history, clinical diagnosis, and genetic testing results.
Vertical Pattern (Generation-to-Generation)
A health condition appears across consecutive generations, such as grandparents, parents, and children. This pattern may suggest a dominant hereditary condition where a trait is passed from parent to child across generations.
Cluster Pattern (Same Generation)
Several individuals within the same generation, often siblings, share the same condition. This clustering may indicate a recessive genetic disorder or shared environmental factors.
Branch Pattern (One Side of the Family)
A health condition appears primarily in either the maternal or paternal branch of the family tree. This pattern may suggest inherited risk associated with one lineage and can prompt further genetic or clinical review.
Gender-Specific Pattern
A condition occurs predominantly in one gender across several generations. This pattern can indicate possible sex-linked inheritance patterns, such as conditions linked to the X chromosome, but requires further genetic evaluation to confirm.
Migration or Environmental Cluster
Relatives living in the same geographic area show a similar health condition. While not purely hereditary, this pattern can indicate environmental or lifestyle factors interacting with genetic predispositions.
Mortality Pattern
Several family members have a similar cause of death, particularly at comparable ages. This pattern may suggest an underlying hereditary disease risk and can help prompt further clinical review or genetic screening.
Understanding these patterns helps clinicians review family health history more efficiently and identify potential hereditary risks earlier. Creately’s genetic counseling genogram software supports this process by helping clinicians map medical histories, highlight hereditary patterns visually, and prepare for genetic counseling or hereditary risk assessment with greater clarity.
How to Use Health View Mode for Pre-Visit Review and Genetic Counseling Preparation
Health View is especially useful during pre-visit review before meeting a patient or family. Instead of studying medical notes line by line, clinicians can review hereditary patterns visually and prepare focused questions for the consultation. A typical workflow using health genogram view may look like this:
Step 1: Create or Import the Genogram
Build the family medical history diagram using:
- Patient interviews.
- Intake forms.
- Existing medical records.
- AI text-to-genogram generation from written family histories or intake notes.
Step 2: Add Medical Data
Record health conditions, and related medical information using the Medical & Health field pack.
Step 3: Activate Health View
Switch the genogram to Health View to highlight medical conditions across the family structure.
Step 4: Review Possible Hereditary Risk Patterns
Scan the diagram for:
- Recurring conditions.
- Generational patterns.
- Disease clusters within branches of the family.
Step 5: Prepare Clinical Questions
The visual overview can help clinicians prepare targeted questions such as:
- At what age were relatives diagnosed?
- Have family members undergone genetic screening?
- Are there environmental or lifestyle risk factors that may influence disease development?
This approach allows healthcare teams to enter the consultation already aware of possible hereditary risk patterns.
How AI Pattern Detection Can Support Your Review
Creately AI can assist genetic counselors by analyzing clinical genogram data to highlight patterns that may require closer review. By examining the medical information recorded in the genogram, the system can surface trends that may be harder to detect when reviewing family history manually.
Creately AI supports review in two key ways:
Pattern detection helps surface recurring medical conditions across generations that may suggest hereditary disease patterns or clusters within specific branches of the family.
Relationship suggestions can flag structural gaps in the genogram, such as unconnected parents or missing sibling relationships, helping ensure the family structure is complete before clinical interpretation.
These insights support clinical review but do not replace professional judgment. Instead, they help clinicians explore potential genetic risks more efficiently during family history analysis, genetic counseling preparation, and hereditary risk assessment.
By combining AI-assisted pattern detection with genogram Health View mode and medical genogram color coding, clinicians can identify hereditary disease patterns faster and interpret family health history more efficiently during genetic counseling, clinical review, and hereditary risk assessment.
Free Medical Genogram Templates with Health View


Helpful Resources for Making Genograms in Healthcare
Discover ready-made genogram template examples for clinical-grade applications.
Learn about genogram symbols, relationships, and how to use them in making genograms.
Learn how to use genogram keyboard shortcuts to speed up your genogram creation while talking to your clients.
FAQs on Using Genogram Health View Mode
What types of health information can be visualized in the health view mode?
Can health visualization mode show multiple health conditions in a family?
When should clinicians use health genogram view during patient care
- Patient intake or family history review.
- Genetic counseling sessions.
- Preventive health assessments.
- Cancer risk assessment.
- Pre-visit clinical preparation.