Trauma can affect individuals, families, and entire communities—shaping relationships, behaviors, and emotional well-being across generations. Understanding how trauma is passed down or shared helps professionals design more effective pathways for healing and recovery. Trauma mapping offers a visual way to trace these emotional and psychological patterns, and when combined with genograms, it becomes a powerful tool for identifying connections between experiences, stress responses, and resilience over time.
This guide explores how to use genograms for trauma mapping, helping professionals, educators, and community workers better understand trauma dynamics and support long-term healing.
What Is Trauma Mapping
Trauma mapping is a method used to visually understand how trauma affects individuals, families, and communities. It helps reveal how experiences of stress, loss, conflict, or emotional pain connect across relationships and generations. By mapping these patterns, professionals can identify who may need support, recognize sources of resilience, and design more effective healing interventions.
The process involves collecting information through interviews, observations, and case histories, then visualizing it using diagrams or mapping tools. This can be done with simple sketches on paper or with digital platforms that make it easier to organize, share, and analyze trauma data collaboratively.
Genograms as a Tool for Trauma Mapping
A genogram is similar to a family tree, but it goes beyond listing relationships. It captures emotional connections, patterns of behavior, and significant life events that shape how families function. When used for trauma mapping, genograms help visualize how experiences like loss, conflict, abuse, or major life stressors affect individuals and ripple through generations.
| Aspect | Trauma Mapping Goal | How Genograms Help |
| Generational trauma | Understand how trauma such as loss, abuse, or chronic stress passes through families | Visually trace repeating trauma patterns across generations |
| Attachment and relational patterns | Identify how past experiences affect trust, communication, and intimacy | Use emotional connection lines to map closeness, conflict, or distance |
| Coping strategies and resilience | Recognize inherited coping mechanisms and resilience patterns | Map adaptive vs. maladaptive responses; highlight sources of emotional strength |
| Social and cultural context | See how systemic factors or cultural expectations influence trauma | Add contextual notes or layers for cultural norms, oppression, or historical trauma |
| Therapeutic guidance | Support targeted interventions and client insight over time | Update the genogram as therapy progresses to track growth and healing |


Preparing for Trauma Mapping
Before creating a trauma map, it’s important to prepare carefully so the process is accurate, ethical, and sensitive to those involved.
Data collection
Information is often gathered through conversations, interviews, or case histories. The key is to listen with empathy and record experiences, relationships, and coping patterns without causing distress. It’s not just about collecting facts—it’s about understanding emotions and connections.
Consent and cultural sensitivity
Because trauma is deeply personal, always obtain informed consent before starting. People should understand how their information will be used and have the right to opt out. It’s also essential to respect cultural beliefs, privacy, and community values when interpreting trauma and relationships.
Choosing tools
Trauma mapping can be done with simple options like paper and whiteboards, but digital tools make it easier to create, share, and update maps. Creately, for example, offers ready-made genogram templates, a complete genogram symbol library, and an infinite canvas and intuitive drawing tools for mapping complex relationships. It also supports real-time collaboration, notes, and secure sharing—features that are especially helpful when multiple professionals or community members are involved.
Steps for Using Genograms for Trauma Mapping
Step 1. Define the scope
Decide what you’re mapping — a single family, several connected families, or a broader community network.
Include key members such as:
Parents and children
Grandparents and siblings
Anyone central to the family’s emotional or support system
Step 2: Collect trauma-related information
Gather data from interviews, conversations, or case records. Focus on:
Significant life events (loss, illness, separation, abuse)
Emotional or behavioral responses (anxiety, depression, coping behaviors)
Always obtain consent and handle personal information with care.
Creately tip: Attach notes and comments to each family member symbol, keeping track of important data safely and in an organized way. You can also embed additional details on the workspace itself or add them as attachments directly to the shape.
Step 3: Build the basic family structure
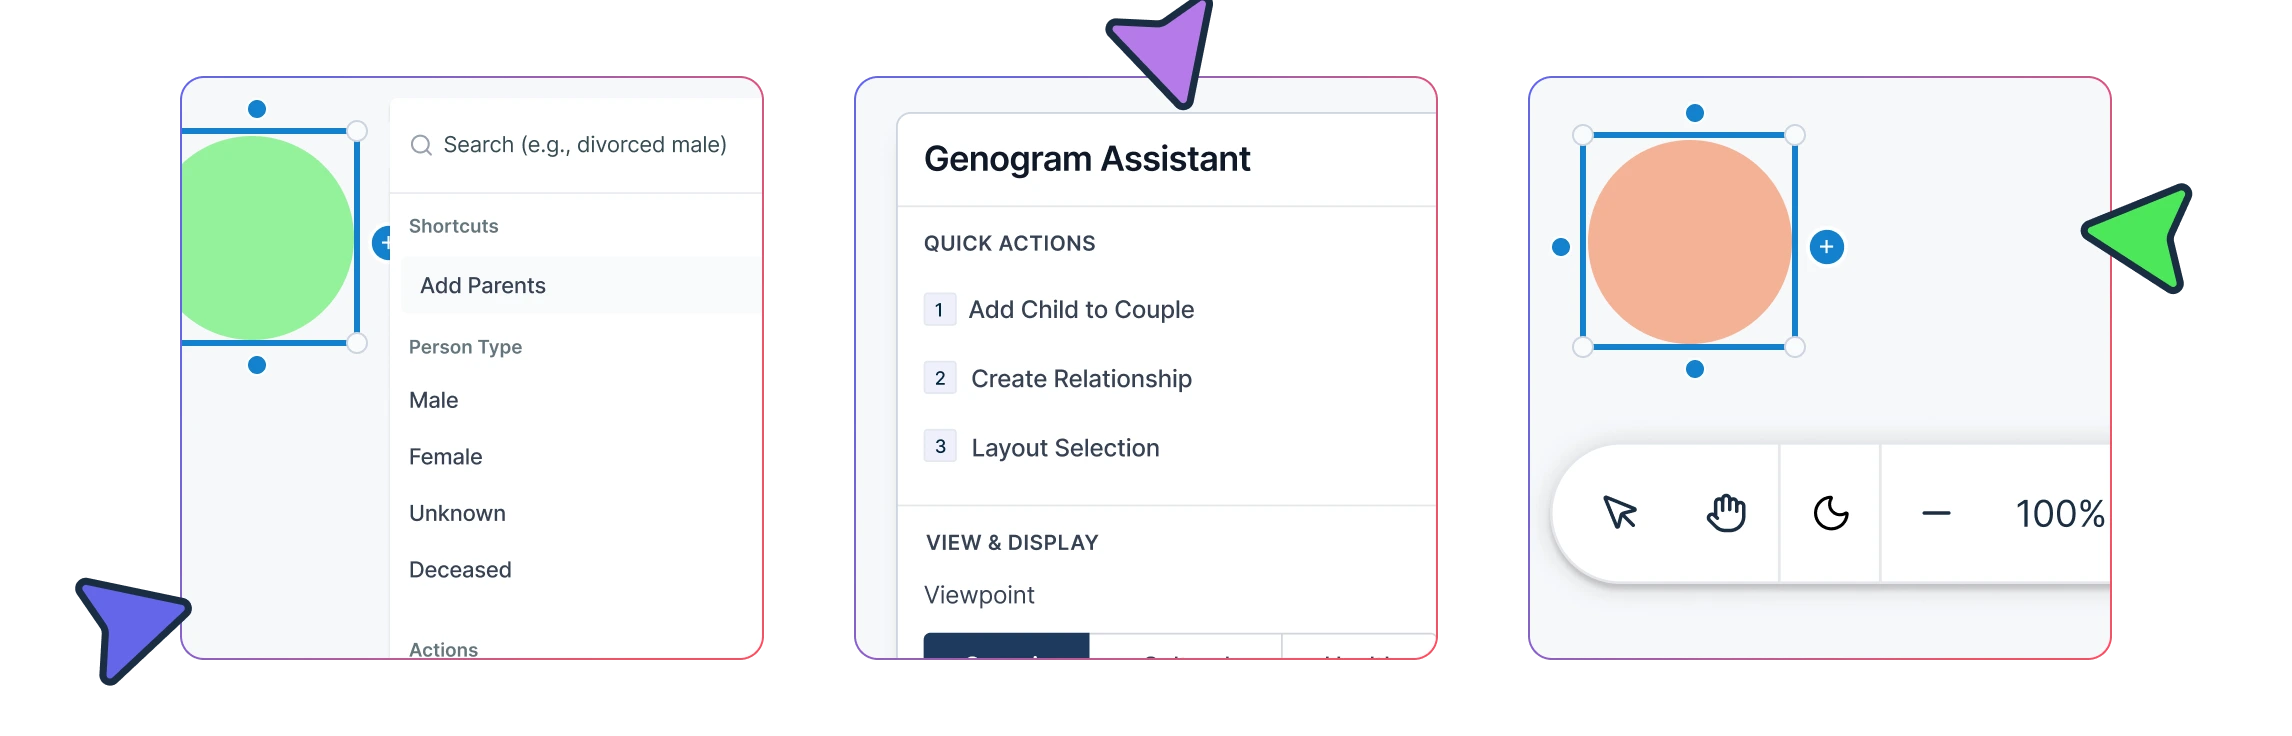
Draw family members using standard genogram symbols — squares for males, circles for females.
Connect them with:
Horizontal lines for marriages or partnerships
Vertical lines for children
Arrange generations from top (older) to bottom (younger) for clarity.
Creately tip: Start with a pre-made genogram template or you can drag and drop symbols from the library to draw the genogram from scratch. With the quick toolbar, you can set the relationship type between family members with a single click.
Step 4: Add trauma indicators
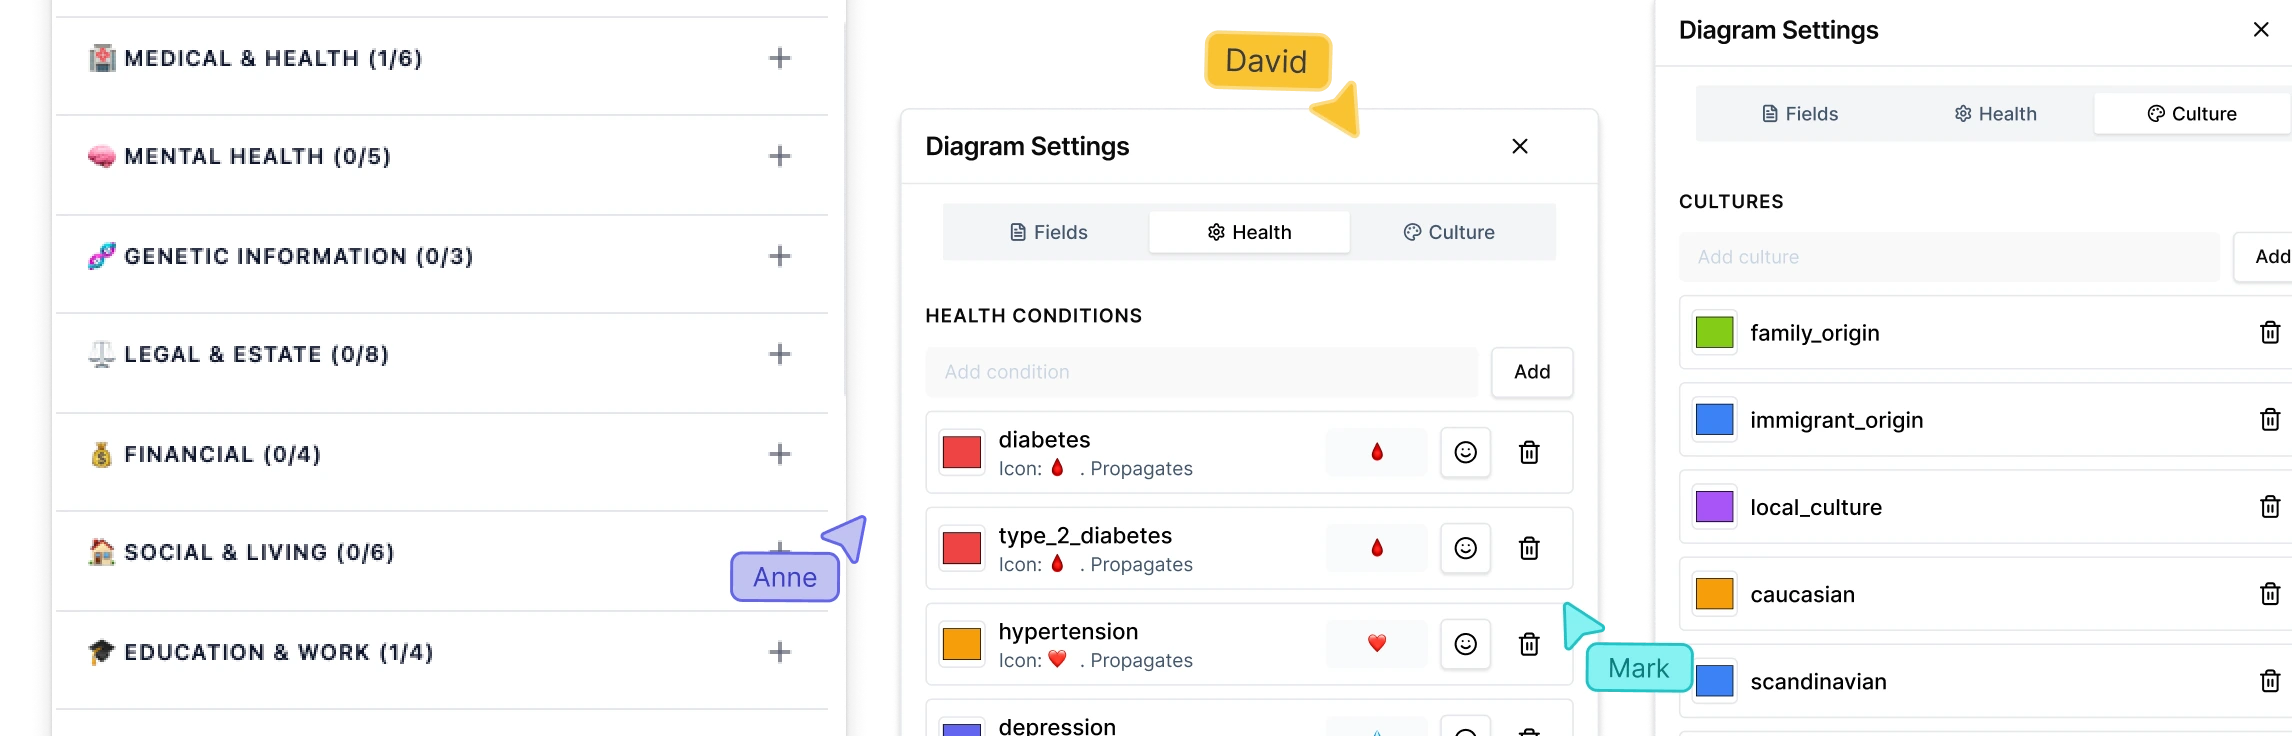
Mark each person’s trauma-related experiences using visual cues:
- Colors or icons for emotional distress, illness, or strengths
- Lines or notes for major events like separation, violence, or loss
Creately tip: Use customizable shapes, colors, built-in icons, and labels to visually highlight different types of trauma clearly.
Step 5: Map relationships and conflicts
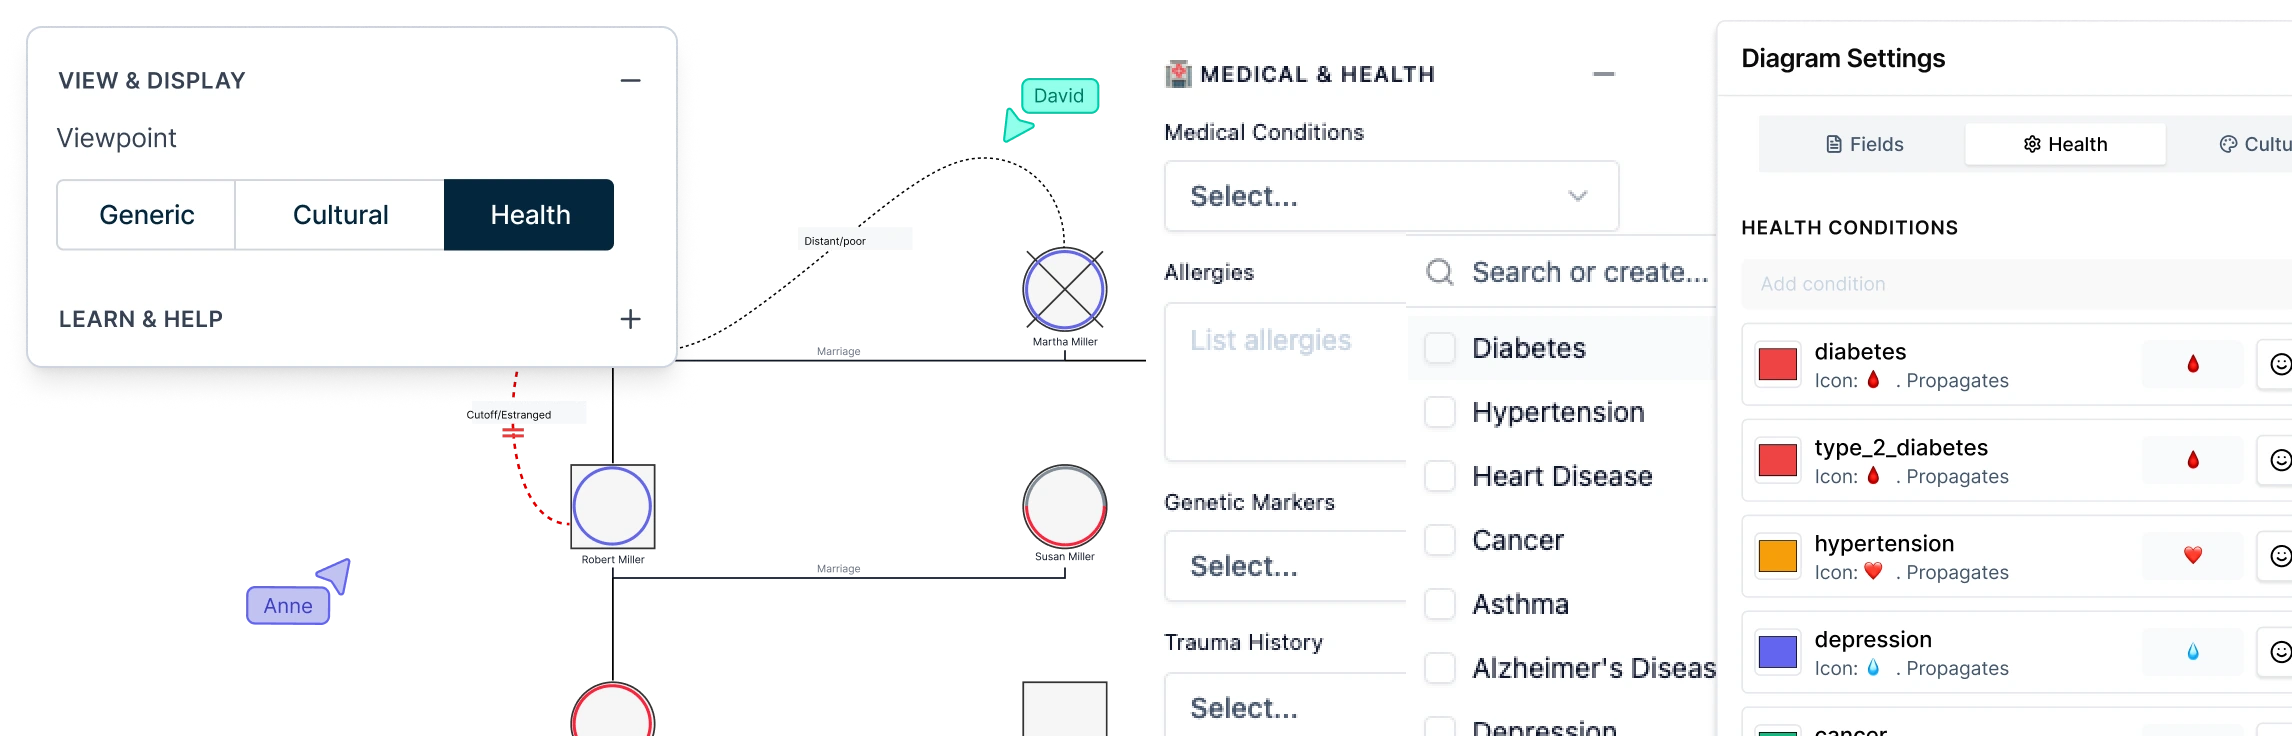
Represent how individuals relate and respond to one another — a key part of trauma mapping. Use different connectors to show relationship quality:
Zigzag or red lines for conflict or abuse
Dotted lines for emotional distance
Double lines for closeness or dependency
Broken lines for separation or cutoff
Creately tip: Connector types and color coding to represent these differences, making patterns easy to see at a glance. You can also add notes for each connector or family member, further explaining the context.
Step 6: Include support systems
Add extended family, friends, community groups, or local organizations that provide support. Use different colors or lines to distinguish supportive relationships from strained or absent ones. This helps identify sources of resilience as well as areas of vulnerability.
Step 7: Identify patterns and analyze
Look for recurring trauma themes like:
Intergenerational trauma
Repeated losses or conflicts
Patterns of coping or avoidance
Spot individuals needing urgent support and those showing resilience who could help others.
Step 8: Add contextual factors
Include broader influences like economic hardship, social stigma, or cultural expectations that may impact how families cope with trauma. This provides a fuller picture of the emotional ecosystem surrounding the family.
Creately tip: Creately’s infinite canvas and collaboration features make it easy to add this broader context without cluttering the family structure, and multiple professionals can work together in real time to enrich the map.
Step 9: Share and plan interventions
Once complete, use the trauma-informed genogram to guide conversations, therapy plans, or community support programs. Determine who needs immediate care, where resilience can be strengthened, and what external resources might help.
Creately tip: Creately allows you to export diagrams in PDF, PNG, or SVG formats, or share them online with other professionals or community stakeholders, ensuring the insights are actionable.
Genogram Examples for Trauma Mapping
1. Loss and bereavement trauma genogram example
Shows how the death of a family member affects emotional well-being across generations. Highlights grief responses in parents and children, coping patterns, and sources of support from extended family.

2. Generational trauma genogram after civil conflict
Visualizes trauma passed through multiple generations, such as PTSD, anxiety, or coping behaviors. Shows how past events influence family dynamics, resilience, and conflict patterns.

3. Genogram example for sibling conflict
This trauma genogram template maps tensions, rivalries, and emotional stress among siblings, along with the impact on parents and other family members. Highlights coping strategies and support structures within the family.

4. Disaster trauma genogram example
This family trauma genogram iIllustrates how traumatic events affect individuals, families, and broader support networks. Highlights psychological stress, coping responses, and connections between family members and community resources.

5. Substance abuse and addiction genogram
This trauma genogram example tracks patterns of substance use and addiction across generations. Shows affected family members, enabling factors, conflict lines, and sources of support for recovery.

6. Mental health genogram
Maps mental health conditions such as anxiety, depression, or bipolar disorder within a family. Includes emotional patterns, treatment histories, coping strategies, and supportive relationships.

7. High-conflict financial genogram
This integenerational trauma genogram visualizes how financial stress and disputes influence family dynamics. Shows conflict lines, strained relationships, and potential support systems for resolving economic and emotional challenges.

8. Group counselling genogram
Represents participants in group therapy or support programs, their relationships, shared trauma, and patterns of interaction. Helps identify group dynamics, peer support, and potential triggers.

Analyzing Trauma Patterns
Interpreting patterns
Examine the genogram for recurring issues such as intergenerational trauma, repeated losses, sibling conflicts, or strained parent-child relationships. These patterns reveal how trauma affects families over time and also highlight sources of resilience, like supportive members or strong connections.
Assessing impact on mental health
Genograms can help show how trauma influences emotional and psychological well-being. Look for signs such as stress, anxiety, depression, or differing coping strategies among family members. This helps identify who is most affected and how trauma may move through generations.
Identifying support needs
Use the genogram to pinpoint individuals who need immediate care and those who can provide support. This guides interventions such as counseling, family or community support, and connecting with social services. A visual map ensures that support is targeted, informed, and effective.
Applying Genogram Findings to Intervention
Informing intervention strategies
Genograms reveal which family members or groups are most affected by transgenerational trauma and where support may be lacking. Tools like The Transgenerational Trauma and Resilience Genogram (TTRG), created by Rachael D. Goodman, PhD, LPC, specifically assess and address the complex relationship between trauma and resilience in families. Using these insights, professionals can design targeted interventions such as counseling, therapy, mentoring, or educational programs, ensuring resources reach those who need them most.
Community-based approaches
Trauma recovery is more effective when the wider community is involved. Genogram data can help identify local support networks, mentors, and informal resources. Engaging these groups strengthens collective resilience and ensures interventions are culturally appropriate and widely accepted.
Policy implications
Patterns uncovered through genograms can inform policies and programs related to mental health, social support, and community well-being. Insights about intergenerational trauma or gaps in care may guide decisions on counseling services, social programs, or community initiatives. Policymakers and organizations can use this data to create more responsive, evidence-based support systems.
References
Goodman, R. D. (2013). The transgenerational trauma and resilience genogram. Counselling Psychology Quarterly, 26(3-4), 386–405. https://doi.org/10.1080/09515070.2013.820172
FAQs About Genograms in Trauma Mapping
What are the challenges of using genograms for trauma mapping?
Are there special symbols for trauma genograms?
What is a scripto-trauma genogram?
Can genograms capture community-level trauma, not just families?
What are the key elements of a genogram?
How can digital tools like Creately help in trauma mapping?