Understanding how a system behaves under different conditions is key to designing reliable software, and that’s where state diagrams come in. This guide will walk you through what a UML state diagram is, why it’s important in modeling system behavior, and how to create one effectively. You’ll learn about its core components, see examples of real-world applications, and explore best practices to capture the dynamic flow of your system.
State Diagram Definition
A state diagram (also known as a state machine diagram and state chart diagram) maps out the state transitions an object undergoes in response to external or internal events. It plays a vital role in UML system modeling by visualizing dynamic behavior, showing not just what states exist, but also how and why transitions between them occur. State machine diagrams fall under the behavioral branch of UML diagram types which help model different aspects of a system’s behavior, making them an essential part of comprehensive system design.
Read the what is a UML diagram guide for more on the different types of UML diagrams, their benefits, and when to use them.
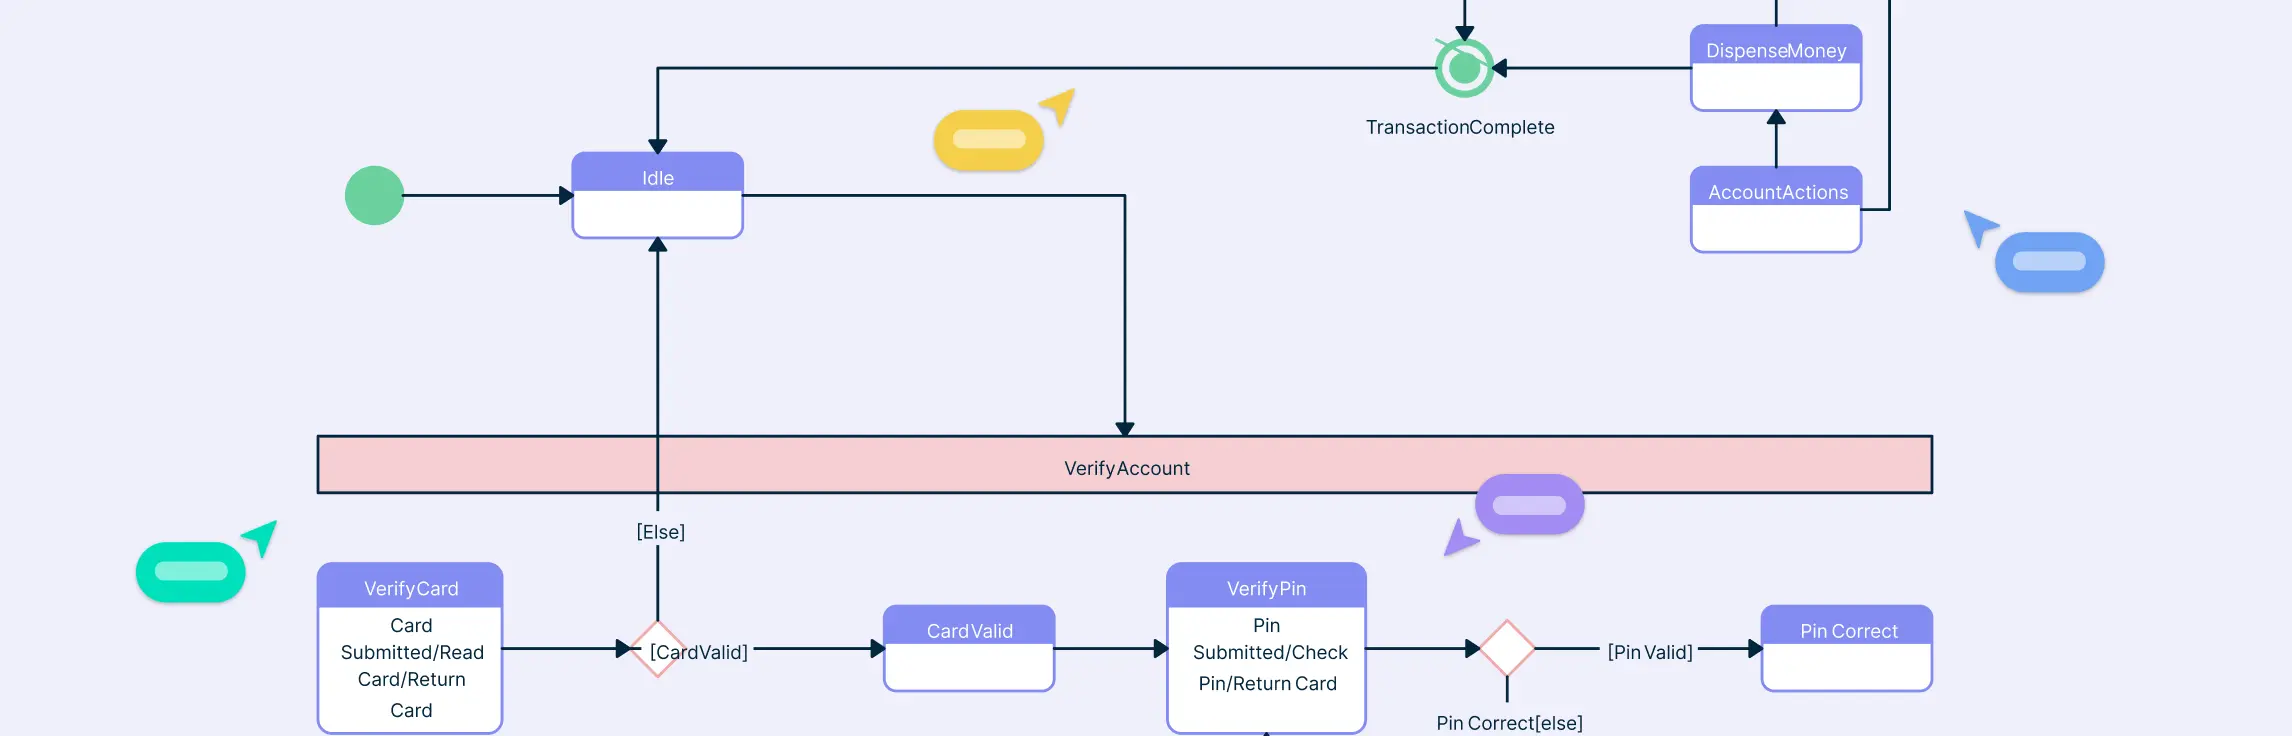
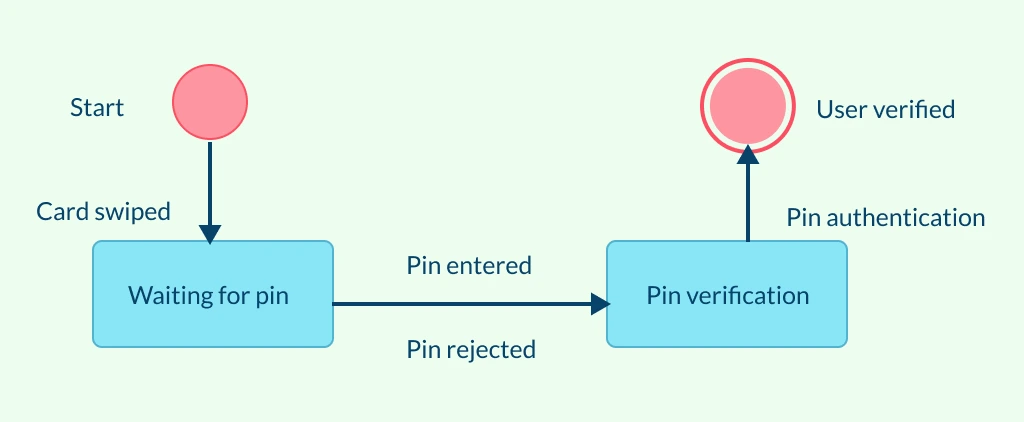
A state machine diagram example for user verification:
Purpose for Making State Machine Diagrams
Visualize object behavior — Show the lifecycle of an object from creation to destruction through different states.
Clarify system logic — Illustrate how and when transitions occur, helping identify missing or invalid states.
Model event-driven systems — Represent how software, embedded systems, or UI components respond to user actions or signals.
Support design and debugging — Simplify complex workflows, making it easier for developers, testers, and analysts to verify correct behavior.
Improve communication — Provide a shared visual reference for teams to understand system behavior across design, development, and testing stages.
UML State Diagram Symbols and Notations
Understanding the symbols and notations in a state machine diagram is crucial for accurately representing the dynamic behaviors of systems. These visual elements are the building blocks that convey the operational flow and transitions within a system. Let’s delve into the common symbols and their significance in state diagrams.
States
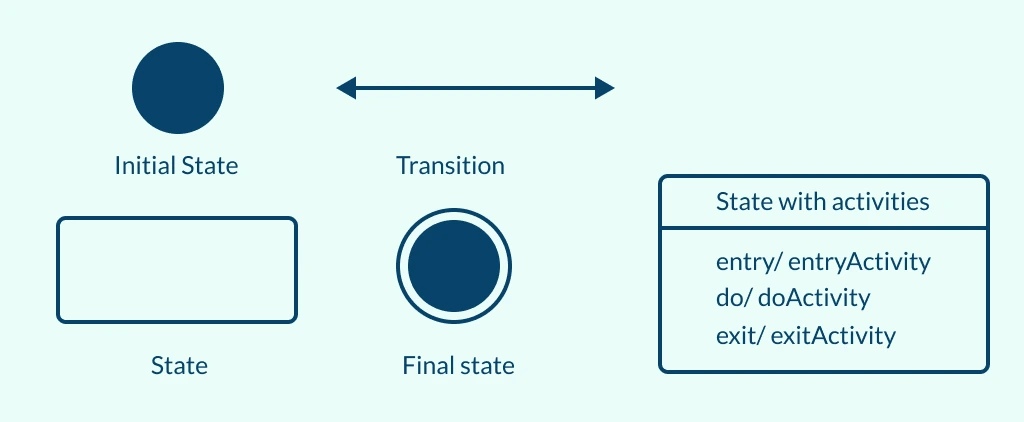
Represented by rounded rectangles, states depict different conditions of an object during its lifecycle. Each state reflects a specific situation in which the object performs certain actions or awaits particular events. Some states may also include activities, which describe what happens while the system remains in that state.
- Entry activities: Actions performed immediately upon entering a state (e.g., initializing variables or displaying a message).
- Do activities: Continuous actions that occur while the object stays in the state (e.g., processing data or monitoring inputs).
- Exit activities: Actions executed when the state is exited (e.g., saving data or resetting parameters).
Transitions
Arrows indicate transitions from one state to another, showing how the system moves between states. The direction of the arrow points from the source state to the destination state, often accompanied by a label that specifies the event or condition triggering the change. Transitions help visualize the flow and logic of state progression.
Guard Conditions
A guard condition is a Boolean expression that must be true for a transition to occur. It’s evaluated immediately after the triggering event. Guard conditions prevent unintended transitions and allow multiple possible paths from the same source state based on specific criteria. They are written inside square brackets [ ] placed along a transition arrow.
Actions
An action is an atomic computation performed as part of a transition or state activity. For example, during a transition triggered by “Submit Order,” an action might be “validate payment.” While actions happen instantly, activities may continue over time within a state. Actions are written after a forward slash ( / ) following the event or trigger on the transition arrow.
Events
Labeled along the transitions, events are specific triggers that cause a change from one state to another. They are crucial for understanding what initiates each transition and for modeling how the system responds dynamically to inputs or external factors. Common types of events include,
- User actions: Inputs such as clicking a button, entering data, or submitting a form.
- System signals: Internal triggers like receiving a message, completing a process, or encountering an error.
- Time-based events: Triggers that occur after a specific duration or at scheduled intervals (e.g., timeouts).
- External inputs: Events originating from outside systems or sensors, such as a hardware signal or API response.
Initial and Final States
An initial state, shown as a solid circle, marks the starting point of the state machine, and represents the system’s entry condition before any event occurs. Conversely, a final state, depicted as a circle with a double border, indicates where the process or object lifecycle terminates, signifying the completion of the system’s behavior flow.
How to Draw a State Diagram
You can easily create detailed, professional state machine diagrams using Creately’s state diagram maker, which offers ready-made UML templates, smart connectors, and an intuitive drag-and-drop interface. Follow these steps to draw a state diagram effectively.
Step 1. Identify the Object or System to Model
Begin by defining the object, process, or component whose behavior you want to represent. For example, this could be a login session, an order process, or a traffic light system. You can start by selecting one of the ready-made state chart templates and customize it to match your scenario.
Step 2. Define the Possible States
List all the meaningful conditions or modes the object can occupy throughout its lifecycle. Each state should describe a specific situation where the system performs an action or waits for an event. Use rounded rectangle shapes from the UML library to represent states. You can also customize colors and labels to distinguish between active, idle, or error states.
Step 3. Add the Initial and Final States
Mark where the process begins and ends. The initial state is shown as a filled circle, while the final state is depicted as a double-bordered circle. Use built-in UML start and end symbols available in the shape library.
Step 4. Map the Transitions Between States
Draw arrows to represent transitions that show how the system moves from one state to another when specific conditions or events occur. Use Creately’s smart connectors that automatically snap to states and maintain alignment as you move elements. Add labels along the connectors to describe the triggering events or conditions.
Step 5. Label Events and Actions
Each transition should clearly describe the event that triggers the movement between states, and optionally, the action that results. Double-click connectors to add event labels, or use inline text formatting for consistency. The auto-alignment guides help keep your diagram clean and readable.
Step 6. Refine and Validate the Diagram
Review the flow to ensure all possible states and transitions are covered. Eliminate redundant states and check that there are no unintentional loops or missing end conditions. Collaborate with your team in real-time using commenting and sharing features. You can export the final diagram as an image, PDF, or embed it directly into project documentation.
Practical Applications of State Diagrams
UML state diagrams are not just theoretical constructs; they have practical applications across various industries and scenarios. By visualizing the states and transitions of system components, these diagrams provide a clear framework for understanding complex system behaviors. Here are some key applications.
Modeling Object Behavior
A state diagram in software engineering is used to represent how objects change state in response to events throughout their lifecycle. They help developers visualize the internal logic driving these transitions and the external inputs that trigger them, ensuring that system behavior remains predictable and reliable.
Designing Interactive Systems
In user interface and event-driven applications, state machine diagrams map out how systems respond to user actions or external signals. This makes them useful for defining workflows like login states, form validations, or navigation processes.
Embedded and Control Systems
UML state diagrams are essential in embedded systems such as traffic controllers, vending machines, or industrial automation, where precise responses to sensor inputs and timed events are required. They help visualize control logic and ensure correct sequencing of operations.
Business Process Modeling
Organizations use state machine diagrams to represent the flow of processes such as order management, approvals, or ticket handling. They show how each case or request moves from one stage to another based on conditions or decisions.
Testing and Debugging
By clearly outlining possible states and transitions, state machine diagrams assist testers in identifying edge cases, unreachable states, or incorrect transitions. This improves test coverage and helps ensure system reliability.
Educational and Analytical Use
In academic and analytical contexts, UML state diagrams help learners and analysts understand complex dynamic systems through visual representation. They make it easier to grasp cause-and-effect relationships and system dependencies.
Differences Between Activity Diagrams and State Machine Diagrams
While both activity diagrams and state diagrams fall under the behavioral category of UML diagrams, they serve different purposes and are suited to different aspects of system modeling. Read the activity diagram tutorial to learn more about them, and how to draw these diagrams.
Feature | Activity Diagram | State Diagram |
Focus | Flow of activities | Object's states and transitions |
Best Used For | Sequence of actions and conditions | Object's behavior in response to events |
Ideal When | Understanding complex processes | Understanding event-driven systems |
Choosing the Right One | Need to map process steps or sequence of actions | Need to understand state changes triggered by events |
Complementary Use | Detailing process flow alongside state changes | Illustrating system state transitions within a process |
Differences Between the State Diagram and Flowchart
While both state diagrams and flowcharts depict system behavior and control flow, they serve different purposes and are suited to different aspects of modeling. Read the ultimate flowchart tutorial to learn more about what flowcharts are, their benefits, and how to draw them.
Aspect | State Diagram | Flowchart |
Primary Focus | Focuses on states of an object and the transitions triggered by events. | Focuses on the flow of control or operations in a process. |
Purpose | Models the dynamic behavior of a system or object across its lifecycle. | Represents procedural workflows, logic sequences, or step-by-step processes. |
Used In | Common in software engineering, embedded systems, and protocol design, where responses depend on events. | Used in business process modeling, algorithm design, and decision-making workflows. |
Representation of Conditions | Conditions appear as transitions triggered by specific events or inputs. | Conditions are shown using decision nodes (like Yes/No branches). |
Level of Abstraction | Higher — describes object behavior over time. | Lower — depicts procedural control flow or execution sequence. |
Time Aspect | Shows how states evolve over time in response to events. | Focuses on logical progression without time dependency. |
State Diagram Examples and Templates


FAQs on UML State Diagrams
Can you generate a use case diagram from a state diagram?
Is a state transition diagram different from a state machine diagram?
What are the types of states in a UML state diagram?
Resources
Felderer, Michael, and Andrea Herrmann. “Comprehensibility of System Models during Test Design: A Controlled Experiment Comparing UML Activity Diagrams and State Machines.” Software Quality Journal, vol. 27, no. 1, 23 Apr. 2018, pp. 125–147, https://doi.org/10.1007/s11219-018-9407-9.
Rasch, Holger, and Heike Wehrheim. “Checking Consistency in UML Diagrams: Classes and State Machines.” Lecture Notes in Computer Science, 1 Jan. 2003, pp. 229–243, https://doi.org/10.1007/978-3-540-39958-2_16.