Ever struggled to make numbers or ideas instantly click with your audience? That’s where pictograms come in. Instead of overwhelming people with long tables or text, pictograms use simple icons and visuals to turn information into something clear and memorable. In this guide, you’ll learn how to make a pictograph step by step, explore ready-to-use templates, and discover best practices for creating designs that communicate with impact.
What Is a Pictogram?
A pictogram is a simple visual representation that uses icons or symbols to illustrate data, ideas, or concepts in an easy-to-understand way. Instead of relying on text or numbers alone, pictograms communicate information through universally recognizable visuals, making them useful in education, presentations, safety signs, and business reports.
How to Draw a Pictogram in 6 Easy Steps
Designing a pictograph map is about turning raw data into visuals that can be understood instantly. Follow these detailed steps to create a pictogram that is both accurate and engaging:
Step 1: Define Your Purpose
Before you start designing, ask yourself: What message am I trying to convey? A pictogram should focus on one clear idea, whether it’s showing survey results, explaining safety instructions, or visualizing business data. Defining your purpose ensures your pictogram remains focused and avoids unnecessary clutter.
Step 2: Collect and Organize Data
Pictographs simplify complex numbers, so make sure you’ve cleaned and organized your data before designing. For instance, if you’re visualizing “60% of employees prefer remote work,” decide whether you’ll represent this as 6 out of 10 icons or 60 out of 100. Keeping data units consistent is key to accuracy.
Step 3: Choose Pictogram Symbols/Icons
The power of a pictograph lies in its symbols. Choose icons that are universally recognizable; people, books, houses, or arrows, depending on your data context. Stick to simple, minimal designs that won’t distract from the numbers they represent. Tools with built-in icon libraries make this step faster and ensure consistency across your design.
Step 4: Design the Layout
This is where your pictogram starts to take shape. Align icons proportionally so that each represents a fixed unit of data (e.g., one icon = 5 students). Use grids or guides to keep everything aligned, and decide whether to stack icons in rows, clusters, or patterns depending on the story you want to tell. A well-structured layout makes comparisons intuitive at a glance.
Step 5: Customize and Finalize
Bring your pictochart to life with color coding, labels, and legends. For example, you might use blue icons for one category and green for another, while adding a brief text note to clarify the meaning. Keep the design minimal, avoid over-decorating with gradients or effects that may distract. At this stage, templates can save significant time, offering ready-made layouts you can tweak to fit your data.
Step 6: Review and Share
Step back and review your pictogram. Does it communicate the message without needing extra explanation? Test it with a colleague or teammate; if they can interpret it in seconds, your design is successful. Once finalized, share it digitally, embed it in reports, or collaborate with your team using an online pictograph maker that supports real-time editing.
Free Pictogram Templates You Can Use
If you want to save time and design professional visuals faster, starting with a pictogram template is the easiest option. Templates provide ready-made layouts with customizable icons, colors, and data units so you can focus on your message instead of building from scratch. Many online tools, including Creately, offer free pictogram templates you can edit and share with your team. Here are a few useful types:
Business Pictogram Template
Perfect for presentations, reports, or dashboards. Use it to highlight KPIs, survey results, or comparisons in a format that makes data stand out at a glance.


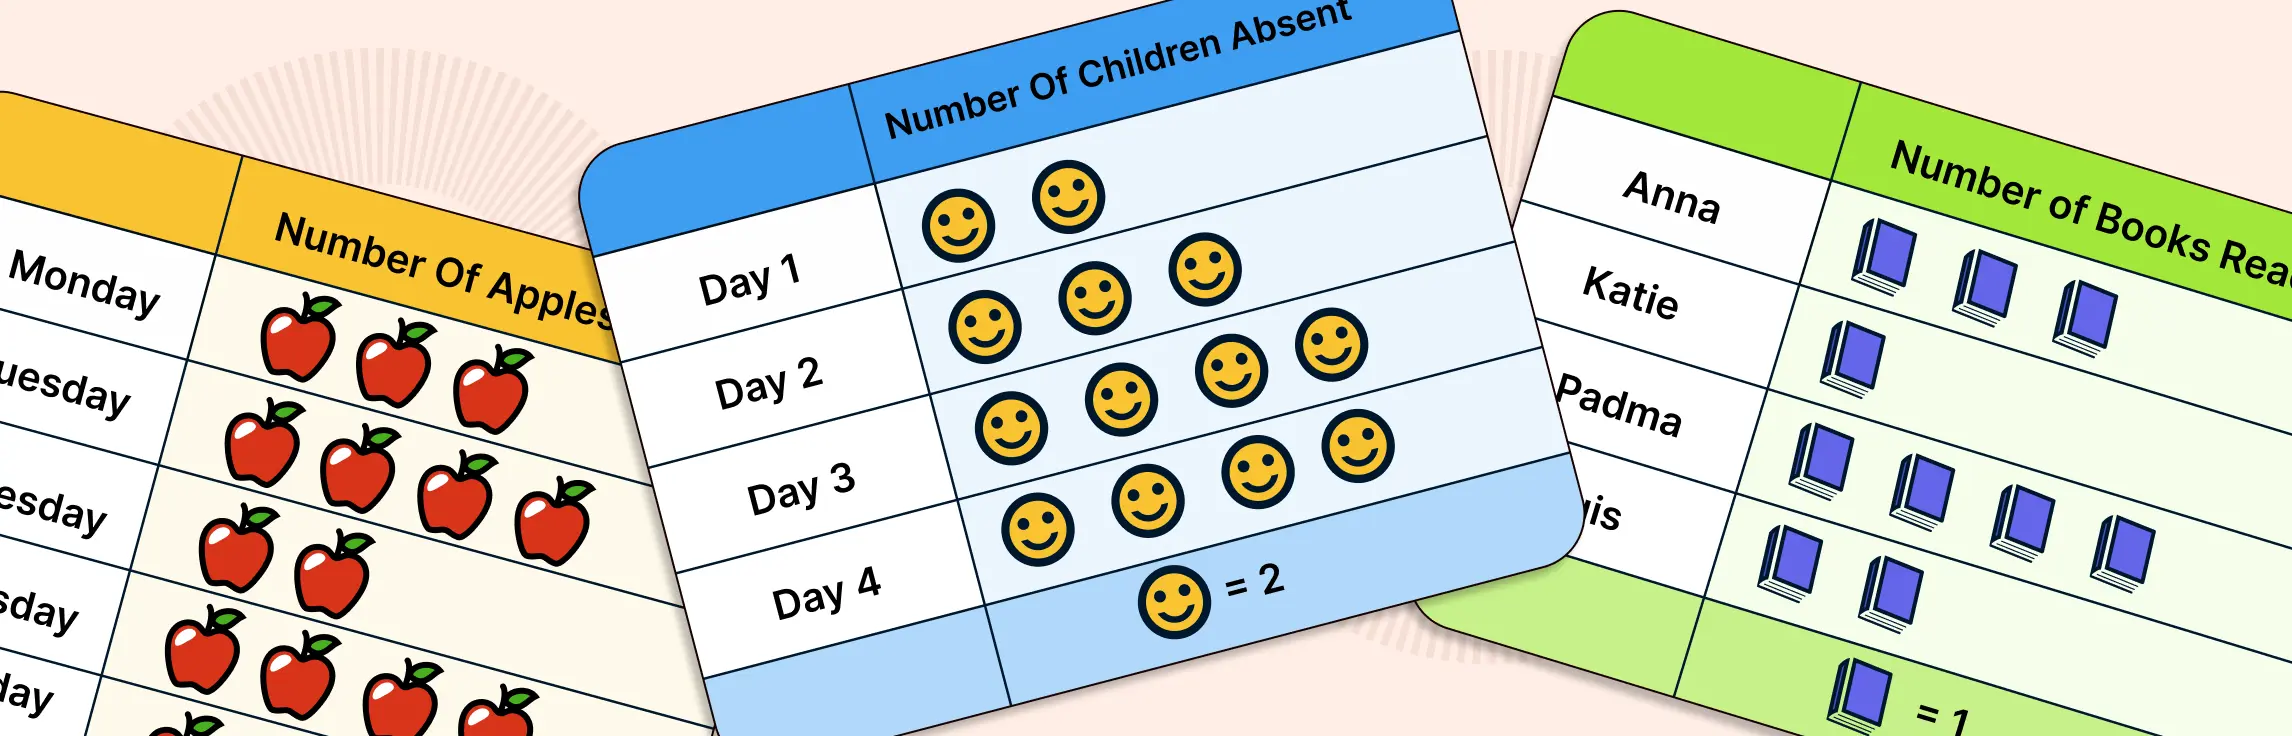
Education Pictogram Template
Ideal for teachers, students, and e-learning content creators. These templates simplify lessons, showing attendance, test results, or classroom activities in a visual, engaging way.

Data Visualization Pictogram Template
Great for turning raw numbers into clear, memorable charts. Whether you’re showing percentages, ratios, or large datasets, a pictogram chart template makes your data easy to interpret.

Infographic Pictogram Template
Designed for storytelling. Combine text and visuals to create compelling narratives for blogs, social media, or marketing campaigns. These templates help you balance data with design for maximum impact.

With customizable templates, you don’t have to start from zero; you can simply choose a layout, swap in your data, and adjust the icons to create a polished pictogram in minutes.
Best Practices for Designing Pictograms
A well-designed pictogram is clear, simple, and instantly understandable. Follow these best practices to make your pictograph design effective and professional:
- Keep icons simple and universally understood: Choose clear, recognizable symbols that can be easily interpreted across cultures and audiences.
- Use consistent sizing and spacing: Align your icons neatly and keep proportions consistent to avoid misrepresenting the data.
- Avoid overloading with too many icons: Limit the number of icons you display; too many can overwhelm viewers and reduce clarity.
- Stick to 2-3 colors for clarity: Use color sparingly to highlight categories or comparisons. Overuse of colors can distract from the message.
- Always provide context with labels or a legend: Even the simplest pictograms benefit from a short label, percentage, or legend to ensure accurate interpretation.
By following these practices, your pictogram will not only look professional but also communicate data in the simplest and most engaging way.
Pictogram charts are one of the simplest yet most powerful ways to communicate data visually. By following the steps outlined in this guide, you can create pictograms that transform complex information into clear, engaging visuals your audience will understand at a glance. Whether you start from scratch or use a pictogram template, the key is to keep your design simple, consistent, and purposeful, making your message both impactful and memorable.