In this guide, we’ll explain why it’s important to understand piping and instrumentation diagrams, break down how to interpret lines, labels, and tags, and walk you through a step-by-step method for how to read piping and instrumentation diagrams. This also covers common notations, abbreviations, and best practices to help you confidently analyze and work with these critical technical documents.
What are P&IDs?
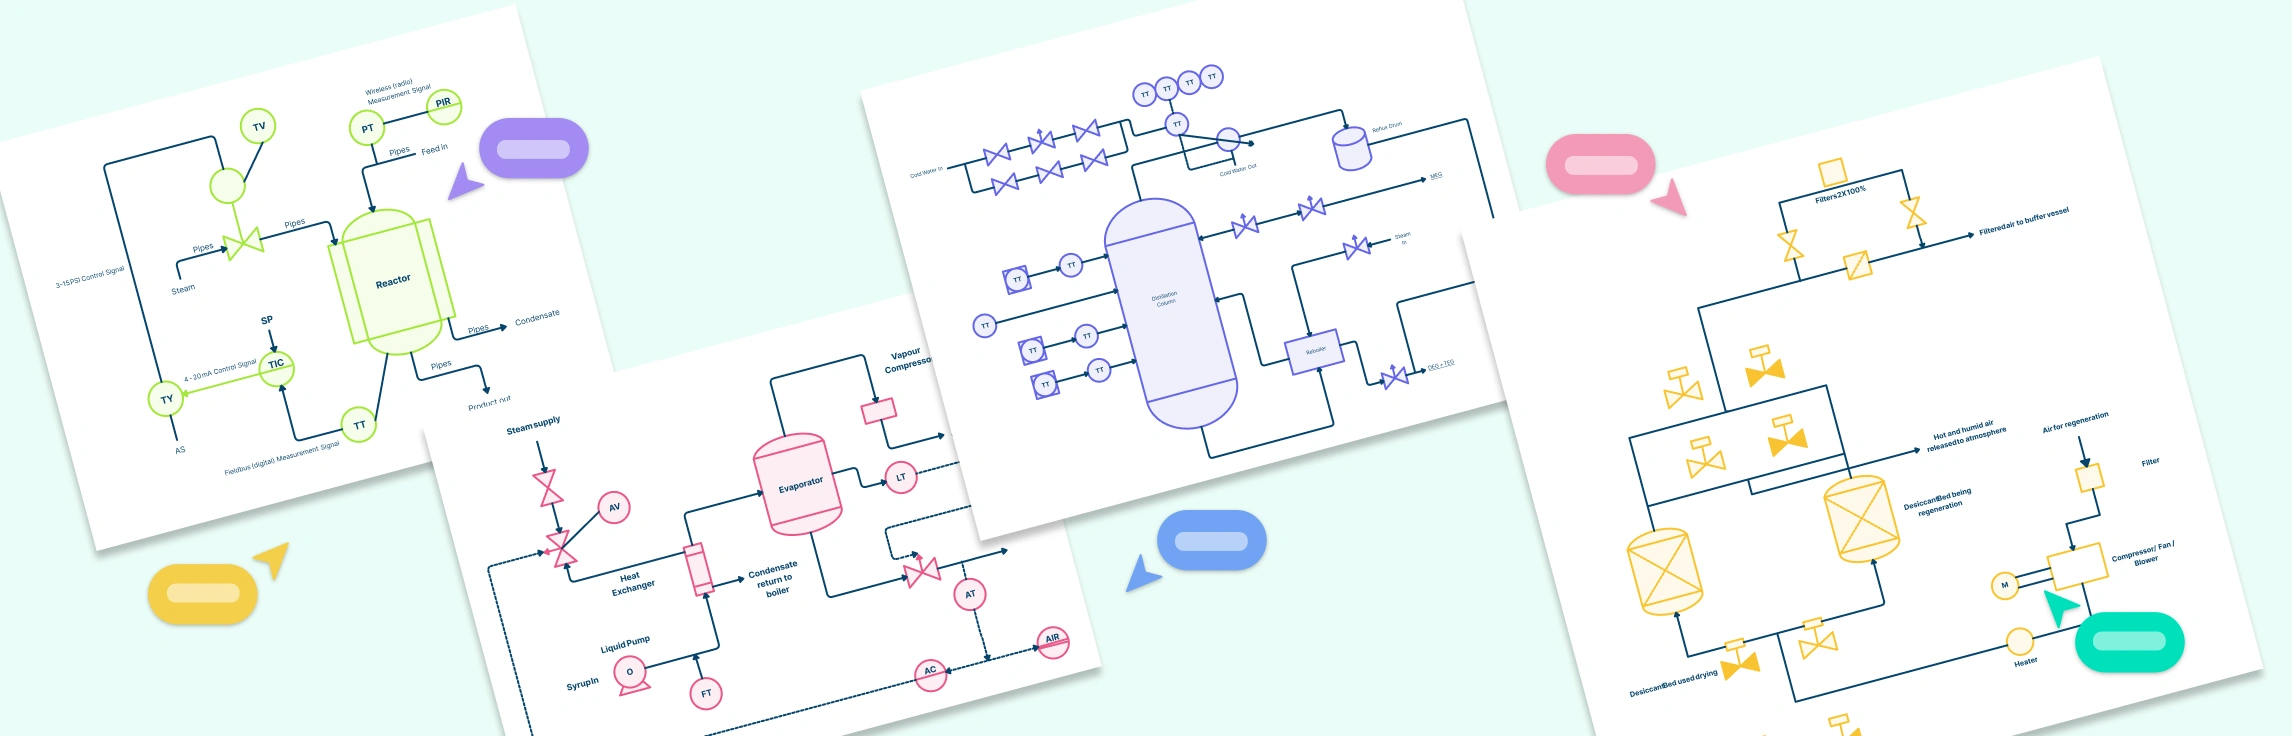
A piping and instrumentation diagram (P&ID) is a detailed schematic that illustrates the mechanical and control components of a process system. It shows how pipelines, valves, instruments, and equipment are interconnected to transport and control the flow of materials such as gases, liquids, or steam. In process engineering and system design, a P&ID serves as a blueprint that bridges conceptual design and operational reality. It helps engineers visualize process relationships, identify control loops, and ensure safe and efficient system operation.
What Information is Given in a P&ID
Process equipment — all major units such as tanks, pumps, compressors, heat exchangers, and any installed spares.
Associated piping — including drain and vent lines, pipe size, class, material, and tag numbers.
Valves and fittings — showing types, identification numbers, and control or isolation functions.
Instrumentation — transmitters, indicators, controllers, and control loops for process monitoring and automation.
Insulation and heat tracing — details of insulation or jacketing applied to maintain temperature and prevent heat loss.
Utilities and services — connections for steam, air, water, and other supporting systems.
Design and installation data — such as line slope, minimum straight lengths after instruments, and distance requirements from nearby equipment.
Safety elements — including pressure relief devices, alarms, and interlocks.
Legends and notes — symbol definitions, revision blocks, and other project-specific references.
What is not Included in a P&ID
While a Piping and Instrumentation Diagram provides detailed information about process flow and control, it intentionally omits certain design and operational details. These are typically covered in other engineering documents such as a process flow diagram (PFD), layout drawings, or mechanical design sheets.
A P&ID does not include:
Process conditions and physical data — such as temperature, pressure, and flow rate values.
Operating conditions — normal, minimum, or maximum operating ranges.
Streamflow details — flow quantities, compositions, or phase information.
Equipment locations — physical placement or orientation within the plant.
Pipe routing and lengths — exact routing, elevation, or length of pipes between components.
Support and structural details — foundations, pipe supports, or structural framing.
Mechanical specifications — fabrication drawings, material thicknesses, or welding details.
If you need to make PFDs, use Creately’s process flow diagram software to visualize and document process systems efficiently. It includes standardized PFD symbols and templates, enabling you to easily design accurate, compliant diagrams that reflect real industrial and chemical processes.
Understanding P&ID Lines, Labels, and Tags
A piping and instrumentation diagram uses a system of lines, labels, and tags to convey detailed information about the process flow and control system. Learning to interpret these elements correctly is key to understanding how to read piping and instrumentation diagrams and how different components are interconnected.
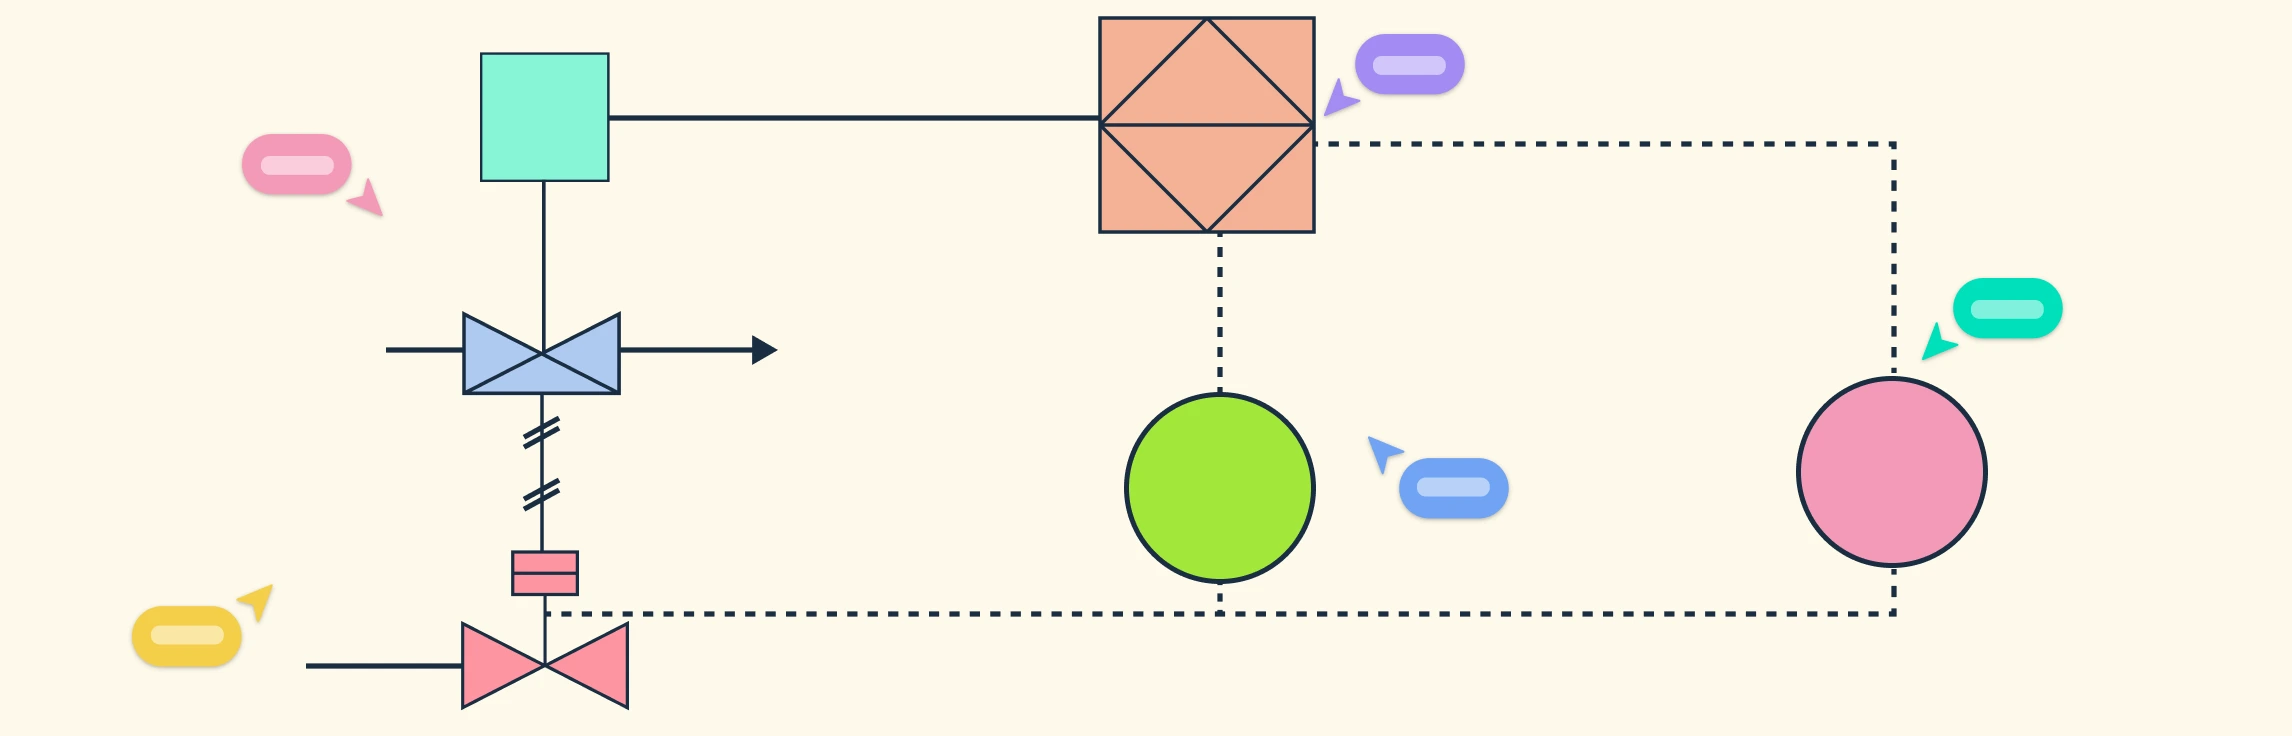
Line Types and Thicknesses
Process Lines: Solid lines of varying thickness represent main process flows. Thicker lines often indicate primary flow paths, while thinner ones show secondary or auxiliary lines.
Pneumatic Lines: Dashed or dotted lines indicate air or gas signal connections used in control systems.
Hydraulic Lines: Alternating long and short dashed lines are typically used to represent hydraulic fluid connections.
Electrical or Signal Lines: Thin dotted or dashed lines represent electrical connections or control signal paths between instruments.
Labeling Conventions
Each pipeline in a P&ID is assigned a unique line number that identifies its size, service, material, and insulation type. Signal lines are labeled to indicate the type of control (pneumatic, electronic, digital) and direction of flow. Labels may also reference instrument loops or system sections, helping engineers trace flow paths and identify control zones.
Equipment and Instrument Tag Formats
Tags provide quick reference to specific equipment or instruments within the system. Equipment such as pumps, tanks, or compressors often have unique equipment numbers (e.g., P-101A) to distinguish between multiple units.
A typical instrument tag follows the ISA S5.1 standard format (e.g., PT-101), where:
- The first letter indicates the measured variable (P = Pressure, T = Temperature, F = Flow, L = Level).
- The second letter indicates the function (T = Transmitter, I = Indicator, C = Controller).
- The number uniquely identifies the loop or device.
Tag | Meaning | Description |
P | Pressure | Used for instruments that measure or control pressure. |
T | Temperature | Indicates temperature sensors, transmitters, or controllers. |
F | Flow | Refers to instruments monitoring or regulating fluid flow. |
L | Level | Used for level sensors, indicators, or controllers. |
I | Indicator | Shows measured values visually or digitally. |
C | Controller | Automatically adjusts variables based on input signals. |
A | Alarm | Signals abnormal conditions or threshold breaches. |
Examples:
- PT-101 - Pressure Transmitter for loop 101
- TIC-202 - Temperature Indicating Controller for loop 202
- LT-305 - Level Transmitter for loop 305
Common Equipment and Valve Codes
In addition to instrument tags, piping and instrumentation diagrams also use standardized codes to identify major equipment and valves throughout the system.
Code | Equipment / Valve | Description |
P | Pump | Transfers liquids through the process system. |
T | Tank | Stores process fluids or materials. |
HX | Heat Exchanger | Transfers heat between two process streams. |
V | Vessel | Contains process fluids under specific pressure or temperature. |
CV | Control Valve | Regulates fluid flow automatically. |
RV | Relief Valve | Releases excess pressure for safety. |
BV | Ball Valve | Manually isolates or controls flow. |
SV | Solenoid Valve | Operated electrically to control flow. |
Understanding lines, labels, and tags is only part of learning how to read a P&ID drawing. Each component on the diagram is also represented by a unique symbol that visually conveys its function.
Steps for Reading a P&ID Diagram
Now that you understand how lines, labels, and tags work together to represent connections, instruments, and equipment, it’s time to learn how to read a P&ID diagram as a complete system.
Step 1: Identify the Major Equipment
Begin by identifying the primary process equipment such as pumps, tanks, compressors, heat exchangers, and vessels. These components form the core of the process and define the system boundaries. Understanding their relative placement gives context to how materials and energy flow through the plant.
Step 2: Trace the Main Process Flow
Flow Arrows: Observe the arrows drawn along process lines. They indicate the direction in which the process fluid travels between equipment units. Understanding these helps you trace the intended movement of materials through the system.
Equipment Orientation: Note how pumps, compressors, and other flow-generating devices are positioned on the diagram. Their placement typically reveals the direction of flow, from the inlet side to the discharge or outlet.
Sequence of Operations: Trace the process lines step by step from the input or feed stage, through processing units, and finally to the output or storage stage to visualize how the system operates as a continuous process.
Step 3: Understand Operating Conditions
Line Labels: Review the labels marked on each pipe to identify information such as diameter, material type, and the fluid being transported. These details often hint at the expected pressure and temperature ranges for that section of the system.
Instrument Tags: Observe the tags linked to instruments like transmitters and indicators (for example, PT-101 or TT-201). These reveal the process variables being measured or controlled, such as pressure, temperature, or flow.
Process Annotations: Check for supplementary notes or annotations that outline key operating limits, including design pressure, temperature ratings, or flow capacities. They provide essential context for understanding the system’s operational boundaries.
Step 4: Identify Control Loops and Feedback Paths
Control Symbols: Identify controllers, transmitters, and control valves shown on the diagram. They’re usually linked by dashed lines, which illustrate how control signals or feedback loops connect these devices.
Loop Identifiers: Every control loop has a distinct tag or loop number (such as TIC-202 or LIC-301) that helps you follow its path across the P&ID and understand its role within the system.
Functional Relationships: Recognize how instruments interact within a loop. For instance, a temperature transmitter (TT) might send data to a temperature controller (TC), which then regulates a control valve (CV) to maintain the required temperature.
Step 5: Check Instrumentation Symbols and References
Review all instrumentation bubbles, symbols, and legend references to confirm their function. Distinguish between indicators, transmitters, controllers, and recorders. Use the piping and instrumentation diagram legend or symbol sheet to verify what each symbol represents.
Step 6: Verify Connections and Notes
Inspect all signal lines, junctions, and annotations to ensure you understand how different subsystems interact. Check for:
- Safety devices such as relief valves or alarms.
- Bypass or drain lines that may be critical during maintenance or emergencies.
- Notes and legends that explain abbreviations, standards, and revisions.
By mastering how to read P&ID drawings, you gain the clarity needed to design and document process systems accurately. Creately’s P&ID diagram software includes standard P&ID symbols, helping you easily create precise, compliant diagrams that align with engineering best practices.
Best Practices for Reading P&ID Diagrams
Start with the basics: Focus first on major equipment and main process lines before analyzing detailed instruments or control loops.
Refer to the legend: Always check the symbol key to understand the specific notations and abbreviations used in the diagram.
Use visual aids: If working digitally, apply color-coding or highlighting to trace different flow paths and subsystems.
Review simple diagrams first: Practice on smaller, single-system P&IDs before moving to complex plant-wide diagrams.
Don’t confuse layout with flow: Remember that piping and instrumentation diagrams show process relationships, not physical equipment placement.
Pay attention to dashed lines: These often represent control or signal connections that are essential for automation logic.
Verify tag numbers carefully: Misreading instrument tags (e.g., PT vs. TT) can lead to major interpretation errors.
Check for updates or revisions: Ensure you’re referencing the latest version of the diagram before analysis or modification.
Cross-reference with the PFD: Compare the piping and instrumentation diagram with the process flow diagram to confirm equipment labels, stream numbers, and control logic.
Understand process intent: Use both diagrams together to see how the process operates and how instrumentation supports system control.
Why it’s Important to Understand How to Read a P&ID Drawing
Foundation for Process Understanding: Learning how to read P&ID drawings helps you grasp how an entire system operates, from material flow to control loops. This enables better process design and optimization.
Improves Safety and Compliance: Understanding safety valves, pressure relief systems, and interlocks on a P&ID ensures adherence to industry standards and prevents hazardous incidents.
Essential for Troubleshooting and Maintenance: Technicians use P&IDs to locate instruments, identify malfunctioning equipment, and plan maintenance with minimal downtime.
Supports Accurate Communication: A shared understanding of piping and instrumentation diagrams promotes clear communication between design engineers, operators, and contractors during installation or modification.
Guides Control and Automation Design: Control engineers rely on P&IDs to configure instrumentation, signal flow, and control logic across distributed systems.
Critical for Documentation and Audits: P&IDs serve as official records of system design and modifications, helping teams stay compliant during safety inspections or regulatory reviews.
Facilitates Efficient Training: New engineers and operators use P&IDs to understand plant layout, system behavior, and operational workflows quickly.
Free UML Activity Diagram and UML State Machine Diagram Templates


FAQs about Reading P&ID Diagrams
Are P&IDs drawn to scale?
Should I cross-check a P&ID with other documents?
What common mistakes in reading P&IDs should beginners avoid?
Do I need a legend and revision blocks for reading P&IDs?
Resources
Kim, Byung Chul, et al. “End-To-End Digitization of Image Format Piping and Instrumentation Diagrams at an Industrially Applicable Level.” Journal of Computational Design and Engineering, vol. 9, no. 4, 20 June 2022, pp. 1298-1326, https://doi.org/10.1093/jcde/qwac056.
Rahul, Rohit, et al. “Automatic Information Extraction from Piping and Instrumentation Diagrams.” ArXiv (Cornell University), 1 Jan. 2019, https://doi.org/10.48550/arxiv.1901.11383.