Understanding how different parts of a system interact is essential for modeling complex behaviors in software design. In this guide, we’ll cover what an Interaction Overview Diagram is, its key notations, and a step-by-step process on how to draw one. You’ll also explore the benefits of using these diagrams and learn when to use them effectively in system modeling.
What Is an Interaction Overview Diagram?
An Interaction Overview Diagram is a type of UML behavioral diagram that provides a high-level overview of how different interactions occur within a system. As a subtype of interaction diagrams, it focuses on the logical sequence and flow of interactions rather than detailed message exchanges, helping designers visualize complex processes across multiple scenarios in a clear and structured manner.
Read the interaction diagram tutorial to learn more about the four types of UML interaction diagrams.


Purpose of a UML Interaction Overview Diagram
Illustrates the overall control flow among multiple interaction fragments within a system.
Provides a high-level behavioral view that shows how different interactions connect and transition.
Combines features of both activity diagrams and interaction diagrams to represent logical flow and coordination.
Links various interaction types such as sequence, communication, or timing diagrams into one integrated model.
Helps model complex workflows by showing how smaller interaction segments fit into the broader process.
Enables designers to visualize system collaboration and understand how components work together to achieve a specific outcome.
When to Use the UML Interaction Overview Diagram
When a system process involves multiple interaction diagrams that need to be unified into a single, simplified overview.
When you need to represent conditional, branching, or parallel workflows within a system.
When documenting high-level system behavior for presentations, reports, or stakeholder communication.
When designing large or distributed systems where different subsystems interact through several layers.
When you want to connect detailed interaction diagrams (like sequence diagrams or communication diagrams) into one coherent control flow.
When transitioning from activity diagrams to interaction-focused modeling, offering a bridge between process and communication views.
You can easily start using interaction diagrams with Creately’s UML diagram tool which comes with drag-and-drop shapes, ready-made templates, and real-time collaboration features that make system modeling faster and more visual.
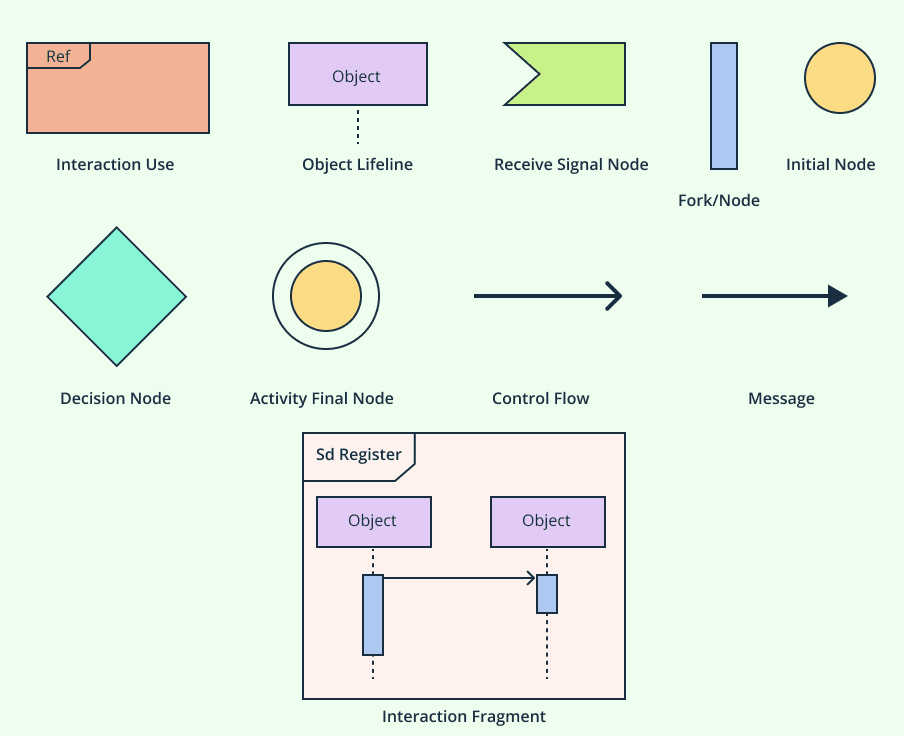
Notations of Interaction Overview Diagrams
These notations collectively define how these diagrams communicate system behavior. They blend activity-style control flow with detailed interaction logic, providing a clear visual structure for modeling complex processes and interactions.
1. Initial Node
The initial node represents the starting point of the interaction. It indicates where the process begins and is shown as a small solid circle with a single outgoing control flow arrow leading to the next element in the diagram.
2. Interaction Use
An interaction use is a reference to another interaction or sequence of interactions defined in another part of the system. It is represented by a rectangular box labeled with the interaction name or reference, often including the keyword “ref.” This notation allows designers to reuse existing interactions and simplify complex system models by linking to other diagrams.
3. Interaction Fragment
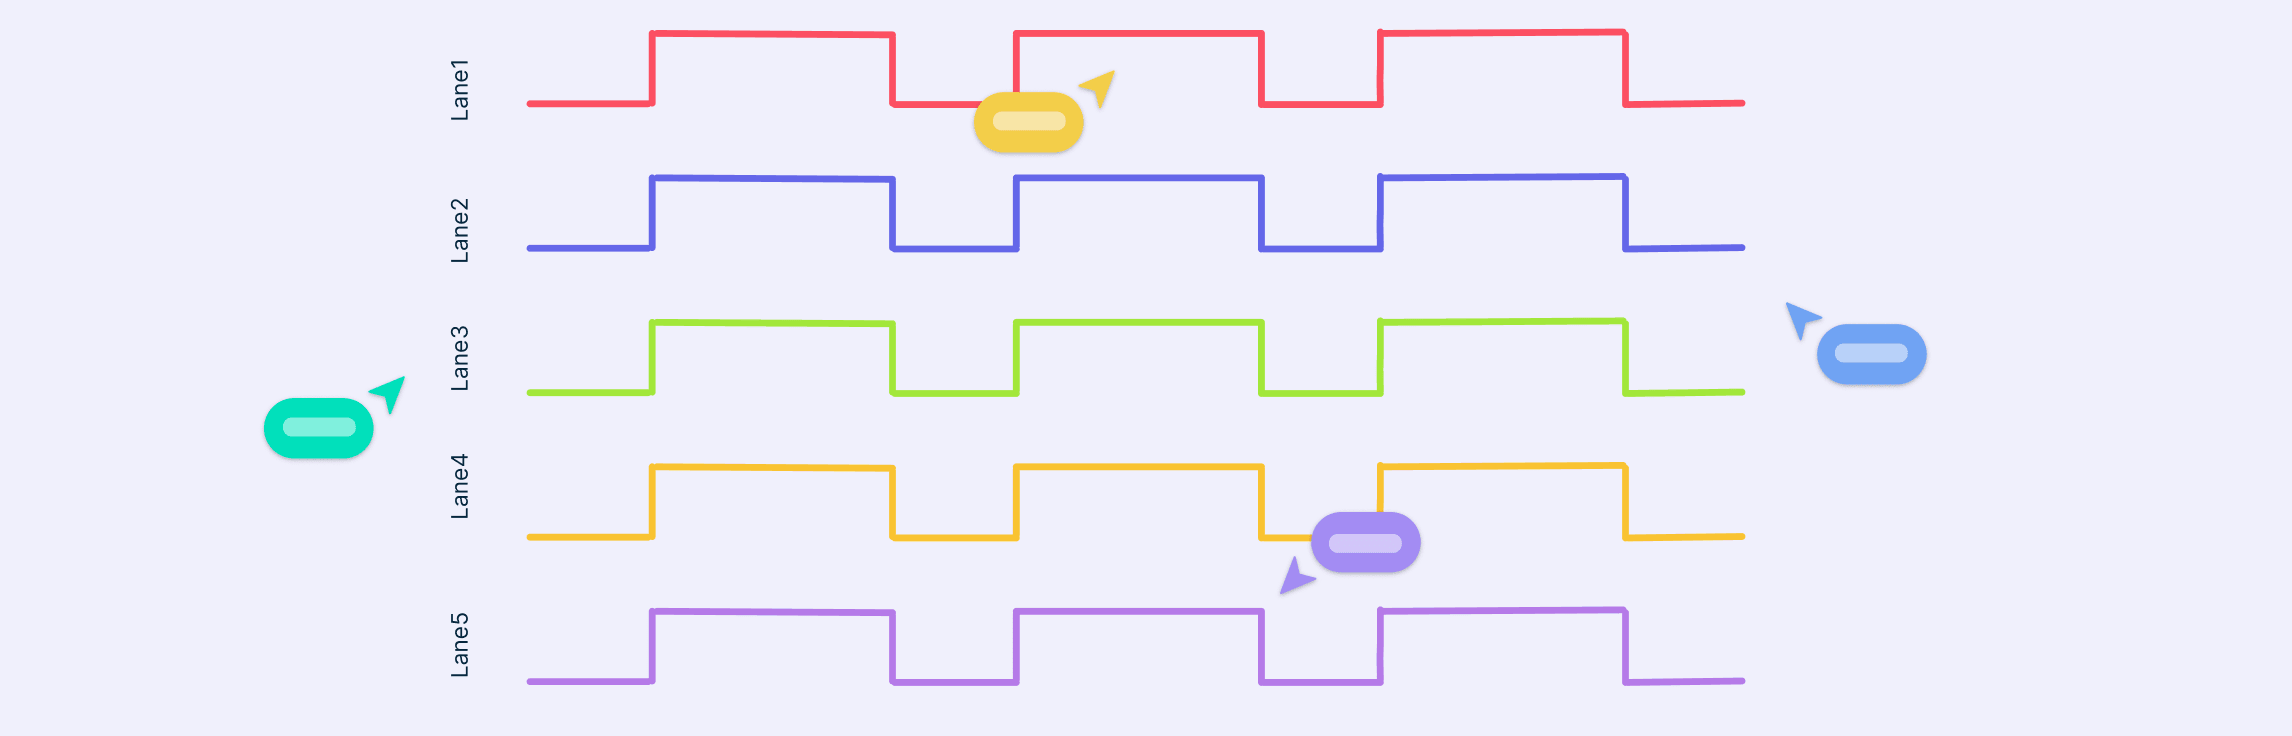
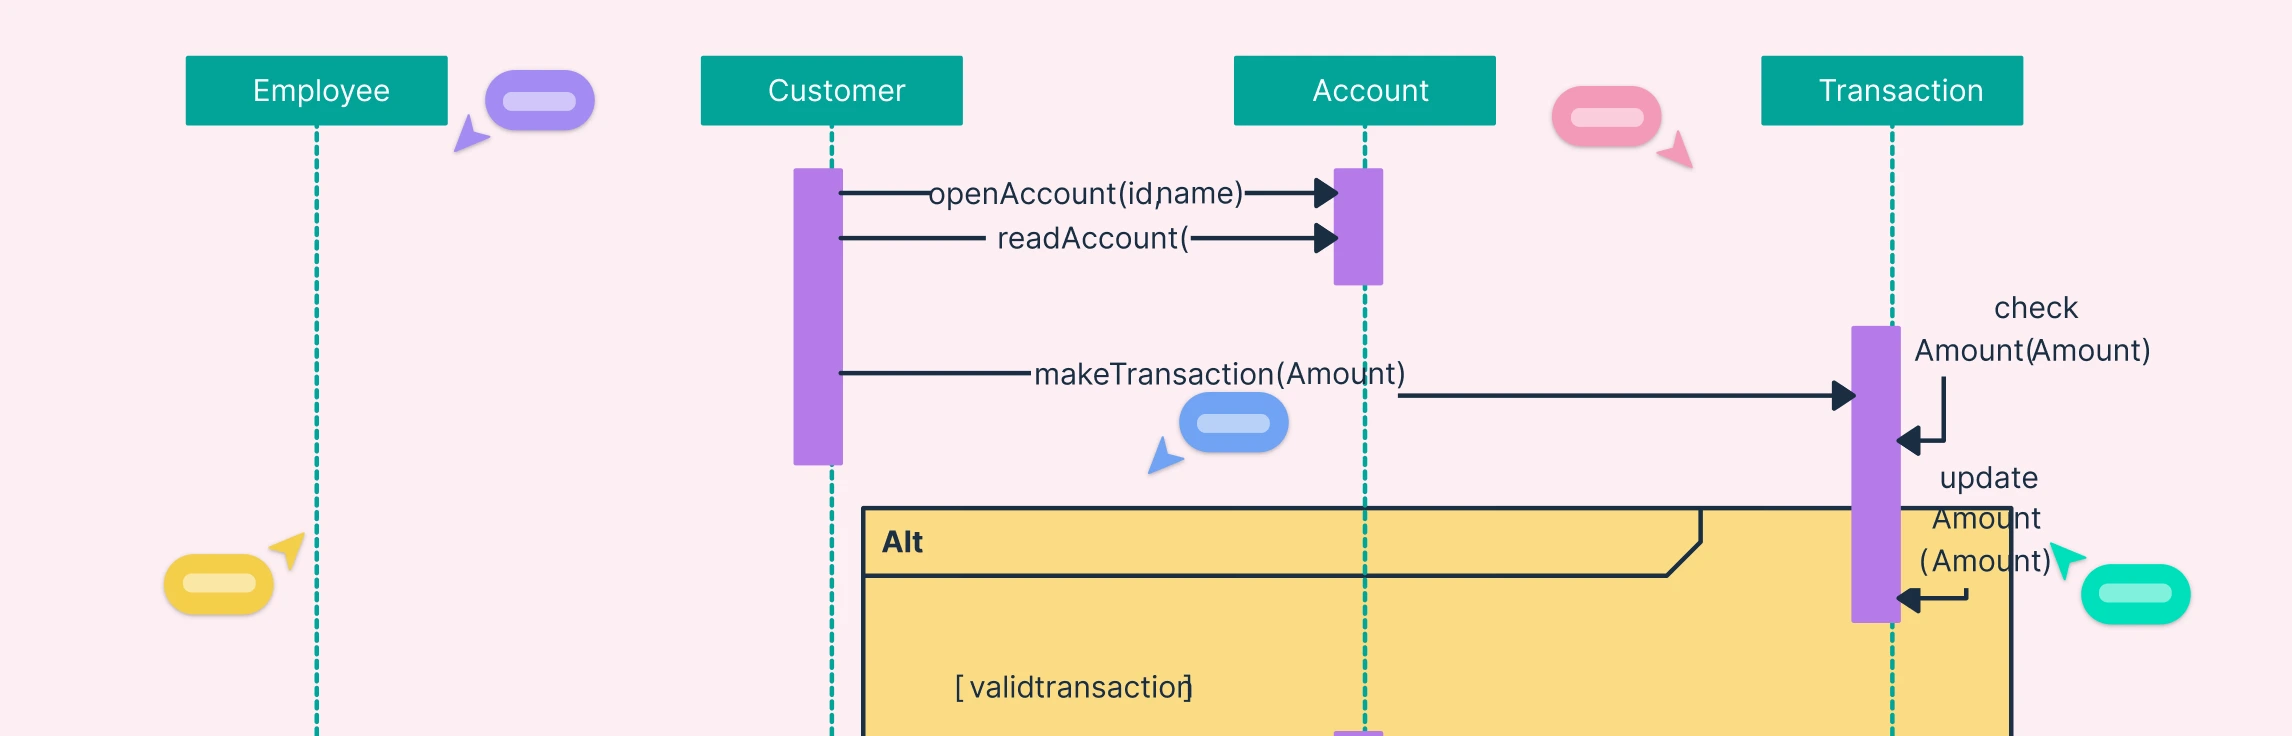
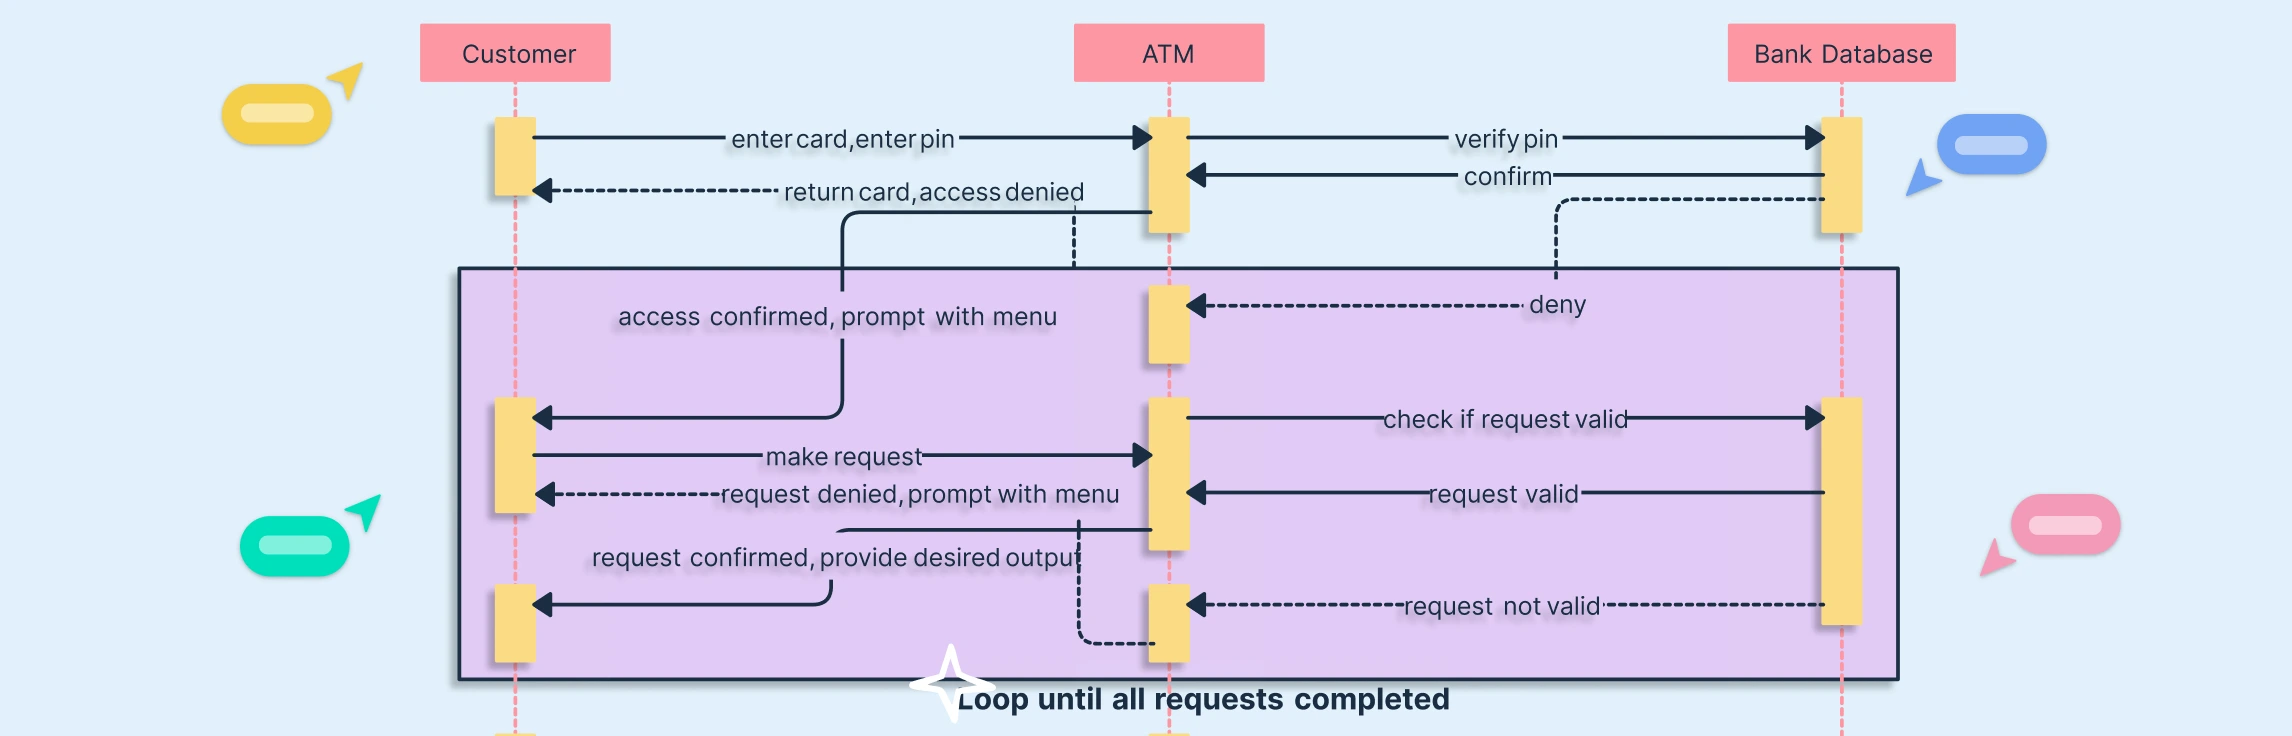
Interaction fragments are used to group and organize related interactions within the diagram. They represent specific behavioral segments, such as loops, conditional paths, or parallel interactions, helping to modularize and structure the overall process.
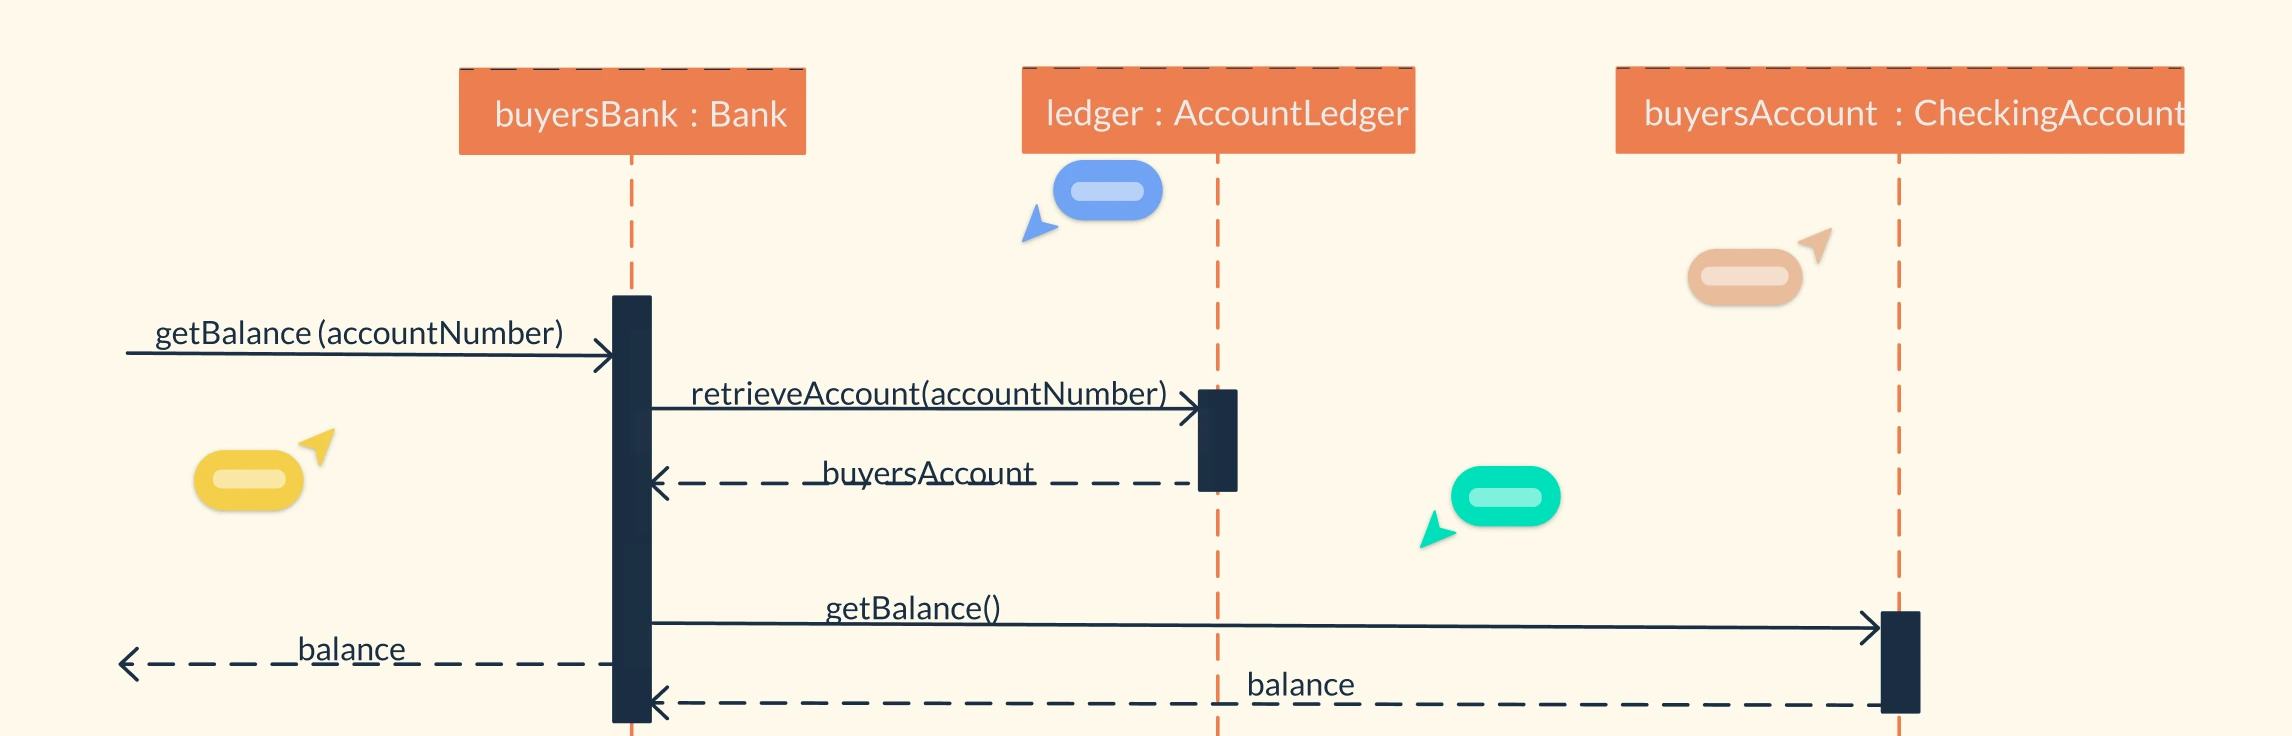
4. Object Lifeline
An object lifeline represents the lifespan of an object during an interaction. It is depicted as a vertical dashed line extending downward from a labeled object name or class, illustrating how long the object exists and participates in the sequence of events.
5. Message
Messages represent communication between objects or components within the system. They are shown as arrows between lifelines, labeled with descriptive text indicating the type of interaction or event. Messages can be synchronous, asynchronous, or return types, depending on the system’s behavior.
6. Control Flow
Control flow indicates the sequence and direction of execution between interaction nodes. It is drawn as a solid arrow connecting elements, showing how control moves from one activity or interaction to another within the process.
7. Fork Node / Join Node
A fork node or join node represents points where parallel interactions occur or merge. They are shown as thick horizontal or vertical bars. A fork node splits one control flow into multiple concurrent paths, while a join node synchronizes multiple flows back into one, maintaining logical control of the process.
8. Decision Node
A decision node represents a conditional branch within the interaction. It is drawn as a diamond shape with one incoming control flow and multiple outgoing arrows, each representing a different path based on specific conditions or outcomes.
9. Receive Signal Node
A receive signal node represents the receipt of a signal or event during the interaction. It is depicted as a small rectangle with an incoming control flow arrow, showing that an external trigger or signal initiates the next part of the process.
10. Final Node
The final node marks the end point of the interaction. It indicates that all control flows have concluded. This node is shown as a solid circle with no outgoing arrows, sometimes surrounded by another circle to emphasize completion.
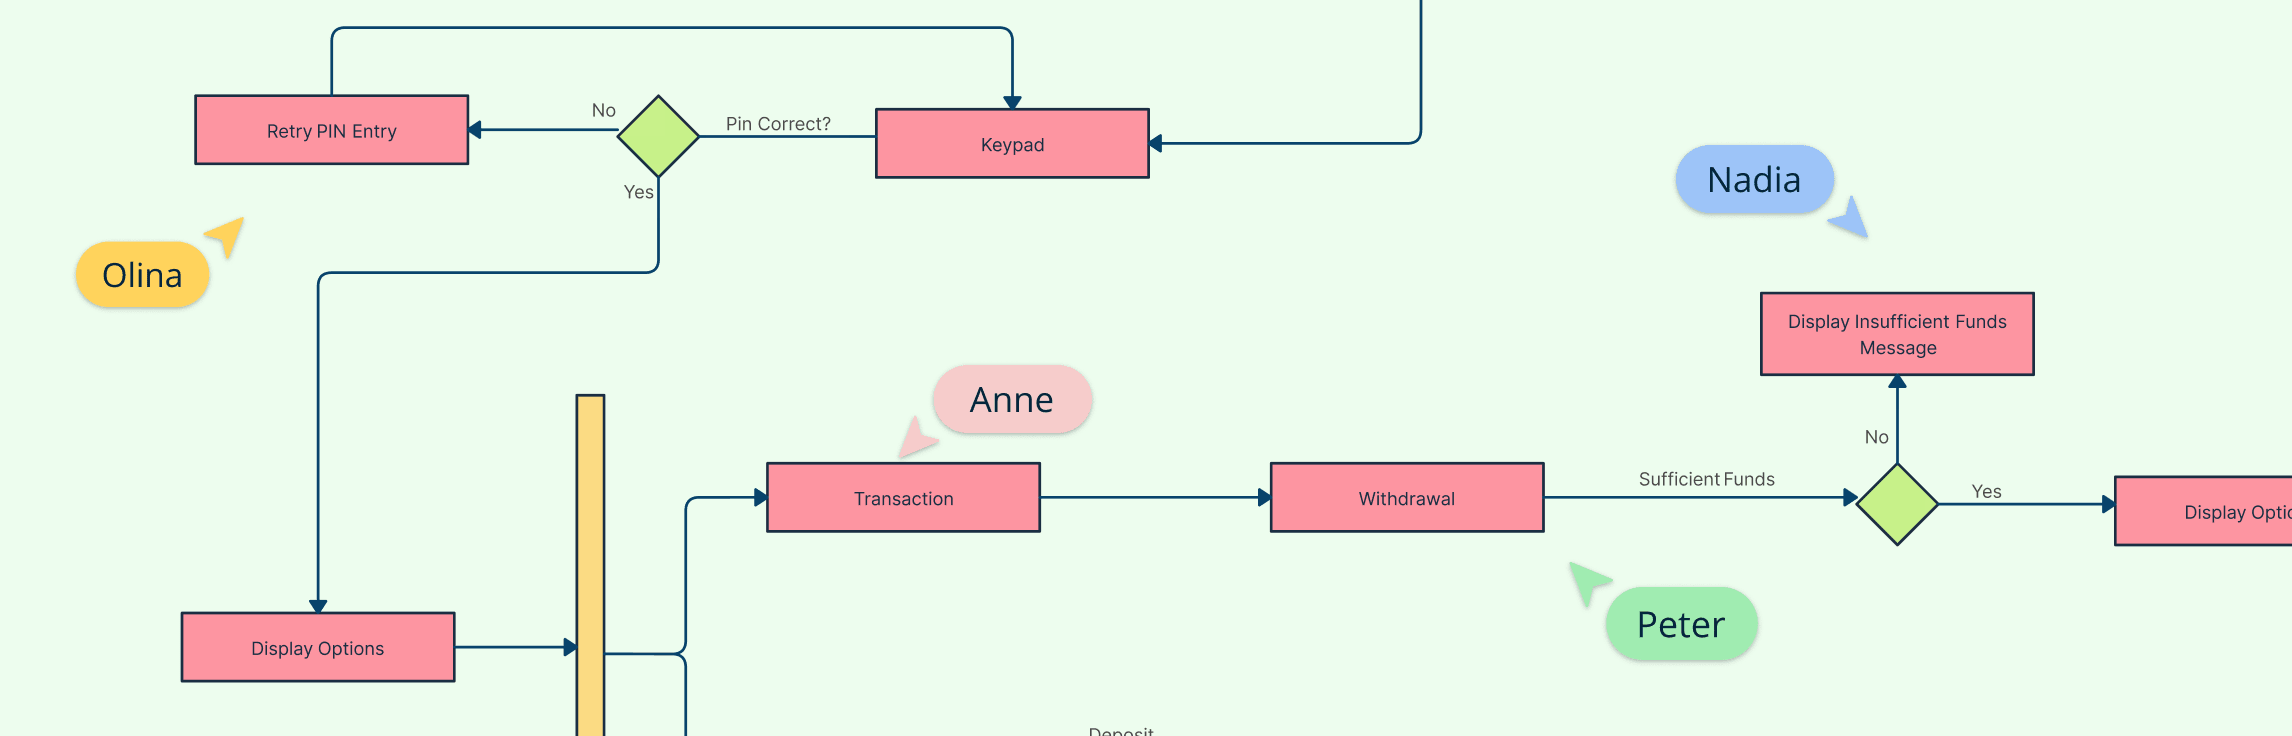
How to Draw a UML Interaction Overview Diagram
You can use one of Creately’s ready-made interaction overview diagram templates and follow these steps to create your diagram quickly and efficiently.
Step 1. Identify the System or Process to Model
Start by defining the process or scenario you want to represent. This could be a business workflow, a software use case, or any system behavior involving multiple interactions. Clearly determine the start and end points of the process to set the scope of your diagram.
Step 2. Define the Main Interactions
List the key interaction fragments or steps that occur within the system. These might include actions like authentication, validation, processing, or communication between system components. Each interaction can later be represented as an interaction use (a referenced interaction diagram such as a sequence or communication diagram).
Step 3. Add the Initial Node
Place an initial node (a small filled circle) at the top or left side of the diagram. This marks the starting point of the process and connects to the first interaction through a control flow arrow.
Step 4. Insert Interaction Uses or Fragments
Add interaction use boxes to represent referenced diagrams, such as “Login Sequence,” “Validate Request,” or “Send Response.” Label each clearly with its interaction name. These serve as building blocks representing specific parts of the system’s behavior.
Step 5. Connect with Control Flows
Draw control flow arrows to connect the nodes and interaction uses in the correct sequence. These arrows define the execution order and indicate how control moves from one interaction to another throughout the process.
Step 6. Add Decision and Merge Nodes
Where the flow diverges based on conditions, include a decision node (diamond shape) with labeled outgoing arrows for each possible path. If multiple paths later converge, use a merge node to rejoin them into a single control flow.
Step 7. Represent Parallel Interactions
If some processes occur simultaneously, use a fork node (a thick bar) to split the control flow into parallel paths, and a join node to merge them back into one unified flow once all parallel tasks are complete.
Step 8. Include Receive Signal or Event Nodes (Optional)
When external events or triggers are part of the process, add receive signal nodes to represent when signals are received and processed within the system.
Step 9. Add the Final Node
At the end of the interaction flow, place a final node (a filled circle with no outgoing arrows) to represent the completion of the process.
Step 10. Review for Logical Flow and Clarity
Finally, review the diagram to ensure all control flows, conditions, and interactions are logically connected and easy to follow. A well-structured UML Interaction Overview Diagram should clearly show how various interactions work together to complete the overall process.

Benefits of Using Interaction Overview Diagrams
Using a UML Interaction Overview Diagram offers several practical advantages in system design and analysis:
Simplifies complex behavior by summarizing multiple interactions into one cohesive diagram.
Improves clarity and understanding of how processes flow and depend on one another.
Enhances collaboration and documentation, making system logic easier to communicate among stakeholders.
Supports modular system design, allowing individual interaction fragments to be developed and refined independently.
Speeds up analysis and maintenance by clearly showing dependencies and potential bottlenecks in workflows.
Improves modeling efficiency, reducing the need to navigate multiple detailed diagrams to grasp the complete process.
Free Interaction Overview Diagram Templates to Get Started


FAQs about the UML Interaction Overview Diagram
How is an Interaction Overview Diagram different from a Sequence Diagram?
How do I reference other UML diagrams in a UML interaction overview diagram?
Are Interaction Overview Diagrams and Activity Diagrams the same?
Can I use Interaction Overview Diagrams for real-world systems?
Resources
Baresi, Luciano, et al. “From Interaction Overview Diagrams to Temporal Logic.” Lecture Notes in Computer Science, 1 Jan. 2011, pp. 90–104, https://doi.org/10.1007/978-3-642-21210-9_9.
Thouraya Bouabana - Tebibel. Semantics of the Interaction Overview Diagram. Vol. 1492, 1 Aug. 2009, pp. 278–283, https://doi.org/10.1109/iri.2009.5211565.