Modern IT environments rarely stay simple for long. As systems grow, tools multiply, and teams scale, it becomes harder to see how everything fits together, or what might break when changes are made. This guide helps you cut through that complexity. You’ll learn what IT infrastructure maps are, how they bring clarity to connected systems, how to create your own step by step, and the best tool to do it.
What Is an IT Infrastructure Map?
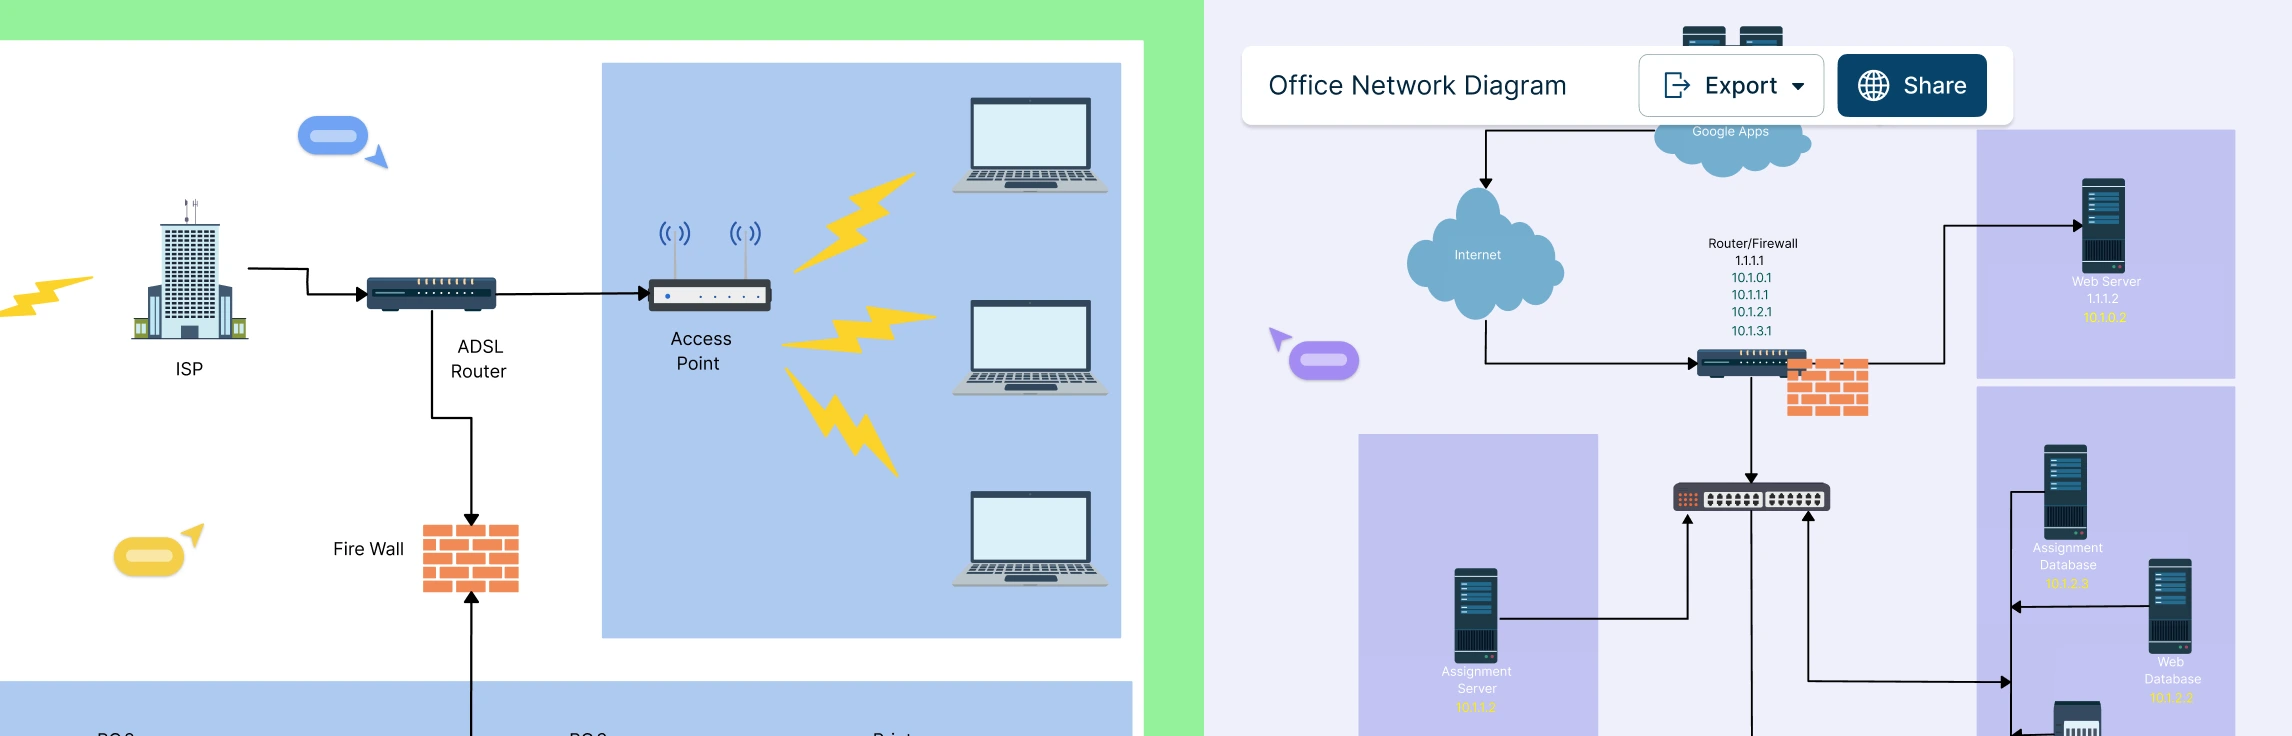
An IT infrastructure map is a visual representation of an organization’s IT environment. It shows how hardware, software, networks, and services are connected and how they interact with each other. This includes servers, databases, applications, network devices, and cloud resources. By turning complex systems into a clear visual, an IT infrastructure map helps teams understand dependencies, spot risks, plan changes, and respond to issues faster.
Key Benefits of IT Infrastructure Mapping
IT infrastructure mapping helps organizations understand, manage, and optimize their technology environments by making complex systems visible and easier to control. Key benefits include:
Clear visibility into hardware, software, networks, and system dependencies.
Faster troubleshooting and reduced downtime.
Confident planning for upgrades, scaling, and migrations.
Early identification of risks, bottlenecks, and single points of failure.
Improved security through better asset and connection awareness.
Stronger documentation for audits, compliance, and onboarding.
Better collaboration and communication across technical and non-technical teams.
More efficient use of IT resources and infrastructure investments.
How to Perform Effective IT Infrastructure Mapping
Follow these steps to create a clear, accurate map of your IT environment and make complex systems easier to understand and manage. You can use Creately’s network diagram software to drag, drop, label, and connect network components clearly, and the flowchart software to map processes, data flows, and system interactions in a structured, easy-to-follow way.
Step 1: Define the scope and objective
Decide what you are mapping (on-prem, cloud, or hybrid) and the purpose—planning, troubleshooting, documentation, audits, or security analysis.
Step 2: Inventory all IT components
List hardware (servers, routers, switches), software (applications, databases), networks, cloud services, and supporting tools.
Step 3: Identify connections and dependencies
Document how systems communicate, which components depend on others, and any critical paths or single points of failure.
Step 4: Choose the right level of detail
Start with a high-level overview, then add details such as IP ranges, subnets, integrations, or security zones only where they add value.
Step 5: Create the visual map or diagram
Use network diagrams to visualize how devices and systems are connected, and flowcharts to map processes, data movement, and system interactions. Creately provides ready-made network diagram templates and flowchart templates to help you build clear, accurate visuals quickly.
Step 6: Validate with stakeholders
Review the map with IT, operations, and security teams to ensure accuracy and completeness.
Step 7: Analyze, optimize, and keep it updated
Use the map to identify risks, bottlenecks, redundancies, and optimization opportunities, and update it regularly as systems change so it remains a reliable reference.
Why Creately is the Best Tool for IT Infrastructure Mapping
Creately is a powerful diagramming and visual collaboration platform that offers many features for IT infrastructure mapping. Here are some key features for you to consider,
User-friendly interface
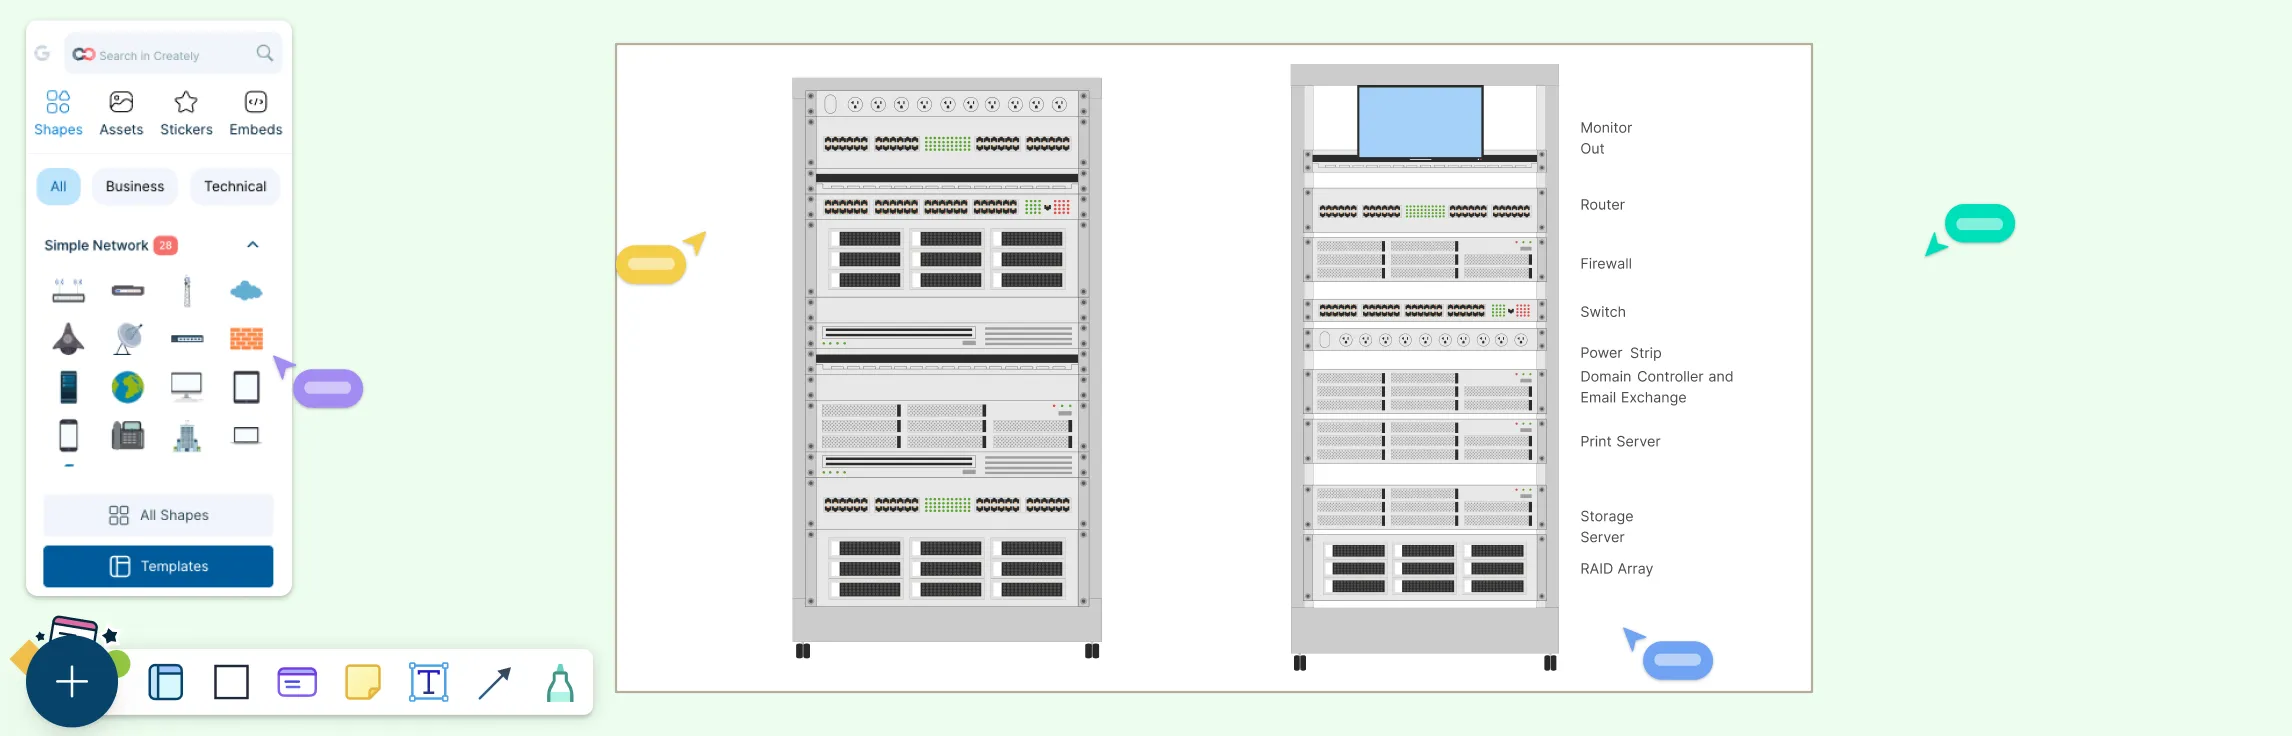
An intuitive drag-and-drop interface helps both technical and non-technical users create infrastructure diagrams quickly using pre-built shapes and icons.
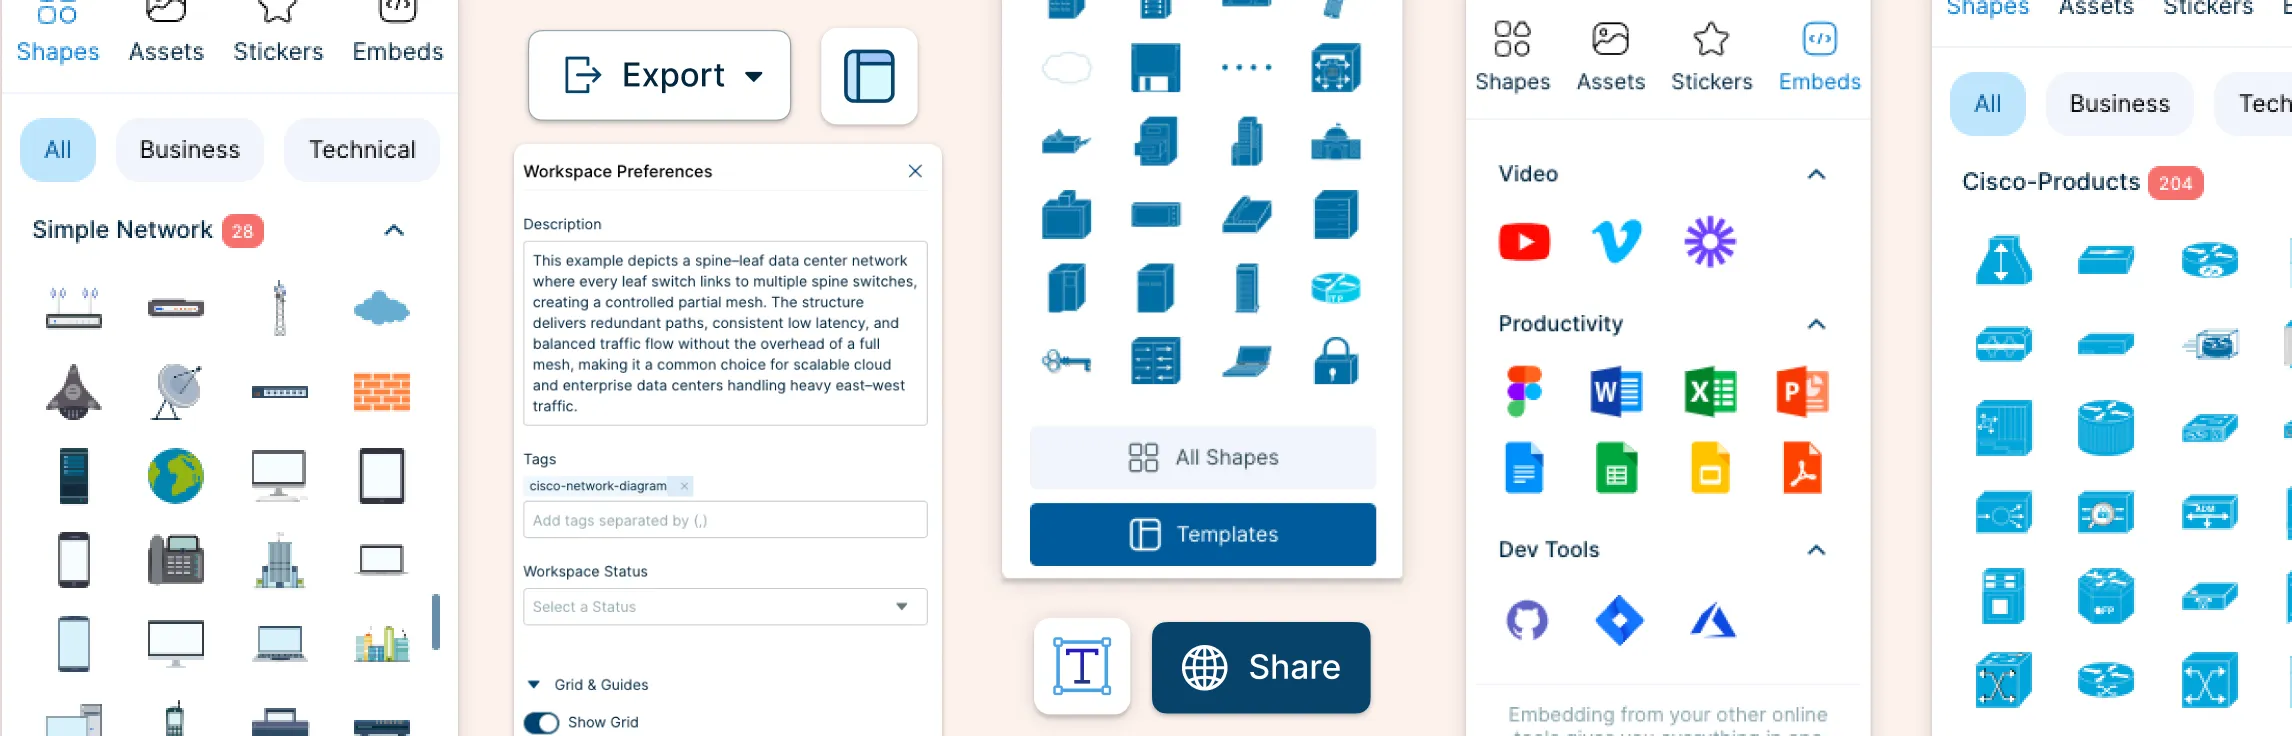
Extensive collection of templates and shapes
A wide range of IT-specific templates and standardized symbols for servers, networks, security, and cloud components save time and ensure accuracy..
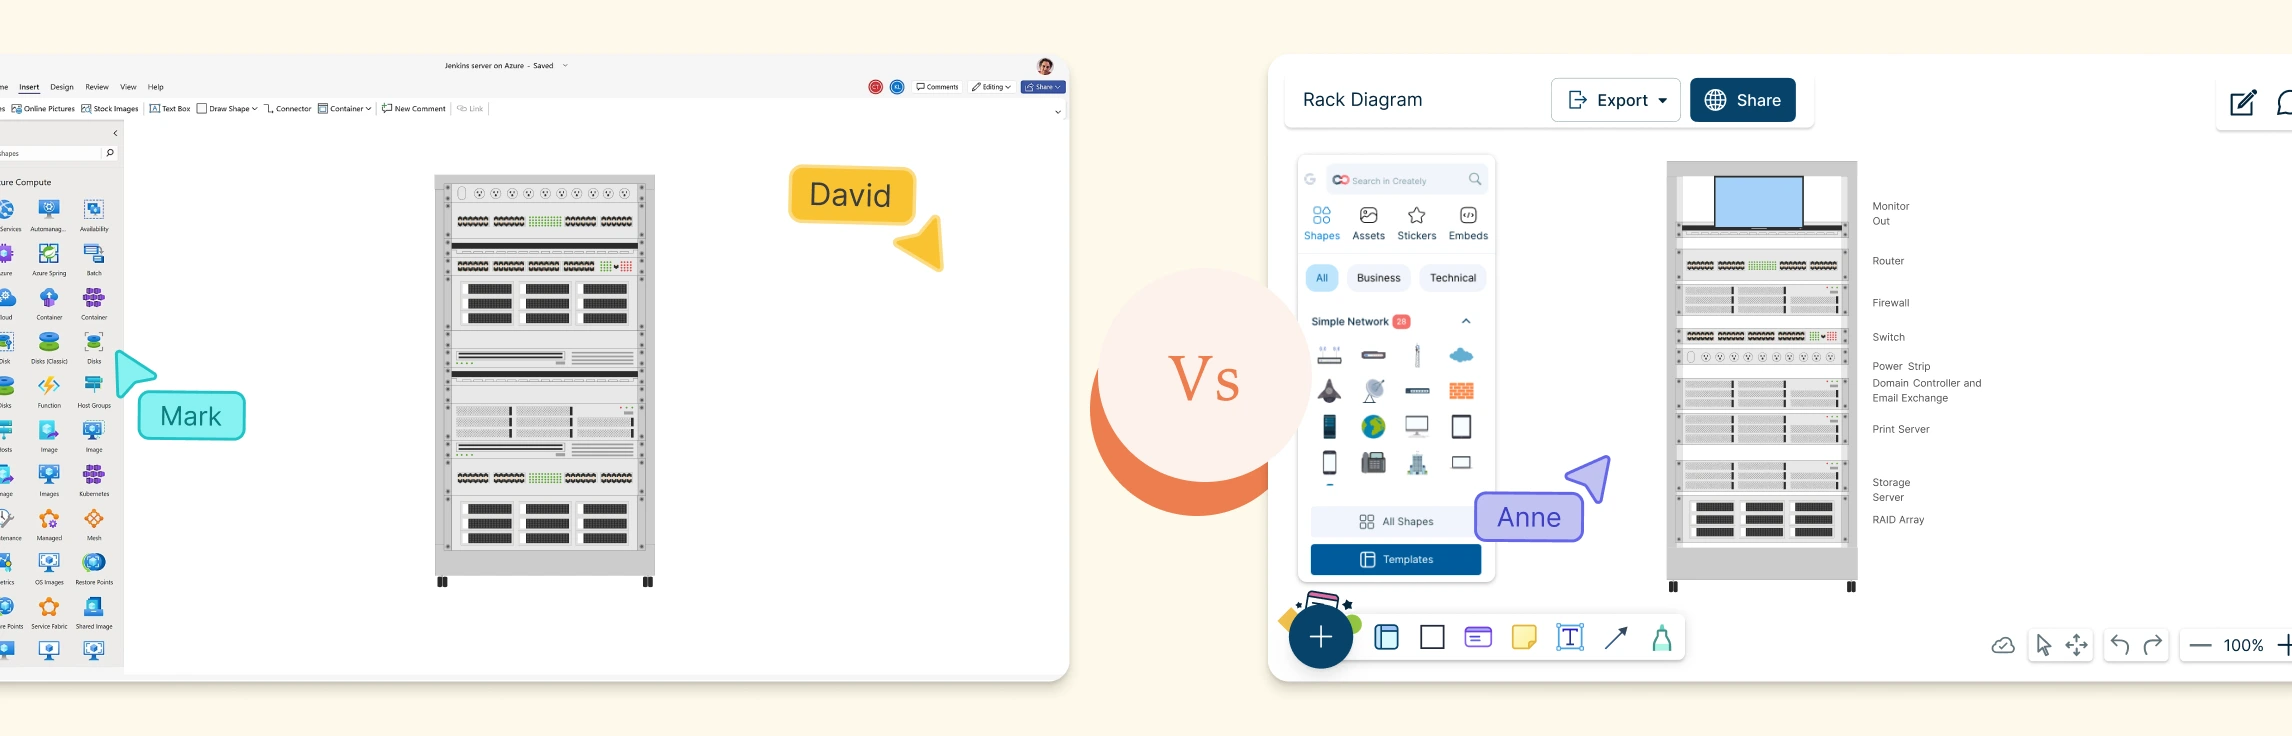
Real-time collaboration
Teams can work on the same diagram simultaneously, enabling faster reviews, better alignment, and smoother collaboration across locations.
Accessible anywhere
Being cloud-based, Creately allows you to access and update diagrams anytime, making it ideal for remote and distributed teams.
Integration with other tools
Integrates with tools like Google Workspace, Microsoft, Confluence, and Slack to fit naturally into existing workflows.
Full version history
Built-in version control lets you track updates, restore previous versions, and maintain transparency.
Export and sharing options
Export diagrams in formats such as PDF, PNG, JPEG, SVG, and CSV for easy sharing and documentation.
Mapping your IT resources will help you gain more visibility over your IT infrastructure, its processes and the various assets you have. This, in turn, helps you gain more control, be more productive and allow you to proactively solve issues before they become major problems.
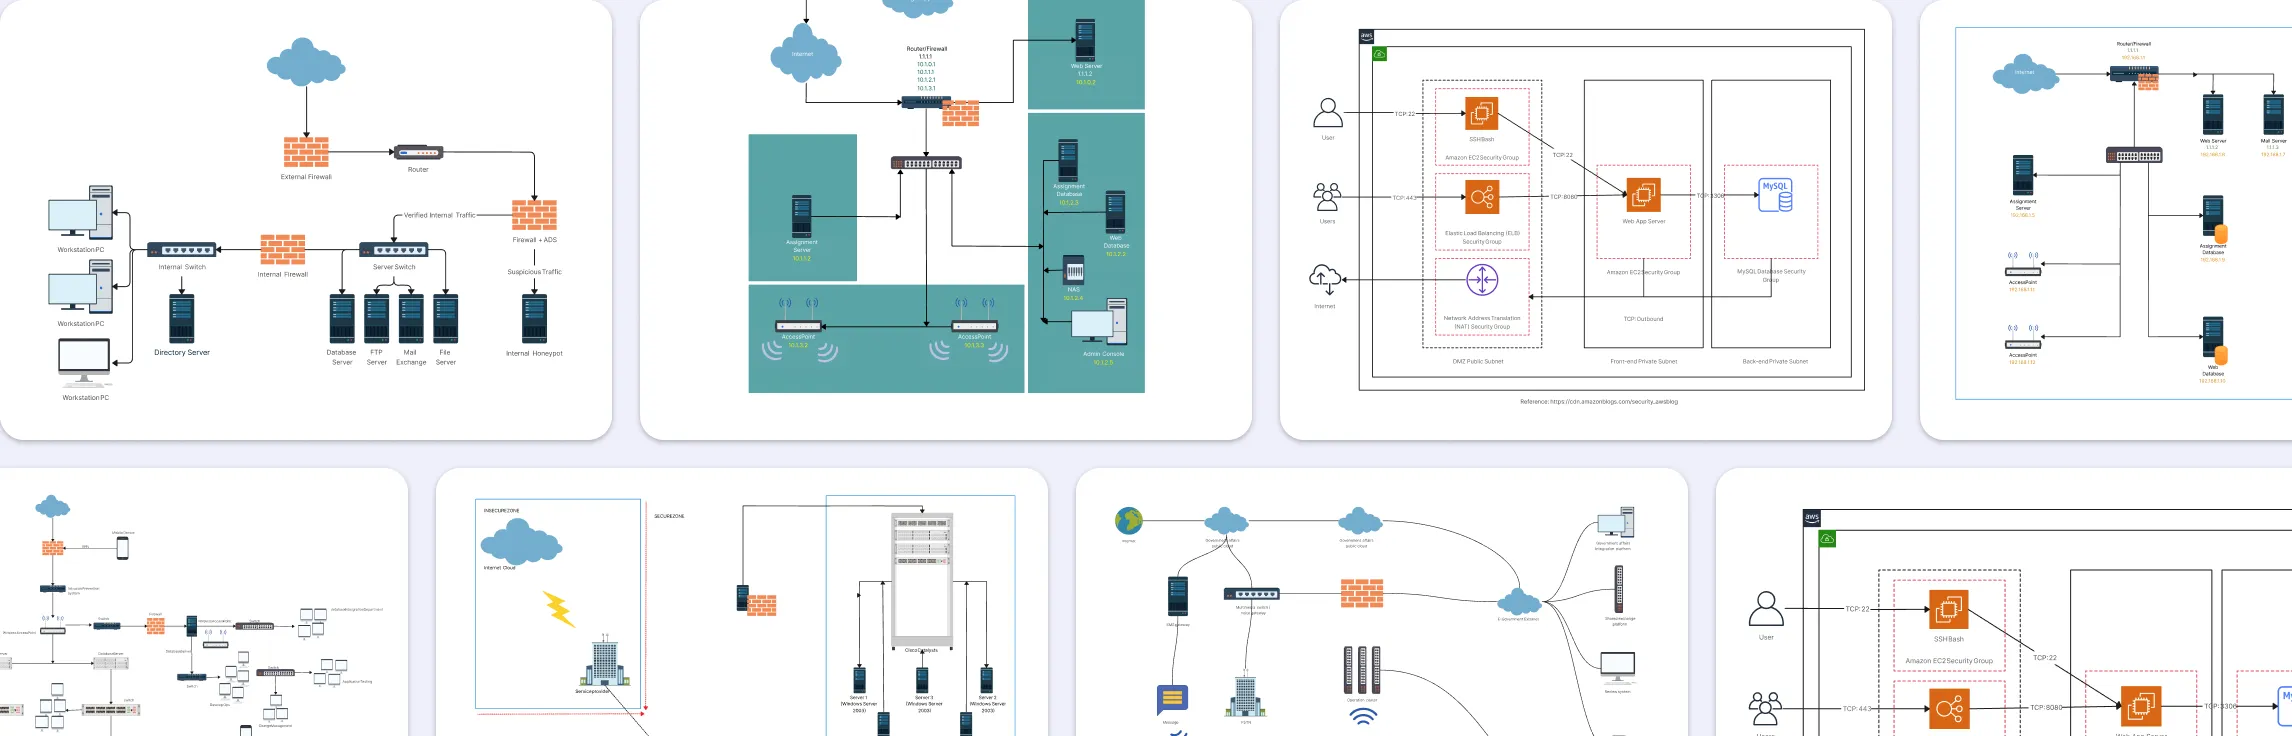
Free Templates for Mapping IT Infrastructure


FAQs About Mapping IT Infrastructure
How can mapping IT infrastructure help with system optimization and performance?
What are the key components of IT infrastructure that should be included in a mapping process?
Are there any recommended approaches or methodologies for mapping IT infrastructure?
How often should IT infrastructure maps be updated or reviewed?
What are the common challenges or pitfalls to avoid when mapping IT infrastructure?
How can IT infrastructure mapping contribute to cost optimization and efficiency?
What are some real-life examples or case studies of organizations benefiting from IT infrastructure mapping?
What is the best IT infrastructure mapping tool?
Resources
Branch, Joel W., et al. “BizMap: A Framework for Mapping Business Applications to IT Infrastructure.” 2015 IFIP/IEEE International Symposium on Integrated Network Management (IM), May 2015, pp. 1377–1383, https://doi.org/10.1109/inm.2015.7140500.
M. Gulzar, et al. “Revealing the State of the Art in Managing IT Infrastructure within Enterprises: A Systematic Mapping Study.” IEEE Access, 1 Jan. 2024, pp. 1–1, https://doi.org/10.1109/access.2024.3439093.