What Is a Project Organization Chart
A project organization chart is a simple visual map of your project team. It shows who is involved, what their roles are, and how they connect with each other. Think of it as the blueprint of your project’s people side—it makes responsibilities and reporting lines crystal clear.
At its core, it answers three big questions:
- Who’s on the team?
- What is each person responsible for?
- Who reports to whom?
Who to Include in Your Project Org Chart
A project organization chart works best when it captures all the key players and their relationships. While the exact people will vary by project size and type, here are the roles most commonly included:


Project sponsor: The senior leader or executive who provides direction, secures funding, and champions the project.
Project manager: The person responsible for planning, execution, and keeping the project on track. They act as the main point of coordination.
Core project team: Specialists and contributors who carry out the actual tasks—designers, engineers, developers, analysts, marketers, or whoever the project requires.
Functional managers or department leads: In larger projects, team members may also report to their departmental heads. Including these roles shows dual lines of accountability.
Stakeholders: Clients, partners, or external collaborators who have an interest in the project’s success.
Support staff: Roles like administrative support, quality assurance, or finance can also be added if they’re directly involved.
Types of Org Structures in Project Management
Every project team needs structure. The way you organize people—the lines of authority, decision-making, and communication—has a huge impact on how smoothly the project runs. In project management, there are a few common types of org structures.
1. Functional structure
This is the “classic” business setup. People are grouped by their skills or departments (like marketing, IT, or finance). The project work happens within these departments, and team members usually report to their department heads.

Good for: projects where specialized expertise is essential.
Challenge: the project manager has less authority, so decision-making can be slower.
2. Projectized structure
In this setup, the project is the star of the show. The project manager has full authority, and team members are assigned almost entirely to that project. Everyone reports directly to the project manager.

Good for: projects that need fast decisions and strong leadership.
Challenge: when the project ends, team members may need to be reassigned.
3. Matrix structure
This one is a mix of functional and projectized. Team members have two bosses: their department head and the project manager. The balance of power depends on the type of matrix:

Weak matrix – functional managers hold more control.
Balanced matrix – both project and functional managers share authority.
Strong matrix – the project manager has more say.
Good for: organizations juggling multiple projects with shared resources.
Challenge: dual reporting lines can sometimes cause confusion.
4. Composite Structure
The composite structure blends aspects of functional, matrix, and projectized models, rather than committing to just one. In this setup, some teams operate within departments, while others are organized around projects, all reporting upward to a central executive.
This approach is often used when an organization runs both long-term operations and temporary, high-priority projects. For instance, one division might handle ongoing maintenance work while another is dedicated to major capital projects.

Good for: organizations that need flexibility to run operations and projects in parallel without forcing everything into one rigid system.
Challenge: managing different structures side by side can create inconsistencies in leadership styles, resource allocation, and performance expectations.
5. Other variations
Some projects use less common structures, like:
- Flat structure – fewer levels of hierarchy, more collaboration.

- Divisional structure – teams organized by product lines or region

How to Use Your Project Org Chart
Creating a project organization chart is just the start—the real value comes from putting it to work. Once your chart is ready, here’s how you can use it:
In your project charter: Even at an early stage, a high-level org chart shows that you’ll need real people and resources, not just a plan. It sets expectations with sponsors and stakeholders right away.
For planning and resourcing: Use the chart to build your human resources plan, develop an organizational breakdown structure, or link it to your work breakdown structure (WBS). It also helps when creating a resource breakdown structure for scheduling.
To define responsibilities: . The chart can feed directly into your responsibility assignment matrix (RAM) or roles and responsibilities documents, making accountability crystal clear.
For communication plans: Knowing who reports to whom makes it easier to plan stakeholder communications and ensure updates reach the right people.
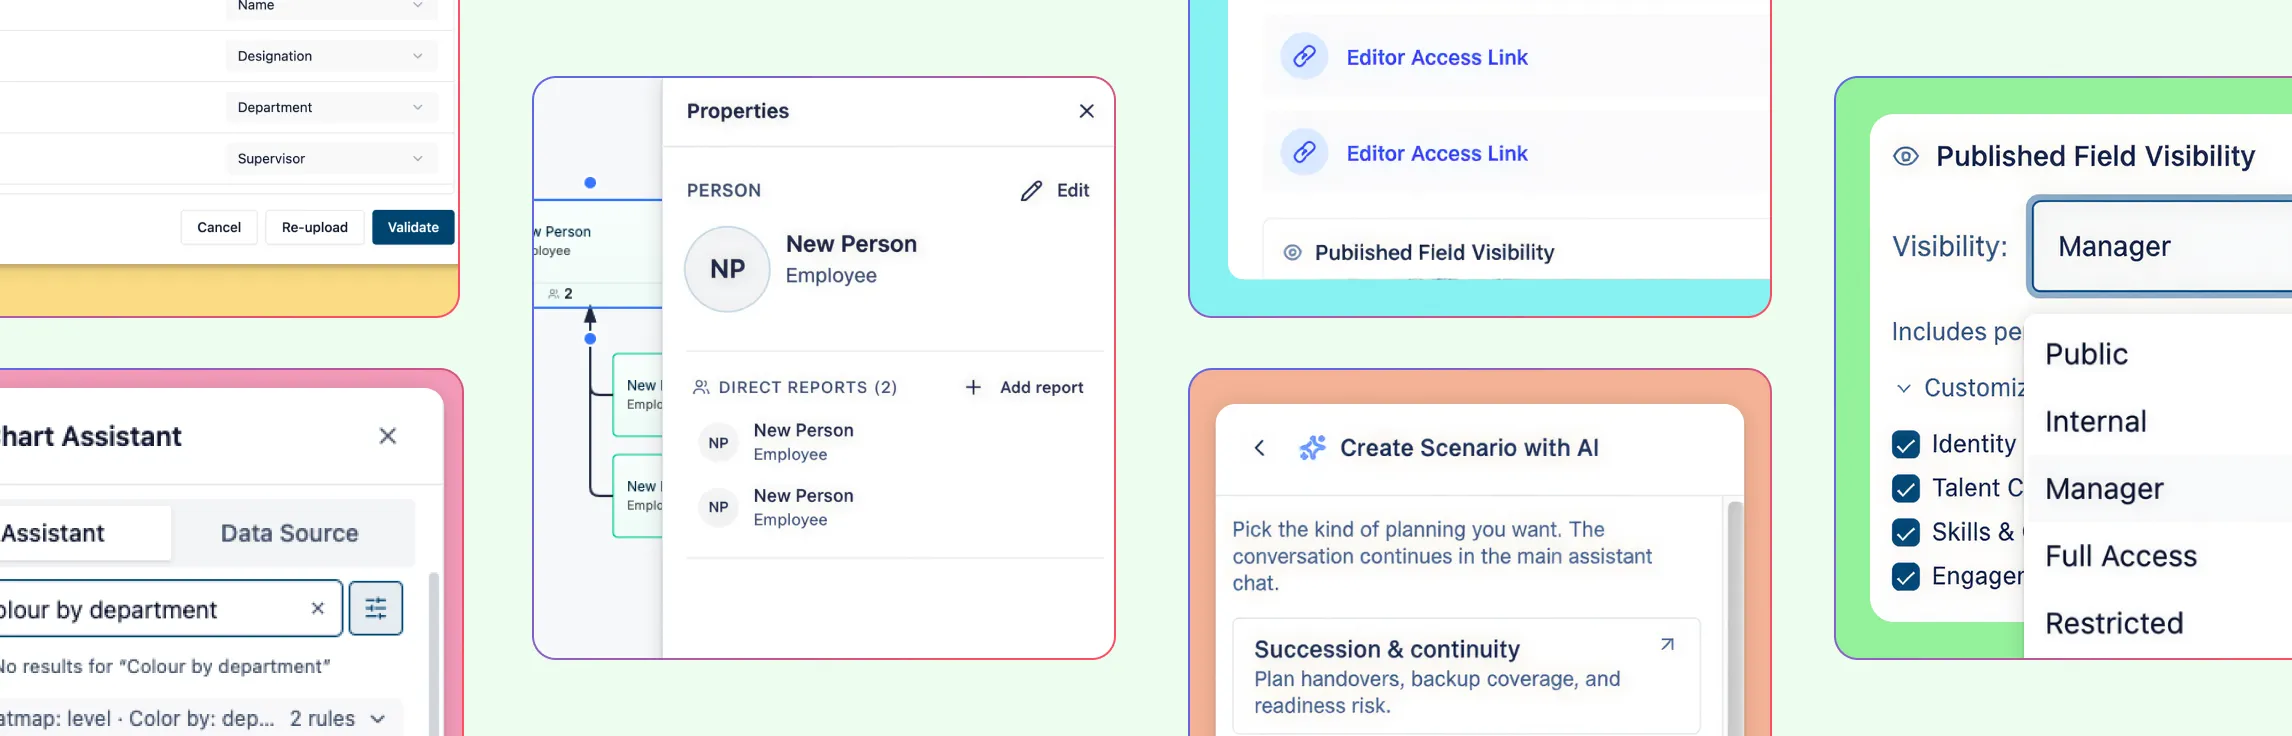
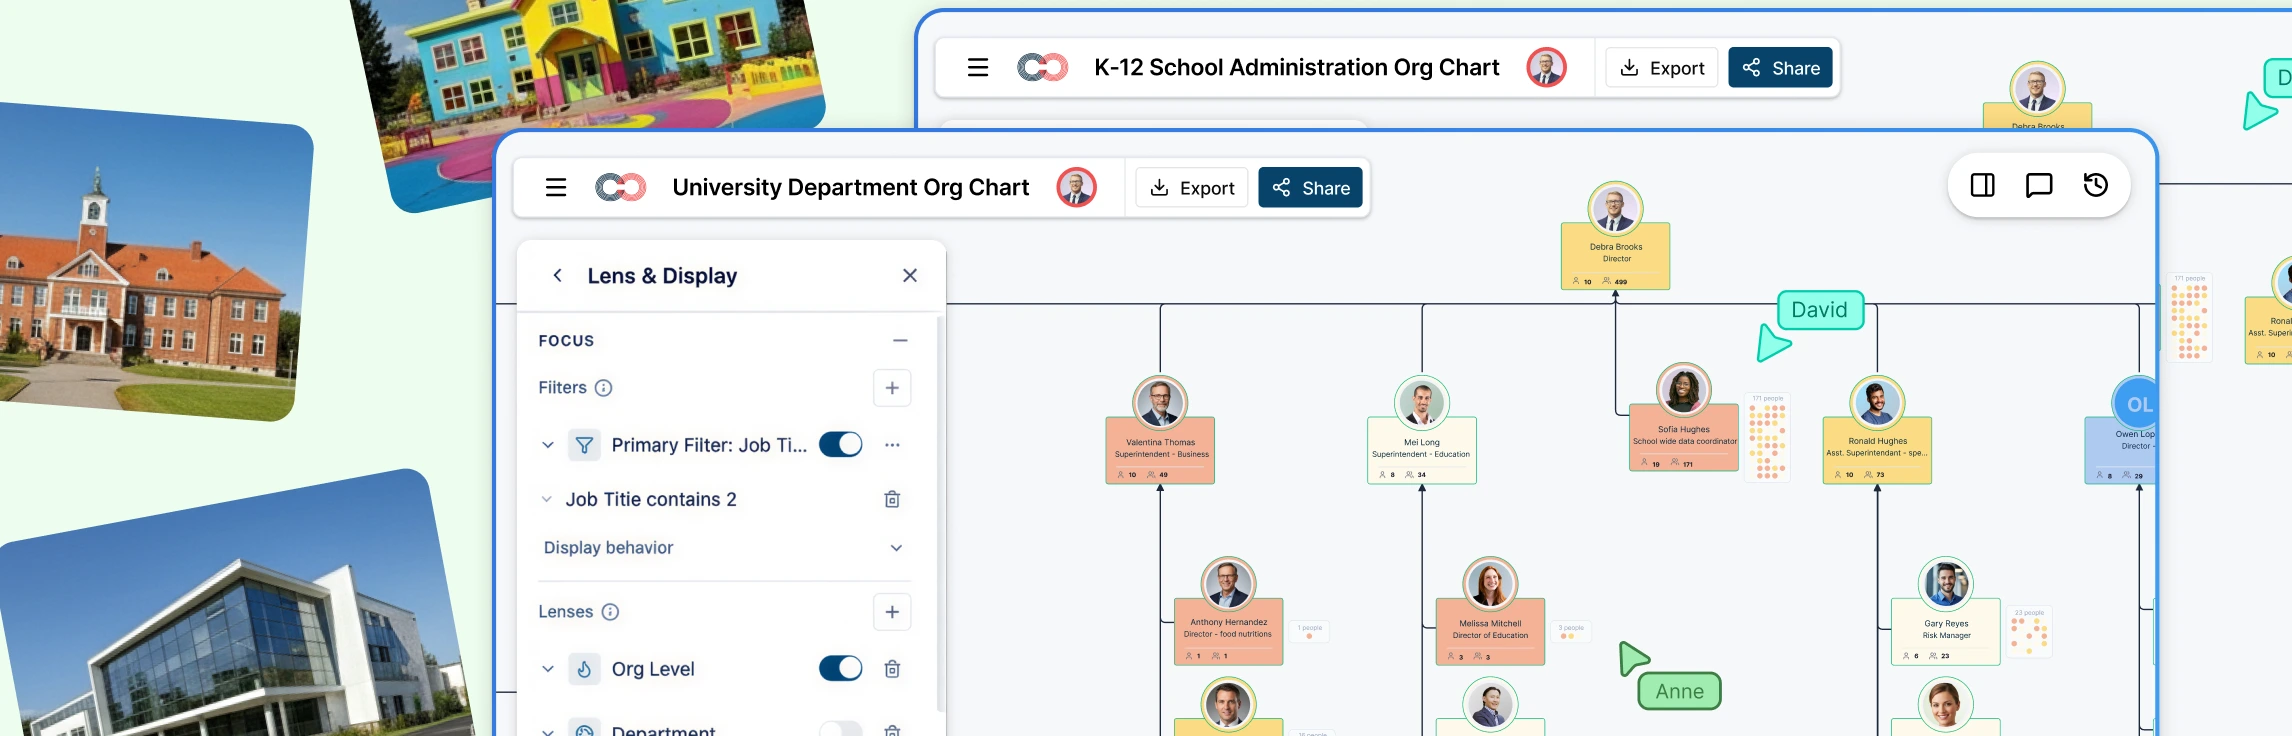
In documentation and collaboration tools: Save your chart as an image, or embed it directly into project documentation and collaboration platforms. If you’re using Creately, you can keep the chart live and editable so it’s always up to date as your team changes.
When to Use the Project Organization Chart
1. At project kickoff: When you’re launching a project, the org chart helps introduce the team, clarify roles, and set expectations. Everyone instantly sees who’s leading, who’s supporting, and how the team connects.
2. During planning: As responsibilities are being assigned, the org chart shows exactly who owns each part of the work. It helps avoid confusion or overlap in tasks before execution begins.
3. When communicating with stakeholders: Sharing the org chart with clients, executives, or external partners makes reporting lines clear. They know who to reach out to for updates, decisions, or escalations.
4. While managing the team: Throughout execution, the chart serves as a quick reference guide for the team. New members can get up to speed fast by seeing where they fit in.
5. When roles change: Projects evolve—new tasks are added, people move between roles, or responsibilities shift. Updating the org chart keeps the team aligned and avoids miscommunication.
6. At project handoff or closure: If a project is passed to another team or documented for future reference, the org chart captures the structure that made it work. This helps in lessons learned and smoother transitions.
How to Create a Project Organizational Chart
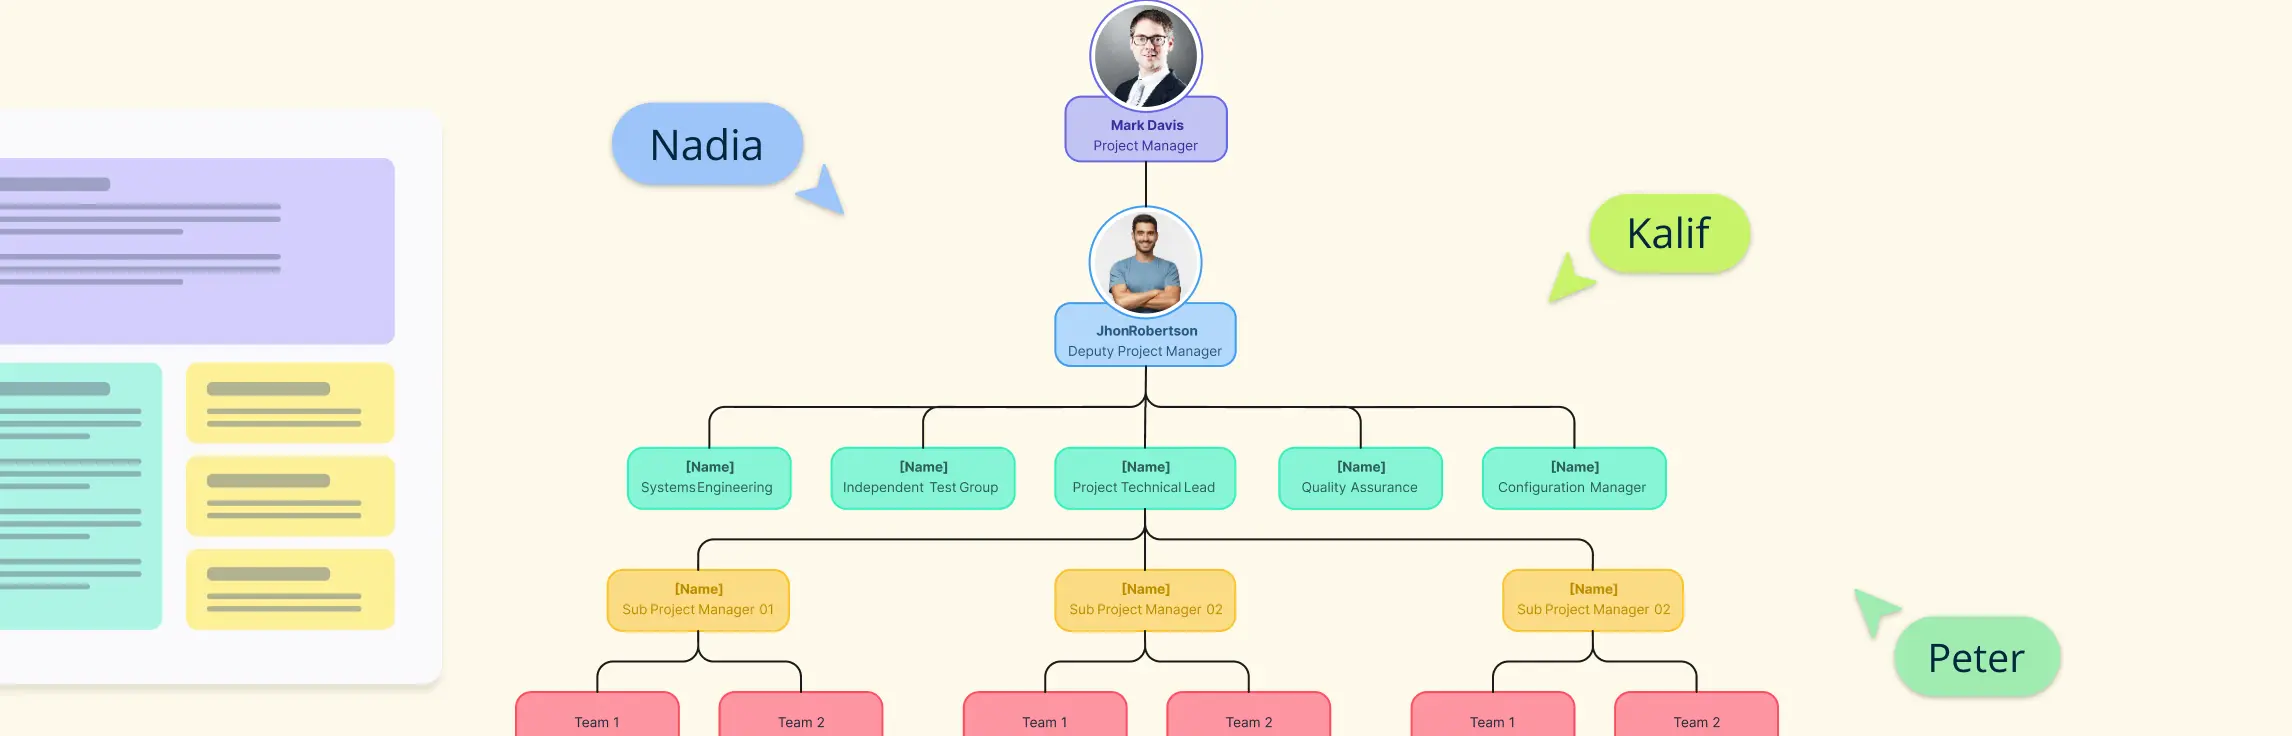
A project org chart doesn’t need to be complicated. It’s basically a visual snapshot of who’s involved in your project and how they connect with each other. Here’s how to structure your project management org chart;
Step 1. List the key people
Start with the main roles: the project sponsor at the top, then the project manager, followed by the core team members. Don’t forget to include stakeholders and support staff if they play a direct role.
Step 2. Define their responsibilities
Next to each role, outline their main duties—who makes decisions, who executes tasks, and who supports. This helps you place them in the right spot on the chart.
Step 3. Map reporting lines
Draw the relationships:
The sponsor sits at the top, providing vision and resources.
The project manager is directly below, acting as the link between leadership and the team.
The team members branch out beneath the project manager.
Stakeholders can be shown on the side, connected with dotted lines to indicate influence rather than direct reporting.
Step 4. Choose a layout that fits
Hierarchical (top-down): best for most projects—clear, simple, easy to follow.
Matrix: useful if team members report to both the project manager and functional managers.
Flat: good for small teams where everyone collaborates closely.
Step 5. Use the right tool
You can always sketch your chart on paper or in a slide deck, but that often becomes messy and hard to update. A visual collaboration tool makes the process smoother, especially when you’re working with a project team that changes or grows over time.
With Creately, for example, you can:
Drag and drop shapes to quickly build charts without needing design skills.
Connect roles with smart lines that adjust automatically as you move things around.
Add details inside the chart—like job titles, responsibilities, or even notes and attachments for each role.
Use ready-made templates for different project structures (hierarchical, matrix, flat), so you don’t have to start from scratch.
Collaborate in real time with your team, so everyone can contribute to shaping and reviewing the chart.
Keep it always up to date—when roles or reporting lines shift, just drag and adjust instead of rebuilding from zero.
Switch to presentation mode to easily share the chart with stakeholders or executives.
This way, your project org chart isn’t just a static diagram—it becomes a living document that supports communication and clarity throughout the project.
Step 6. Share and keep it updated
Once the chart is ready, share it with the whole team so everyone is on the same page. Keep it updated—when roles or responsibilities shift, refresh the chart to avoid confusion.
Free Project Organizational Chart Templates
Project Structure Org Chart

Project Organizational Chart

Project Organizational Chart Template

Org Chart for Workflow Improvement Project

Best Practices & Common Pitfalls
Keep it simple – Don’t overload the chart with too much detail. Stick to names, roles, and reporting lines. Extra info (like responsibilities or notes) can go in tooltips or attachments.
Update regularly – Projects change quickly. Review and adjust the chart whenever roles, responsibilities, or reporting lines shift.
Share widely – Make sure the org chart is visible to everyone involved—team members, stakeholders, and even new hires joining mid-project.
Match the project’s complexity – Use a flat chart for small teams, but adopt matrix or hybrid structures when projects require cross-functional collaboration.
Use collaboration tools – Digital charts (like in Creately) let you co-edit, comment, and keep everything synced in one place.
Helpful Resources
Explore rules for drawing organizational charts and org chart best practices to make your org chart more meaningful and useful.
Easily make organizational charts to visualize the reporting structure of your organization for effective HR planning and management with org chart maker.
Learn simple steps to create an org chart that fits your business, along with tips and tools to make it easy to build and update.
FAQs on Org Chart for Project Management
How to structure the project org chart?
What is the difference between a project org chart and a regular org chart?
Can a project org chart include external partners or vendors?
Can project org charts be used for remote or distributed teams?
Can project org charts help with succession planning?