A PERT chart is a graphical tool that helps you visualize the tasks, dependencies, and milestones of your project. In this blog post, we’ll explain what a PERT chart is, how it originated, what it can be used for.
What is a PERT Chart?
PERT stands for Program Evaluation and Review Technique. It is a method of project management that was developed by the US Navy in the 1950s to coordinate the Polaris missile project. A PERT chart is a diagram that shows the sequence of activities that need to be completed to achieve a project goal. It also shows the estimated time and resources required for each activity, as well as the possible risks and uncertainties.
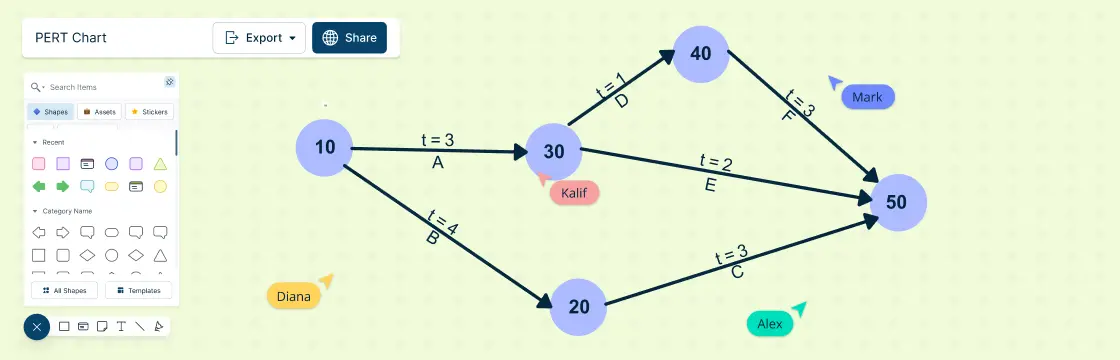
A PERT chart consists of nodes and arrows. Nodes represent activities or events, and arrows represent dependencies or relationships between them. There are two types of nodes: milestones and tasks. Milestones are significant events that mark the completion of a phase or a deliverable. Tasks are the work units that need to be performed to reach a milestone. Arrows can have different directions and lengths, depending on the type and duration of the dependency.


A PERT chart can help you:
Break down your project into manageable tasks.
Identify the critical path and the slack time of your project.
Estimate the duration and cost of your project.
Monitor and control the progress of your project.
Identify and mitigate potential risks and uncertainties.
PERT charts are widely used by project managers, engineers, consultants, researchers, and other professionals who deal with complex and uncertain projects.
Pert Chart Templates


How to Make a PERT Chart in 5 Steps
Step 1 - Define the Project Goal and Scope
What are you trying to achieve and what are the boundaries of your project?
Step 2 - Identify Major Milestones and Tasks
What are the key deliverables and work units that need to be completed to reach your goal?
Step 3 - Arrange the Milestones and Tasks in a Logical Order
What is the sequence of activities that need to be performed? Which tasks depend on others and which can be done in parallel?
Step 4 - Estimate the Time and Resources Required for Each Task
How long will it take and how much will it cost to complete each task? What are the best-case, worst-case, and most likely scenarios?
5. Draw Your PERT Chart Using a Software Tool
You can use a visual collaboration software like Creately to draw PERT charts. Connect the nodes with arrows to show the dependencies and label them with the estimated time and resources.
Advantages of Using PERT Charts in Project Management
Progress Tracking and Accountability
PERT charts help you keep track of project progress. By visualizing tasks and their dependencies, you can easily identify areas that may require more work or attention. Team members can compare their work against others in specific categories, promoting accountability.
Comprehensive Activity Analysis
To manage a project successfully, understanding the steps involved is crucial. PERT charts break down tasks, allowing project managers to evaluate each one’s impact on time and resources. Whether it’s hardware installation or end-user training, a PERT chart provides a holistic view of all requirements.
Improved Decision-Making and Planning
Integrating data from multiple sources gives a thorough understanding of projects and their impact on different departments. PERT charts reveal interdepartmental dependencies, helping managers understand how their department functions relative to other areas of responsibility.
Gaining Insights on Unforeseen Risks
Sequencing tasks using the PERT chart technique makes it easier to identify which activities need more time or attention. By considering possibilities and uncertainties related to project activities, you can better plan for contingencies .
What-If Analyses
PERT charts allow you to perform ‘what-if’ analyses. You can explore how changes (such as adding tasks or adjusting durations) impact the overall project timeline. This flexibility helps adapt to unexpected situations during project execution.
How to Make a PERT Chart with Creately?
Use ready-made templates and shapes to start your PERT chart or drag and drop nodes and arrows to create your own custom layout.
Edit the colors, fonts, icons, and styles of your PERT chart using formatting options.
Use the notes panel to add notes, attachments, and links to provide information relevant to your context.
Collaborate with your team in real-time with @mentions, comments and asynchronous editing.
Export and share your PERT chart in PNG, JPEG, PDF, SVG or get an embed link.
Conclusion
A PERT chart is a powerful tool that can help you plan and manage complex projects effectively. It can help you visualize the tasks, dependencies, milestones, time, resources, risks, and uncertainties of your project. It can also help you monitor and control the progress of your project and make adjustments as needed.
With Creately, you can create PERT charts in minutes using the readymade templates. If you want to learn more about how to use Creately for project management, check out our blog posts on how to manage projects with Gantt charts, Kanban boards and project estimation techniques.
FAQs About PERT Charts
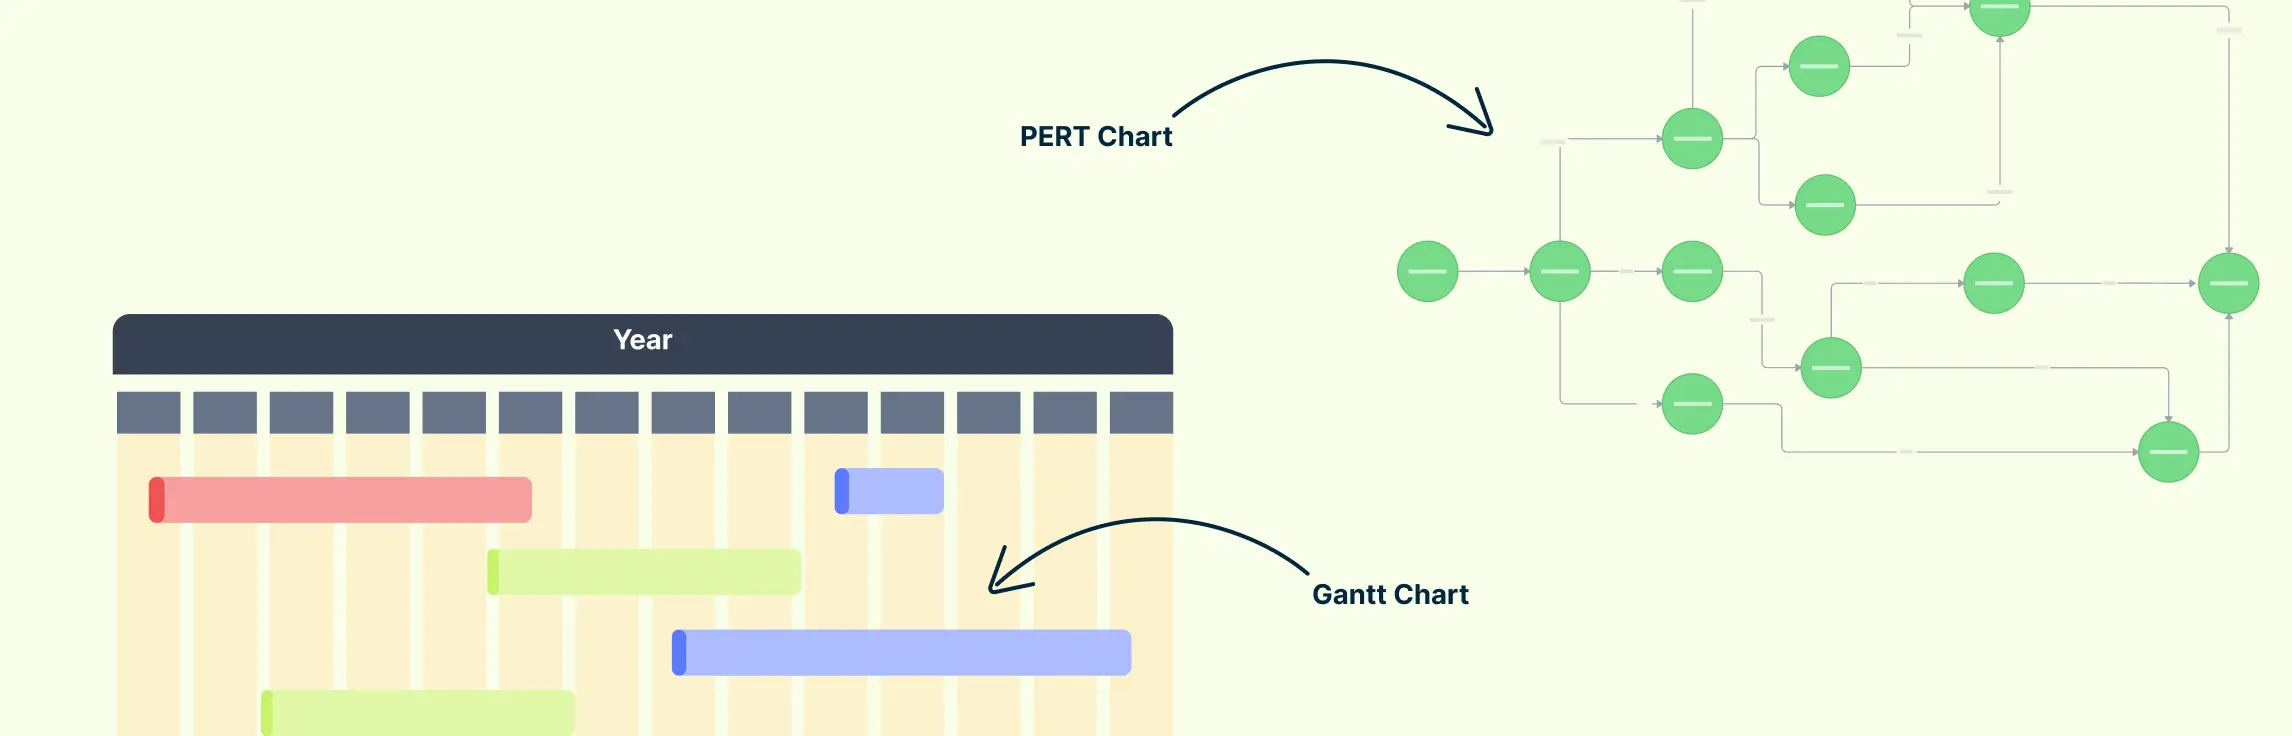
What is the difference between a PERT chart and a Gantt chart?
How do you calculate the duration of a task in a PERT chart?
(O + 4M + P) / 6, where O is optimistic time, M is most likely time, and P is pessimistic time. The method gives the most likely estimate greater weight, producing a realistic duration for planning under uncertainty.