Understanding what is a Piping and Instrumentation Diagram (P&IDs), is essential for anyone involved in process design, engineering, or plant operations. These diagrams serve as the foundation for building, analyzing, and maintaining complex systems safely and efficiently. In this guide, we’ll explore what is P and ID, their purpose, key components and real-world engineering applications.
P&ID Meaning
A Piping and Instrumentation Diagram (P&ID), sometimes informally referred to as a Process Instrumentation Diagram is a detailed technical drawing that illustrates the functional relationships between piping, equipment, instruments, and control systems within a process plant or system. Each line and symbol in a P&ID drawing carries specific meaning, showing how fluids flow, how measurements are taken, and how automation controls are applied. Engineers, operators, and maintenance teams use P&IDs to design, analyze, operate, and troubleshoot process systems safely and efficiently.
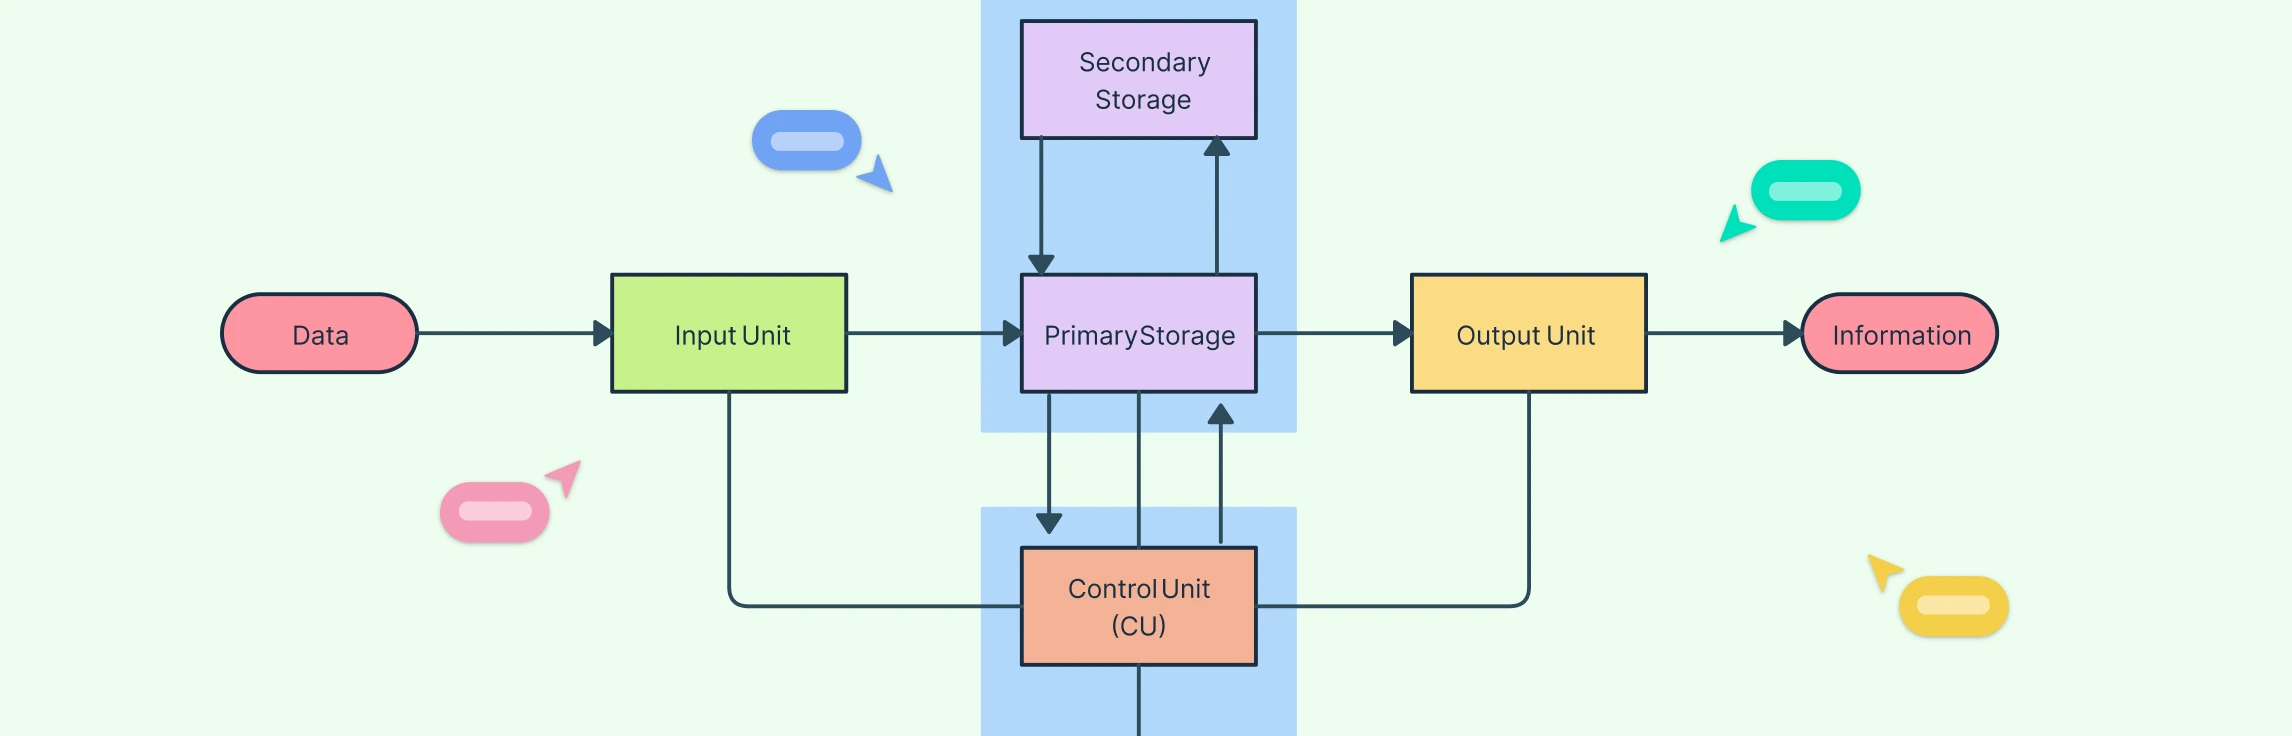
A simple P&ID Diagram Example:
Purpose of a Piping and Instrumentation Diagram
A P&ID diagram serves multiple functions across the design, operation, and maintenance stages of a process system. It provides a detailed visual reference that ensures consistency, safety, and efficiency throughout a project’s lifecycle.
Design and Engineering – Used during the design phase to plan the system layout, verify connections between equipment, and define control strategies. It helps engineers identify potential process issues early.
System Construction and Installation – Acts as a reference blueprint for piping and instrumentation setup, ensuring that contractors and technicians install components correctly and according to specifications.
Operation and Monitoring – Helps operators understand how the system functions, showing control loops, flow directions, and measurement points for efficient process management.
Maintenance and Troubleshooting – Used by maintenance teams to locate equipment, valves, and instruments, diagnose issues, and plan repairs or upgrades with minimal downtime.
Safety and Compliance – Serves as a key document for hazard analysis, safety reviews, and audits, ensuring that the system meets industry standards and regulatory requirements.
Documentation and Training – Provides a comprehensive visual reference for training new staff and maintaining accurate plant records throughout the system’s lifecycle.
When to Use a P and ID Diagram and Who Uses Them
Piping and Instrumentation Diagrams are essential across multiple stages of system design, operation, and maintenance. They serve as a universal reference for engineers, operators, and safety professionals, ensuring that every process and control interaction is clearly understood.
Process Industries: Commonly used in sectors such as oil and gas, petrochemicals, power generation, pharmaceuticals, and water treatment, where fluid flow, heat transfer, and control systems are central to operations.
Control System Design: Acts as the foundation for developing control logic diagrams, automation strategies, and loop sheets, enabling control engineers to define how sensors, controllers, and actuators interact.
System Integration and Commissioning: Used during testing and commissioning to verify that the installed systems align with design intent and that all control loops and safety interlocks function correctly before start-up.
Process Simulation and Optimization: Provides a detailed reference for process modeling and digital simulations, allowing engineers to predict system performance, optimize energy efficiency, and test operational scenarios safely.
Regulatory and Audit Processes: Serves as official documentation for regulatory submissions, plant modifications, or certifications, demonstrating compliance with industry standards such as ISA, ISO, and ASME.
Emergency Planning and Safety Analysis: Supports the development of emergency shutdown (ESD) and safety instrumented systems (SIS), helping safety teams map isolation procedures and conduct risk assessments.
Education and Technical Training: Widely used in engineering education and industrial training programs to teach process fundamentals, instrumentation principles, and system interaction.
You can use Creately’s P&ID diagram software to start making P&IDs. It comes with ready-to-use standard symbols, smart connectors, and an intuitive drag-and-drop interface that make designing accurate and compliant process layouts simple and collaborative.
Key Components of a P and ID Diagram
A Piping and Instrumentation Diagram brings together all the essential details needed to understand how a process system operates. Each element on the diagram represents a specific physical or control component within the system.
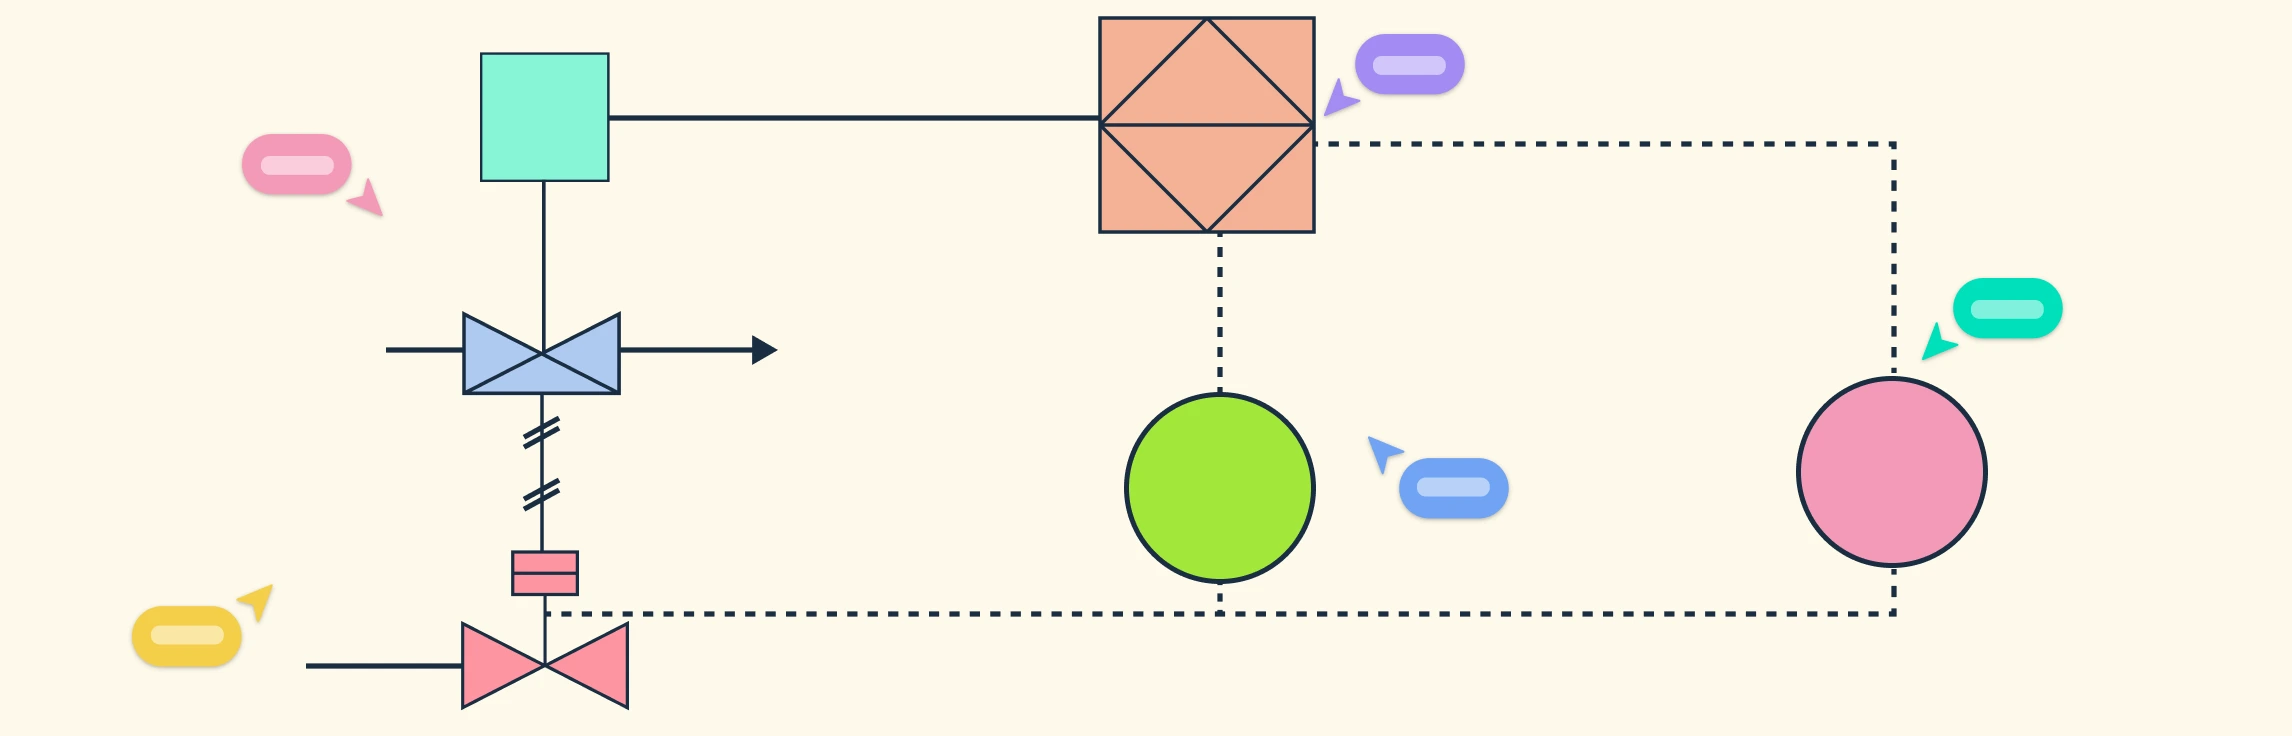
Piping and Process Lines
Show how materials such as liquids, gases, or slurries move through the system.
- Solid lines represent pipes, with accompanying letters and numbers indicating their size, material, and specification.
- Dashed lines are used to show connections to existing systems, future installations, or signal lines between instruments and controllers.
- Arrows on the lines indicate the direction of flow, while line thickness can reflect pipe diameter or pressure rating.
Equipment
Represents the major mechanical components of the process system such as pumps, compressors, tanks, vessels, and heat exchangers that handle or transfer materials. Each piece of equipment is identified by a unique tag or label for quick reference during design, operation, or maintenance.
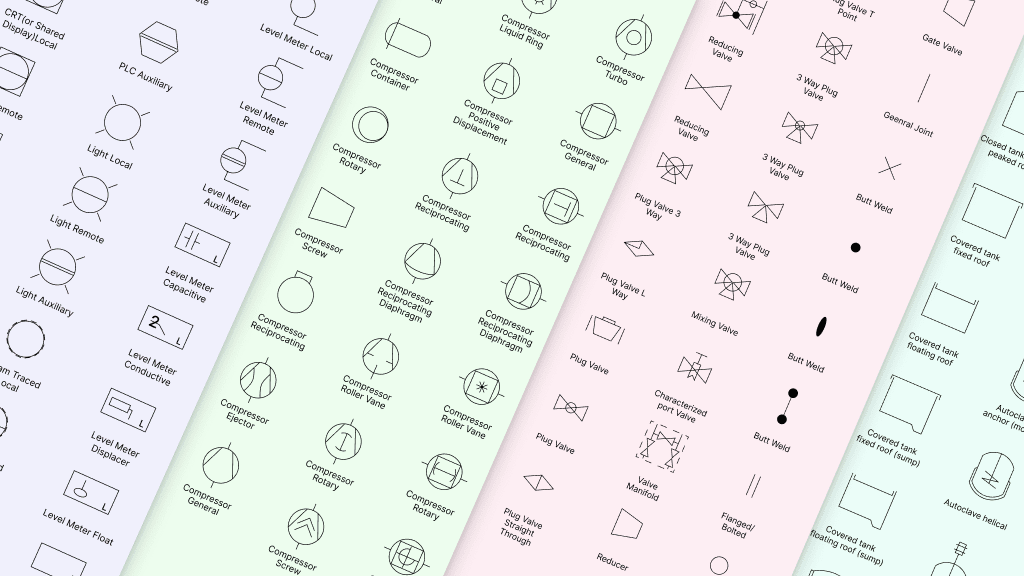
Pumps: Shown as circles with triangles pointing in the direction of flow. The triangle’s orientation indicates how the pump moves fluid. Symbols vary for centrifugal, positive displacement, and diaphragm pumps.
Vessels: Represented as cylindrical or vertical shapes for tanks, reactors, or columns. Internal components like agitators, trays, or heating coils may also be shown.
Heat Exchangers: Depicted with standardized symbols indicating their type, such as shell-and-tube or plate exchangers, often labeled by service (e.g., Condenser or Cooler).
Valves and Fittings
Indicate how the flow of materials is controlled within the system. Different valve types are represented by unique symbols, such as gate, globe, check, or butterfly valves, and may include details about their actuation method (manual, pneumatic, electric, or hydraulic). Fittings like elbows, reducers, and tees show changes in direction or diameter within the piping network.
Instruments
Represent sensors, transmitters, controllers, and indicators that measure and regulate process variables such as pressure, flow, temperature, or level. Each instrument follows standardized ISA tag conventions (e.g., PT-101 for Pressure Transmitter 101 or LT-202 for Level Transmitter 202). Dashed signal lines show how instruments are connected to control systems — whether electrical, pneumatic, or digital.
Flow Direction and Connection Symbols
Arrows indicate the direction of fluid flow throughout the system. Connection symbols such as tees, junctions, and connectors illustrate how pipes and instruments link to equipment. Dots at intersections represent actual connections, while crossing lines without dots indicate no physical connection.
How to Make P&ID Diagrams
Let’s walk through a step-by-step process to understand how P&IDs are created and how each element comes together to form a complete diagram.
Step 1: Gather Process Information
Begin with a Process Flow Diagram (PFD) to understand the main process streams, equipment, and flow direction. Collect details such as equipment specifications, line sizes, valve types, and instrumentation requirements from datasheets and design documents. Confirm process conditions (pressure, temperature, and flow) that will influence the selection of control elements.
Step 2: Add Major Process Components
List all process equipment such as tanks, pumps, heat exchangers, vessels, and compressors. Drag and drop P&ID symbols from Creately’s shape library for the relevant equipment components. Arrange them logically on the canvas to show the sequence of operations, not their physical locations. Assign unique equipment tags or identifiers (e.g., P-101, T-201).
Step 3: Add Piping and Flow Lines
Draw main process lines connecting major equipment. Use different line styles and thicknesses for process, utility, pneumatic, and hydraulic systems. Include flow direction arrows and line numbers with size and material codes. You can use Creately’s smart connectors to easily define line relationships. They automatically adjust when equipment is moved or repositioned.
Step 4: Insert Valves and Fittings
Add appropriate valve and fitting symbols (e.g., gate, globe, control, check, or relief) following standard notation. Differentiate manual valves from automated or actuated valves using dashed control or signal lines.
Step 5: Add Instruments and Control Loops
Add transmitters, indicators, and controllers and connect instruments with dashed lines to represent signal or control relationships. Group related instruments into control loops with consistent numbering (e.g., TIC-101 for a temperature loop). You can use Creately’s grouping and tagging features to organize instrument loops and maintain numbering consistency.
Step 6: Annotate and Label the Diagram
Label lines, equipment, and instruments using standardized abbreviations. Add operating notes, design parameters, and setpoints where needed, and include a legend, revision block, and title information such as process name, drawing number, date, and drafter or approver details. Creately’s Notes panel allows you to attach these details directly to specific diagram elements, making it easier for teams to track design changes, share feedback, and maintain version accuracy in one collaborative workspace.
Step 7: Verify Standards and Accuracy
Check compliance with ISA S5.1, ISO 14617, and ANSI/ISA-5.1 symbol standards. Cross-check against the PFD and equipment datasheets for consistency. Review for readability, loop completeness, and correct tagging before final approval. Invite your team members to comment, verify, and approve diagrams in real time for higher design accuracy.
Limitations and Benefits of P&ID Design
Benefits of P&IDs | Limitations of P&IDs |
Comprehensive Process Visualization – Clearly shows how equipment, pipelines, valves, and instruments interact within a system. | Not to Scale – Represents schematic relationships only but doesn’t show actual physical distances or layout. |
Improves Communication – Acts as a universal reference between design, operations, and safety teams, reducing misinterpretation. | Lacks Real-Time Data – Does not display live operating parameters like pressure, temperature, or flow. |
Supports Control System Design – Forms the basis for automation logic, loop diagrams, and control strategies. | Limited Mechanical Details – Doesn’t include fabrication data, material specifications, or component dimensions. |
Enhances Safety and Compliance – Highlights safety systems, relief devices, and interlocks for regulatory approval. | Requires Cross-Referencing – Must be used with process flow diagrams, layout drawings, and datasheets for complete understanding. |
Aids Troubleshooting and Maintenance – Helps identify equipment, locate signals, and trace process issues efficiently. | Can Become Outdated – Needs continuous updates after design changes, retrofits, or maintenance activities. |
Useful for Training and Documentation – Provides a standard learning tool for new engineers and operators. | Dependent on Accurate Symbols – Misuse or inconsistency of symbols can lead to errors in interpretation. |
P&ID Vs. Process Flow Diagram
While both Piping and Instrumentation Diagrams and process flow diagrams (PFDs) are essential tools in process engineering, they serve different purposes and present different levels of detail. Understanding the distinction between the two is important because confusing one for the other can lead to design errors, miscommunication, or incomplete documentation during system development and review.
Aspect | Process Flow Diagram (PFD) | Piping and Instrumentation Diagram (P&ID) |
Purpose | Conceptual process overview | Detailed engineering and control documentation |
Detail Level | High-level (major equipment and flows) | Detailed (pipes, valves, instruments, and control systems) |
Focus | Material and energy flow | Physical layout and control logic |
Used By | Process engineers | Mechanical, control, and operations engineers |
Includes | Major process streams and key equipment | Equipment, piping, valves, instruments, and signals |
Use Stage | Early design and process analysis | Detailed design, construction, operation, and maintenance |
If you need to make PFDs, use Creately’s process flow diagram software to visualize process steps and material flow with precision. It offers standardized symbols and templates for creating accurate, compliant diagrams.
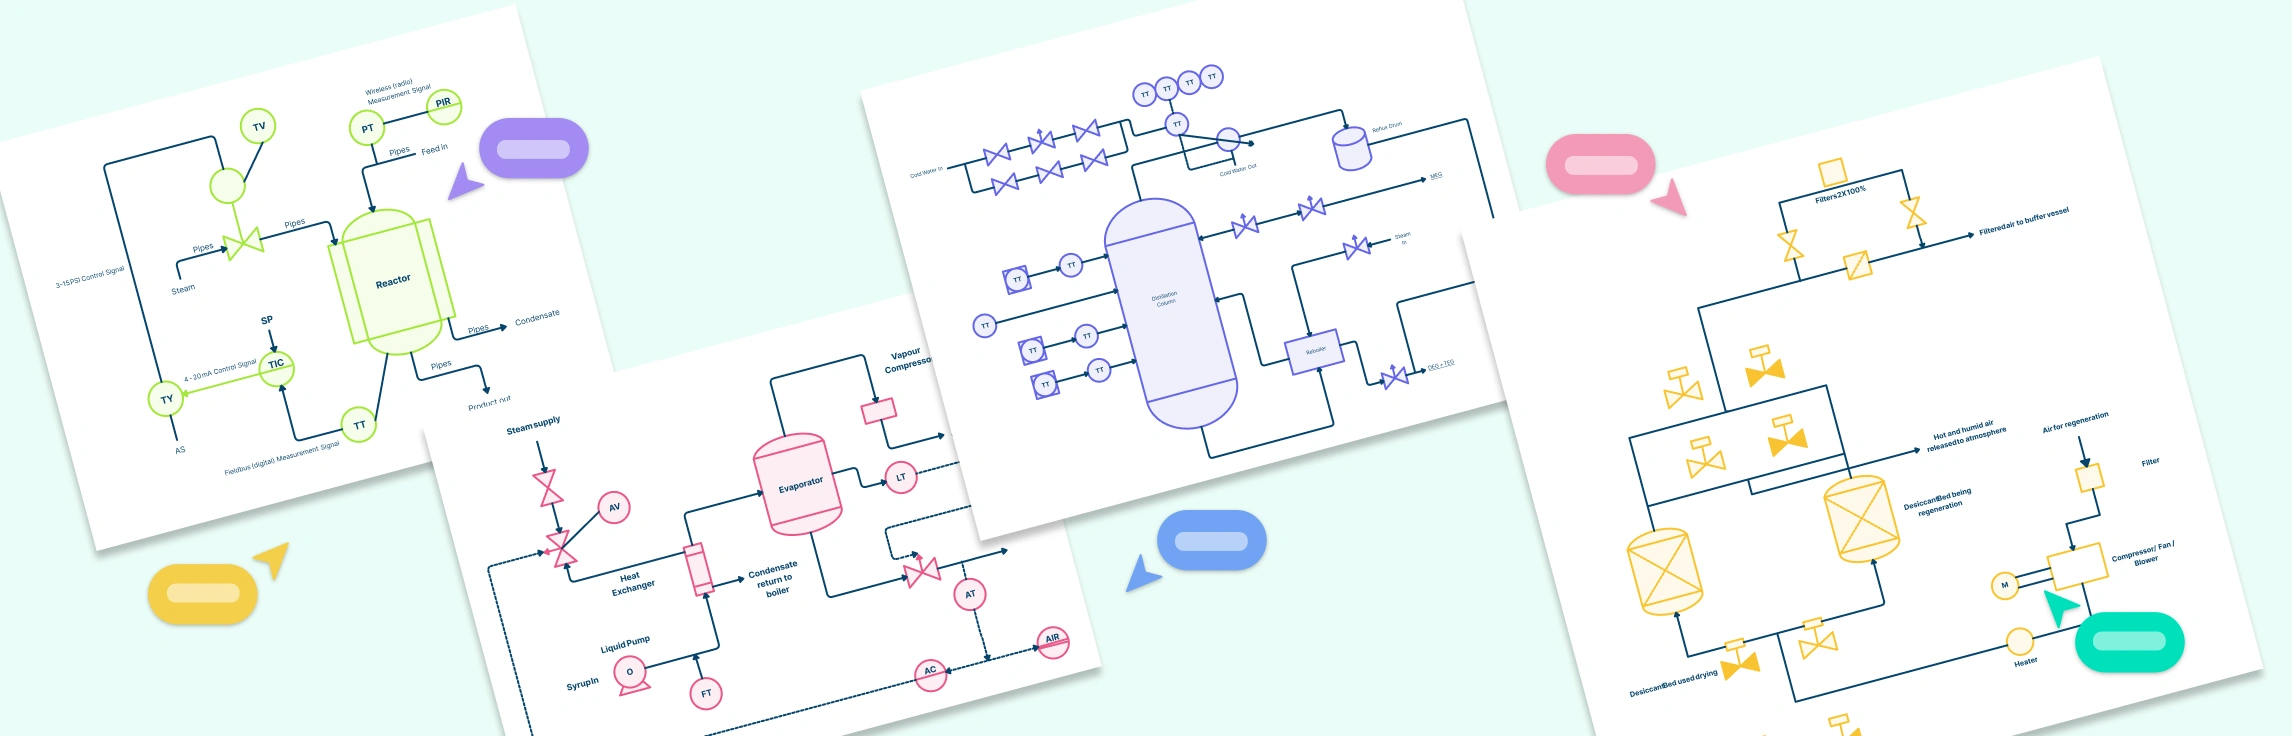
Free P&ID Diagram Templates to Get Started


FAQs about Piping and Instrumentation Diagrams
Can a P and ID diagram be updated after installation?
How are revisions tracked in a P&ID diagram?
Can a single P&ID drawing cover an entire plant?
Are P&ID diagrams to scale?
Resources
Liu, Shengyong, et al. A Complete Piping Identification Solution for Piping and Instrumentation Diagrams. 17 Dec. 2023, https://doi.org/10.1109/hpcc-dss-smartcity-dependsys60770.2023.00011.
Uzuner, Hülya, and Gerhard Schembecker. “Knowledge Based Design of Piping and Instrumentation Diagrams.” Chemie Ingenieur Technik, vol. 84, no. 5, 5 Apr. 2012, pp. 747–761, https://doi.org/10.1002/cite.201100230.