This guide walks you through the steps for how to create a process map in Excel, highlights the challenges you may encounter on the platform, and introduces a more efficient alternative for teams that need faster, clearer, and more scalable process mapping.
What is a Process Map?
A process map is a visual diagram that outlines the steps, decisions, and flow of a workflow or business process. It uses shapes, connectors, and labels to show how tasks move from one stage to the next, how information flows, and where responsibilities sit. Process maps make it easier to understand how a process works, identify bottlenecks, and spot opportunities for improvement. They can be used for simple or complex workflows, but creating a clear, well-structured map often requires careful layout and formatting to keep everything organized.
Read the process mapping guide to learn about different ways of process mapping, their symbols, and who uses them.
How to Make a Process Map in Excel
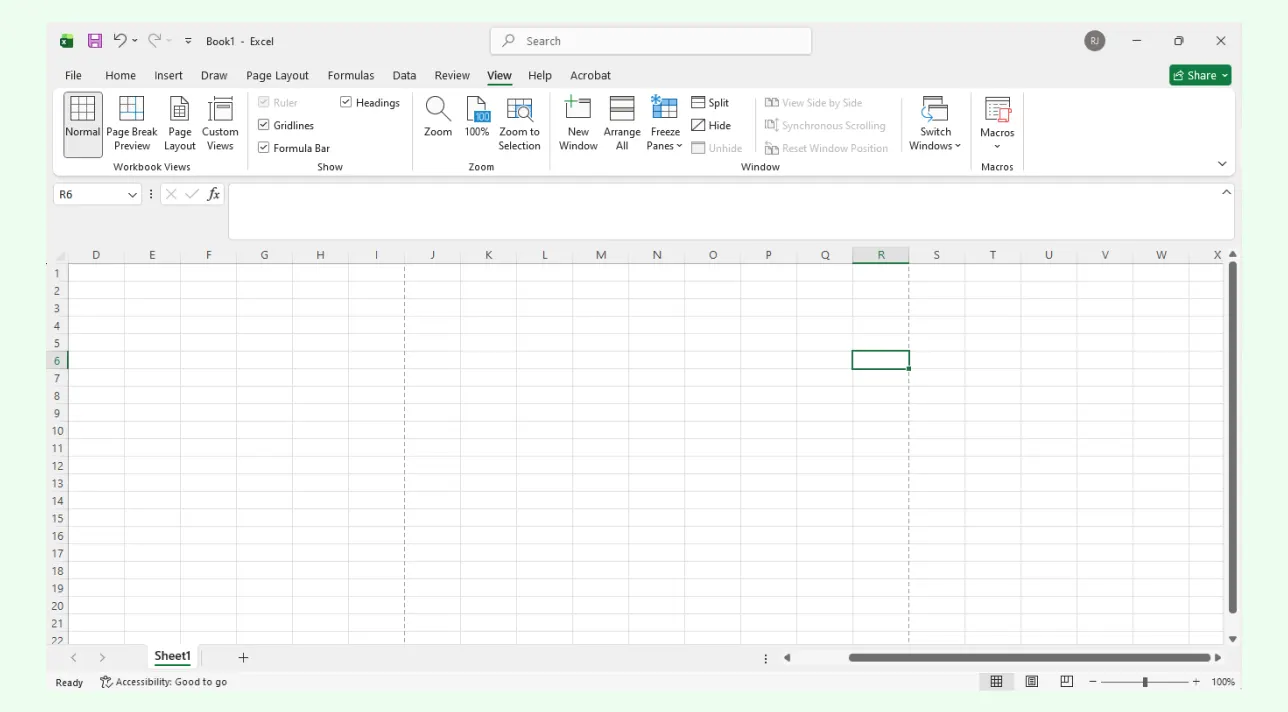
Step 1: Open a Blank Worksheet
Start with a clean sheet so you have enough space to place and arrange shapes. Excel’s grid layout isn’t built for diagramming, so give yourself room to work.
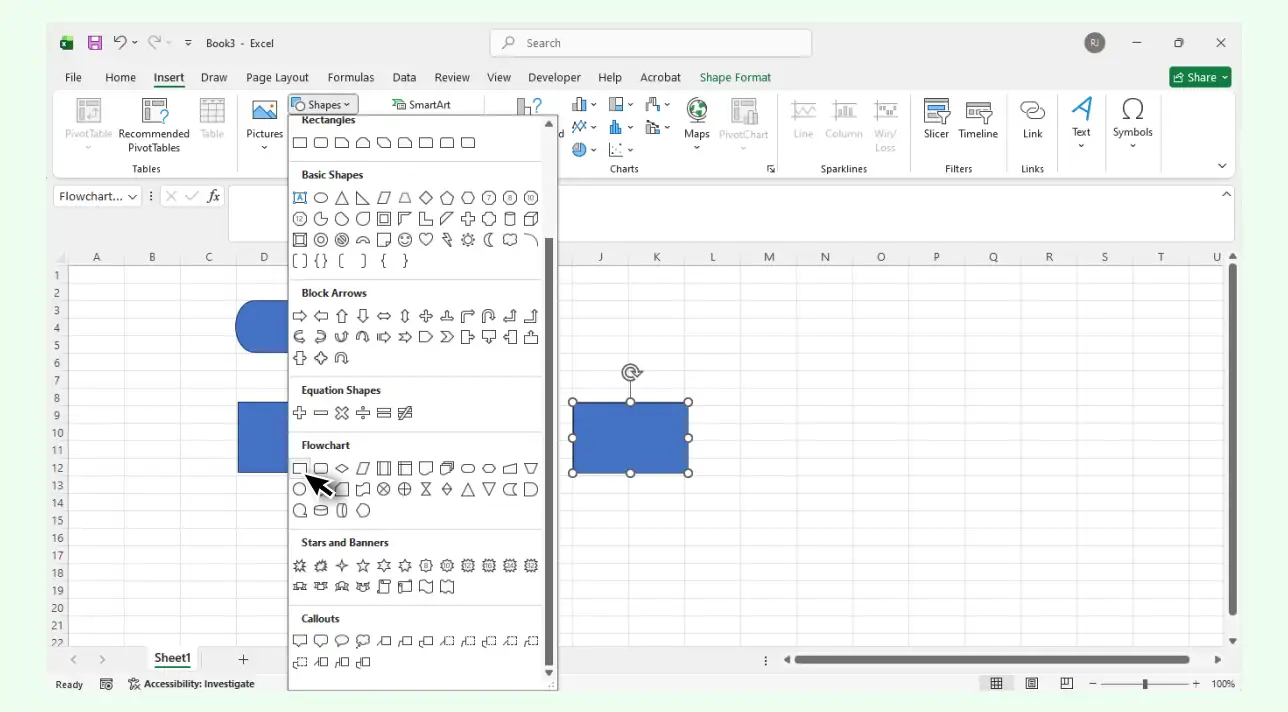
Step 2: Insert Process Map Shapes
Go to Insert → Illustrations → Shapes and choose from the Flowchart category (Process, Decision, Terminator, etc.). Drag each shape onto the worksheet. Excel provides only a basic set of shapes, so you may need to adapt them for more detailed processes. Read the process mapping symbols guide to learn about these shapes and what they are used for.
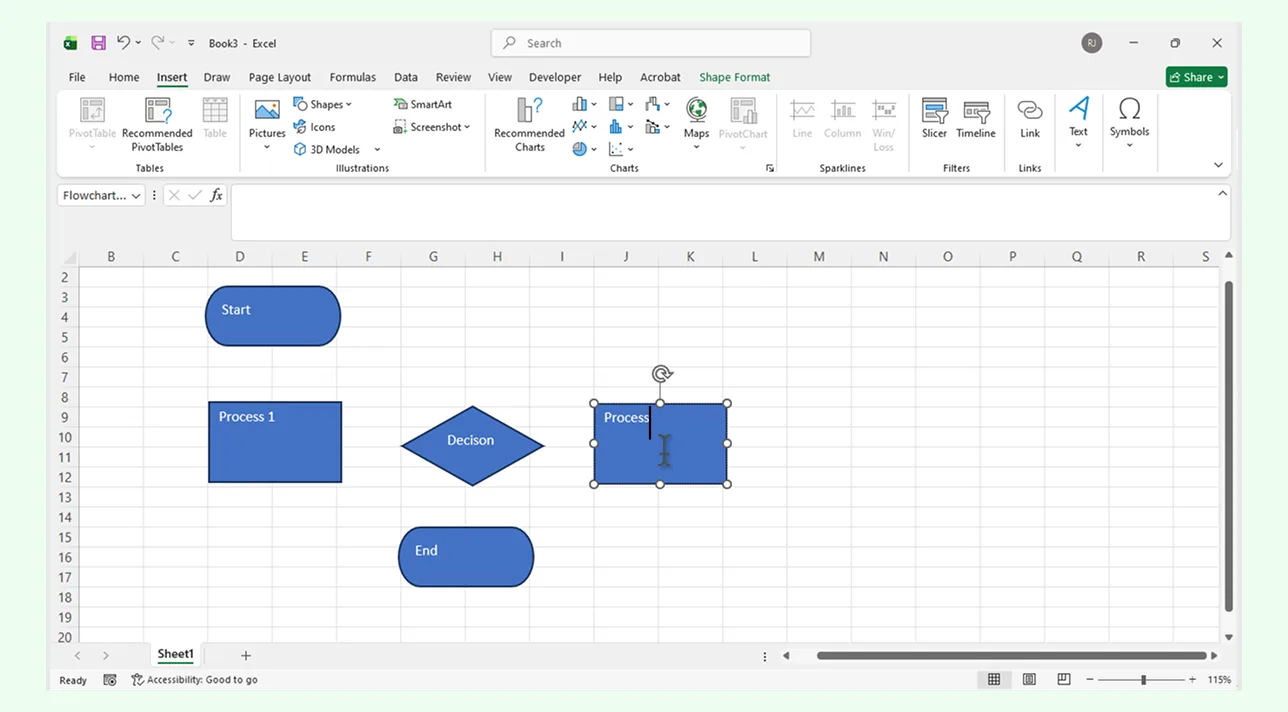
Step 3: Add and Label Each Step
Click inside each shape and type the step name or action. You can resize shapes by dragging their edges, though keeping everything visually aligned may take a bit of manual adjustment.
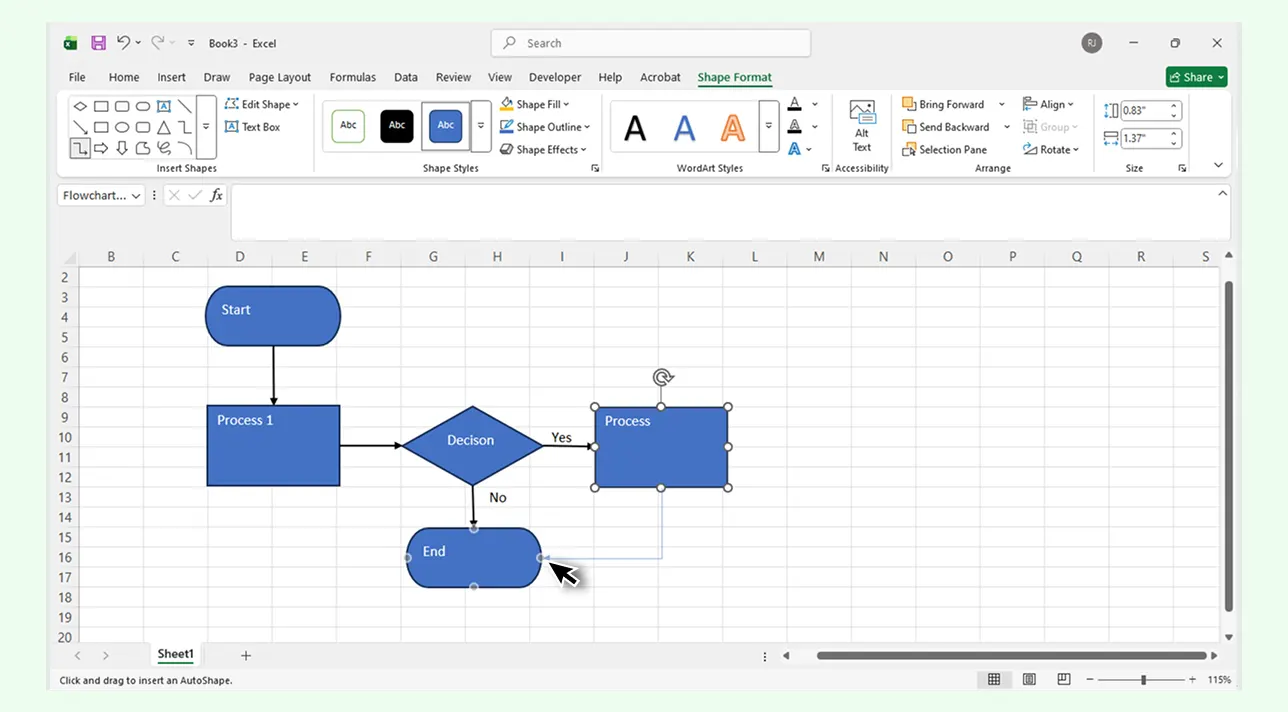
Step 4: Connect the Shapes
Use Insert → Shapes → Lines/Arrows to connect the steps. Be prepared to reposition connectors occasionally. Excel’s lines don’t always stay attached when shapes move.
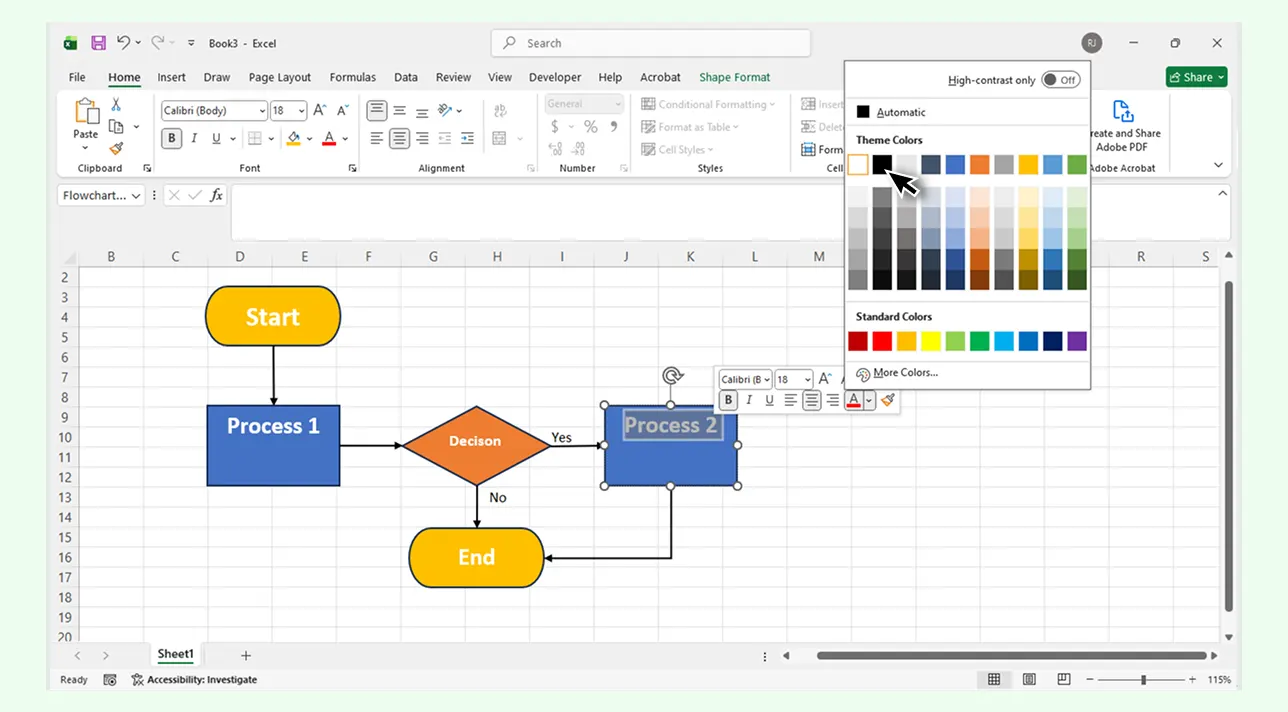
Step 5: Format Your Diagram
Use Shape Format options to change colors, outlines, fonts, and text alignment. Excel’s styling tools are basic, so refining the layout may take extra tweaking as the diagram grows.
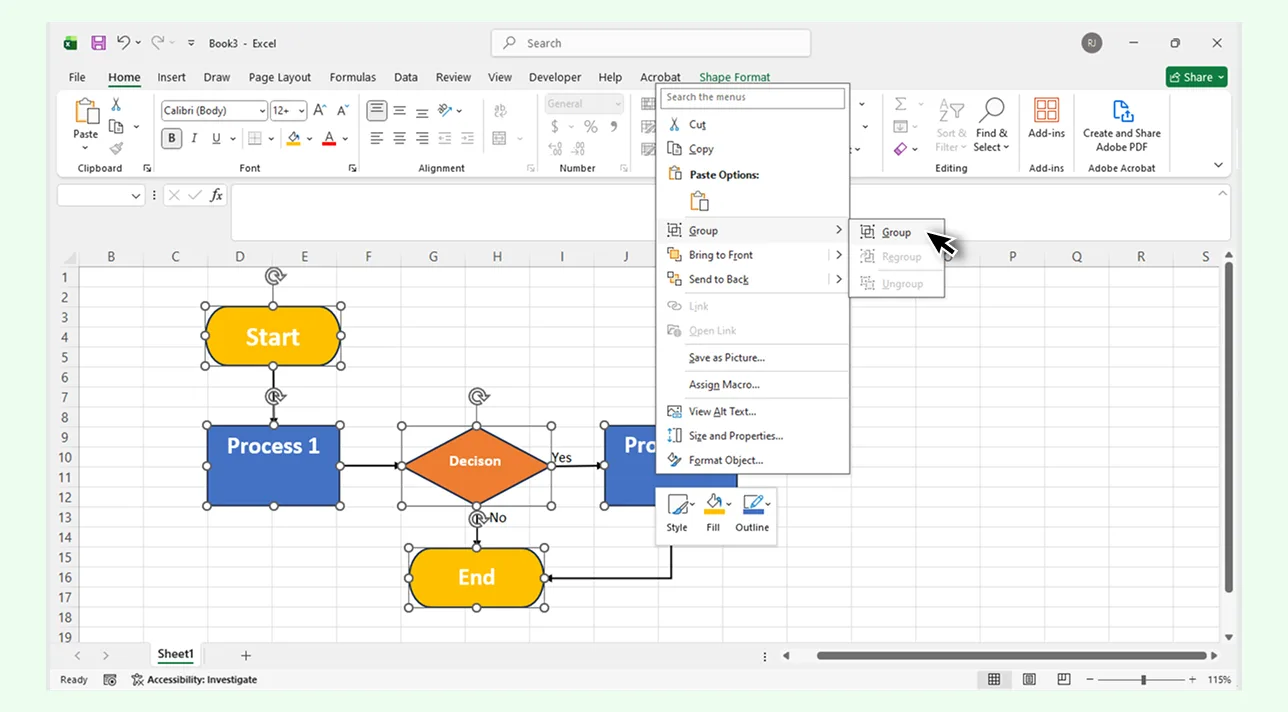
Step 6: Organize and Group the Elements
Select all relevant shapes and connectors → Right-click → Group. Grouping helps keep the diagram intact when moving or resizing, which is useful given Excel’s limited diagram structure controls.
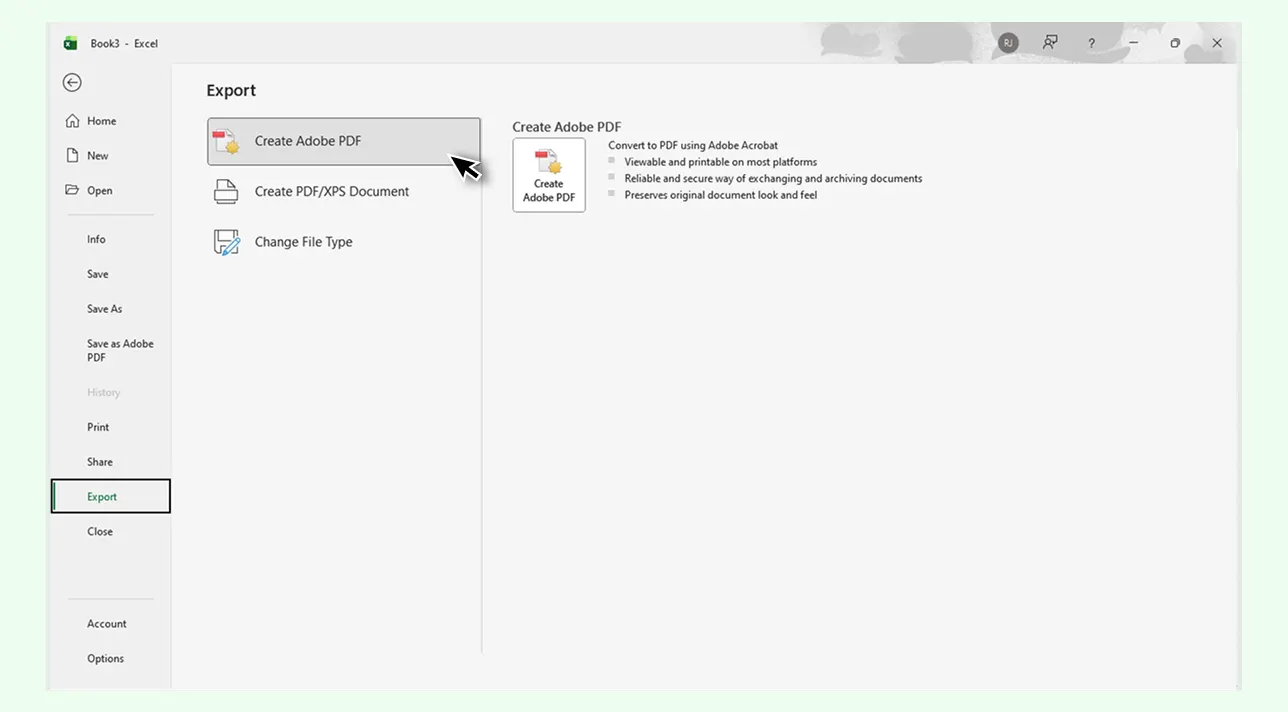
Step 7: Share or Export Your Process Map
You can share the Excel file directly, or go to File → Save As to export it as a PDF or image. Just note that large diagrams may shift slightly when exported or opened on different screens, since Excel isn’t optimized for visual layouts.
Challenges of Making a Process Map in Excel
While Excel can handle basic diagrams, several challenges become noticeable as your process map grows in size or complexity.
Limited diagramming tools: Excel wasn’t built for visual workflows, so every shape, line, and label must be added and arranged manually.
No smart connectors: Lines don’t stay attached when shapes move, leading to constant readjusting as you refine the diagram.
Basic shape library: Only a small set of flowchart symbols is available, which can make it difficult to represent detailed or industry-specific processes accurately.
Difficult to scale: Large diagrams quickly become cluttered on a fixed spreadsheet grid, making it harder to maintain clarity as steps increase.
Time-consuming formatting: Keeping spacing, alignment, and colors consistent requires manual effort, especially in bigger maps.
Limited collaboration: Multiple people editing shapes in the same file often causes layout issues, and real-time co-editing isn’t optimized for diagrams.
Export inconsistencies: When saving or exporting as a PDF or image, diagrams may shift or lose alignment due to Excel’s page-based formatting.
Because of these limitations, many teams eventually turn to dedicated process mapping tools like Creately, which offer smarter connectors, ready-made templates, scalable canvases, and real-time collaboration designed specifically for visual workflows.
Why Creately is the Best Alternative for Creating a Process Map
If you want a faster, clearer way to map and improve business processes, Creately’s process mapping software offers everything Excel struggles with. Here’s why it’s the smarter choice for building process maps:
Ease of Use & Canvas Flexibility
No fixed grid limitations: Work on a flexible, infinite canvas instead of trying to fit diagrams into Excel’s rigid cell layout.
Unrestricted layout control: Move, resize, and reorganize sections freely without being constrained by spreadsheet rows and columns.
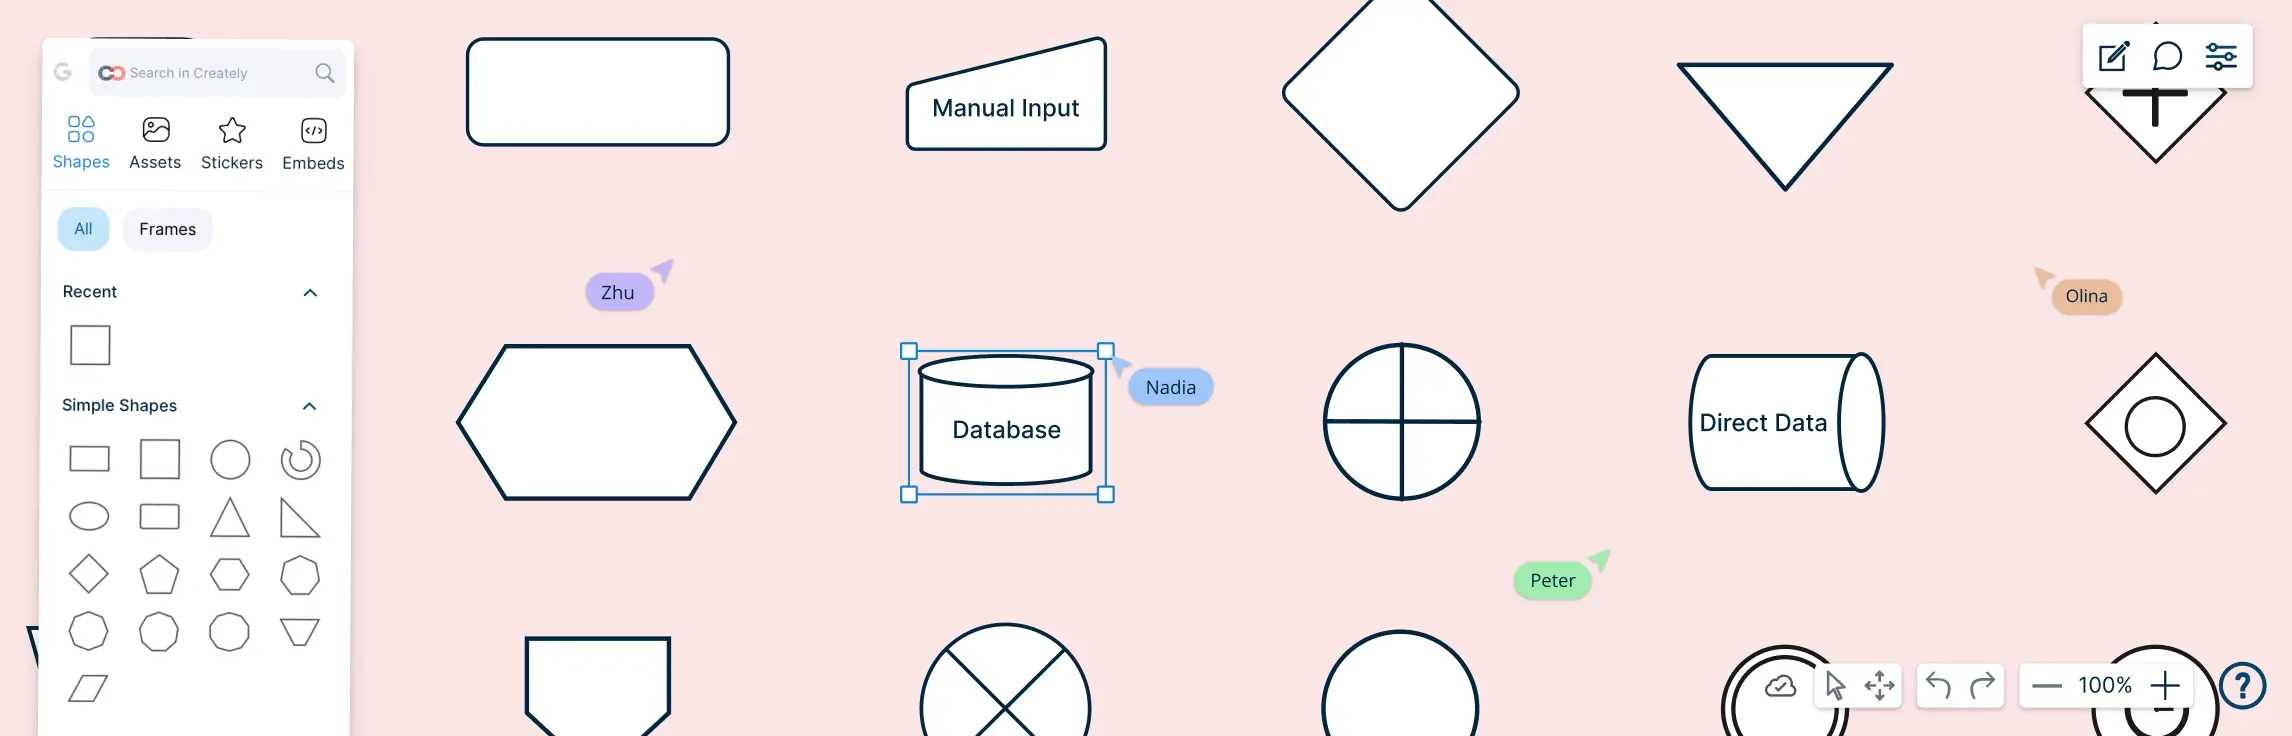
Symbols, Shapes & Templates
Complete set of process mapping symbols: Access a wide library of flowchart, workflow, and process mapping shapes, not just Excel’s limited defaults.
Ready-made templates: Start instantly with templates for workflows, SOPs, swimlanes, value streams, and more.
Reusable components: Create custom elements you can reuse across multiple diagrams for faster, more consistent mapping.
AI Flowchart Generator
Instant Diagram Creation: Generate flowcharts and process maps instantly from a short prompt. Creately’s AI flowchart generator arranges the layout, steps, and connectors automatically, giving you a complete diagram within seconds.
Smart AI Suggestions: Receive intelligent prompts for additional steps, related actions, and grouped stages to ensure your process maps stay structured, comprehensive, and easy to follow.
Connectors & Layout Behavior
Smart connectors that stay attached: Move steps freely while connectors automatically adjust without breaking or detaching.
Easy revision workflow: Snap-to-grid alignment, auto-spacing, and smart guides keep the layout clean as your process evolves.
Styling & Visual Quality
Clean, professional visuals: Themes, presets, and styling tools help you produce polished diagrams without heavy manual formatting.
Consistent styling across diagrams: Apply unified design rules to keep every part of your process map visually aligned.
Collaboration & Teamwork
Real-time collaboration: Collaborate live with comments, multi-cursor editing, and shared updates—much smoother than co-editing in Excel.
Context-rich communication: Add notes, feedback, and decisions directly on the diagram so your team stays aligned.
Scalability & Process Documentation
Effortless scaling: Map simple tasks or multi-layered workflows without running out of space or losing clarity.
Full process documentation: Add notes, attach files, and link related workflows to create comprehensive documentation in one space.
Consistent modeling across diagrams: Update a process once and Creately automatically syncs changes across all connected maps.
Creately Vs Excel: Which Is Better for Process Mapping?
Here’s how creating process maps in Excel compares to using Creately’s purpose-built process mapping tools.
Feature | Excel | Creately |
Process Mapping Symbols | Only basic shapes are available; detailed symbols must be improvised | Full library of process, workflow, and flowchart symbols ready to drag and drop |
Smart Connectors | Lines disconnect or shift when shapes are moved | Connectors stay attached and automatically adjust with repositioning |
Editing Experience | Restricted by a cell-based grid; shapes require manual alignment | Freeform editing on an infinite canvas with smooth drag-and-drop controls |
Styling & Formatting | Limited customization for colors, shapes, and layout | Professional themes, presets, and advanced style controls for clean visuals |
Templates | No built-in templates for process maps | Dozens of ready-made templates for workflows, SOPs, swimlanes, and more |
Collaboration | File sharing only; co-editing shapes can cause conflicts | Real-time collaboration with comments, multi-cursor editing, and shared updates |
Scalability | Complex diagrams quickly become cluttered and hard to manage | Canvas expands effortlessly, supporting both simple and multi-level processes |
Export Options | Basic export capabilities; formatting may shift | High-quality PNG, SVG, PDF, and secure embed options |
Linking & Attachments | No ability to link steps to documents or related diagrams | Add notes, attach files, and link sub-processes or documentation |
Process Documentation | Suitable only for simple, linear process visuals | Ideal for comprehensive, interconnected documentation across entire workflows |
Free Process Map Templates to Get Started


Helpful Resources for Making Process Maps
Explore the different types of process maps and how they are used.
Learn step-by-step how to make a process map in Microsoft Word.
Understand the four levels of business process mapping.