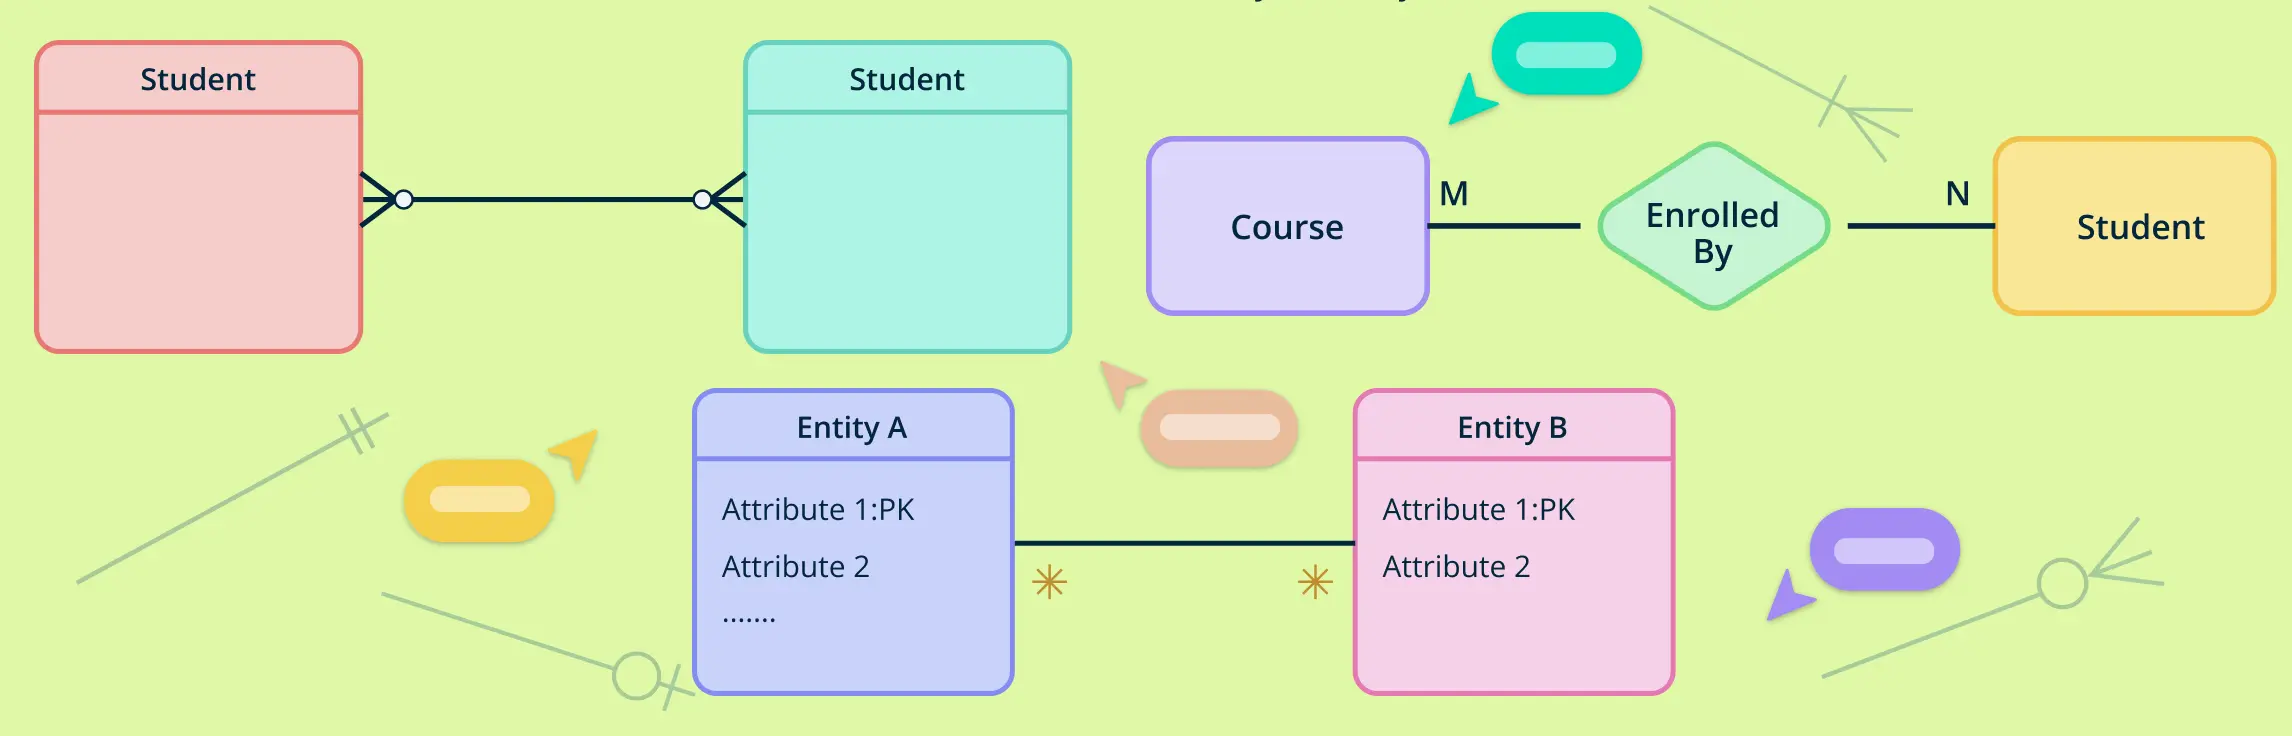
Understanding how entities relate to each other is at the heart of data modeling. That’s where cardinality symbols come in. These visual indicators define how many instances of one entity can or must be associated with instances of another, forming the backbone of accurate, meaningful ER diagrams.
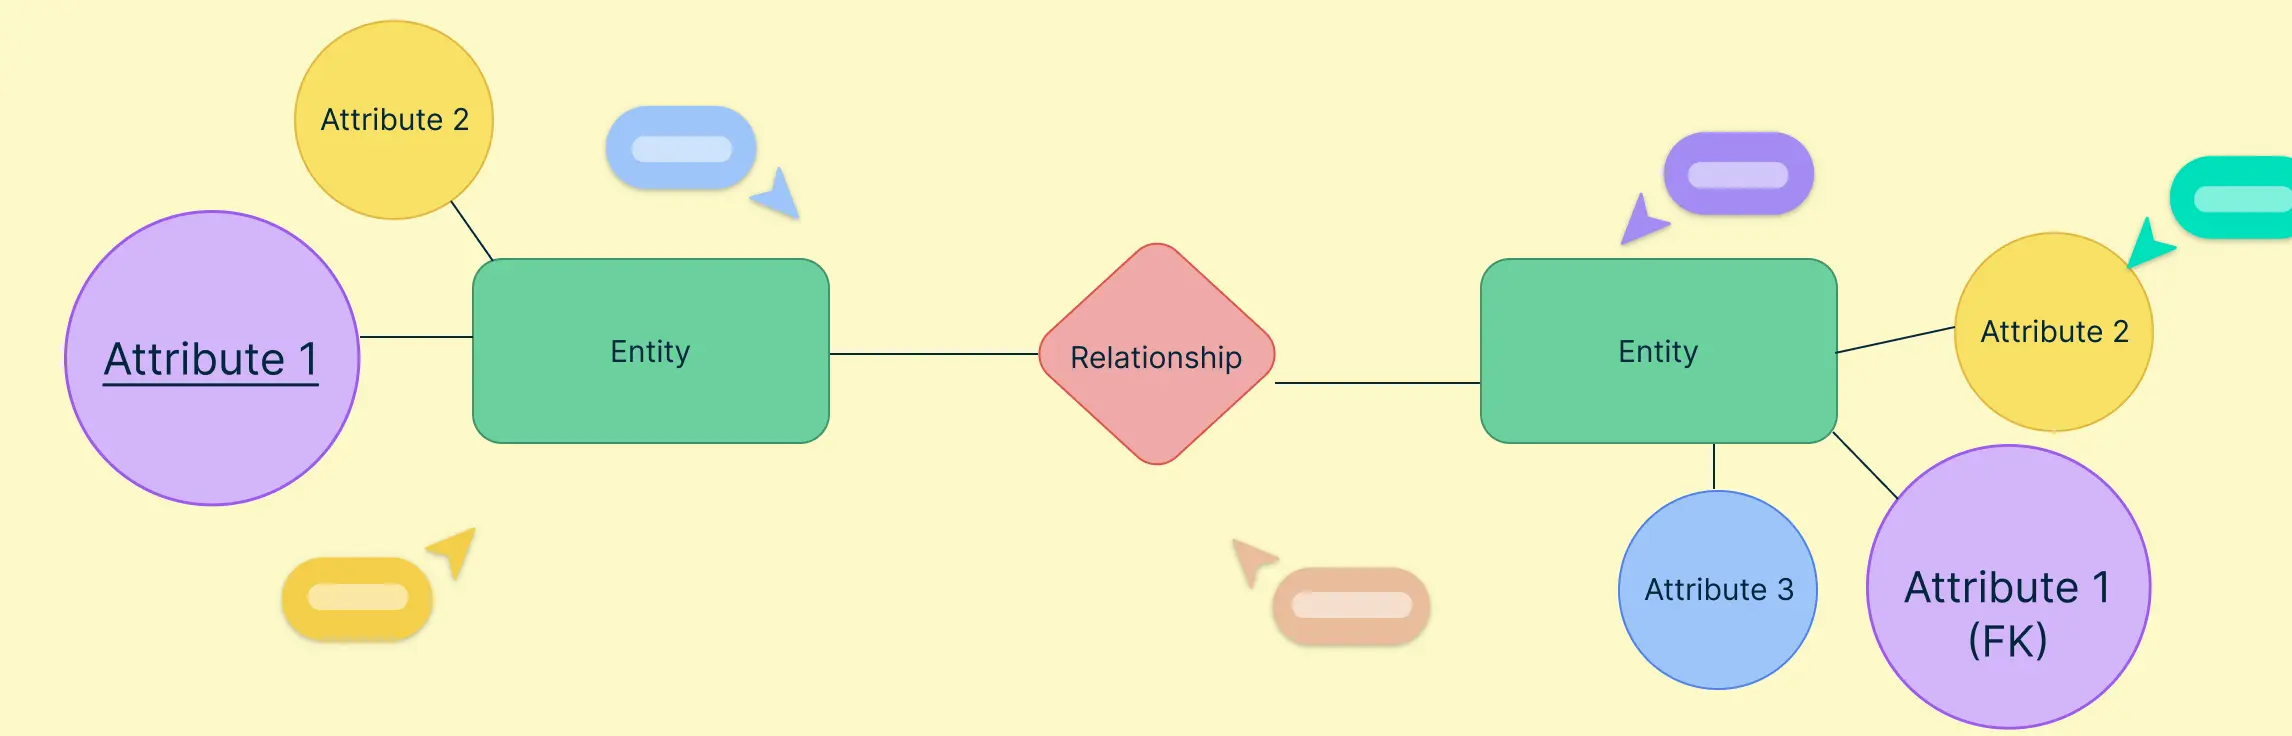
When designing a relational database, understanding how entities connect is just as important as defining the entities themselves. That’s where the foreign key in ER diagrams comes in. It serves as the critical link that binds different tables together, helping you create a structured, meaningful database model.
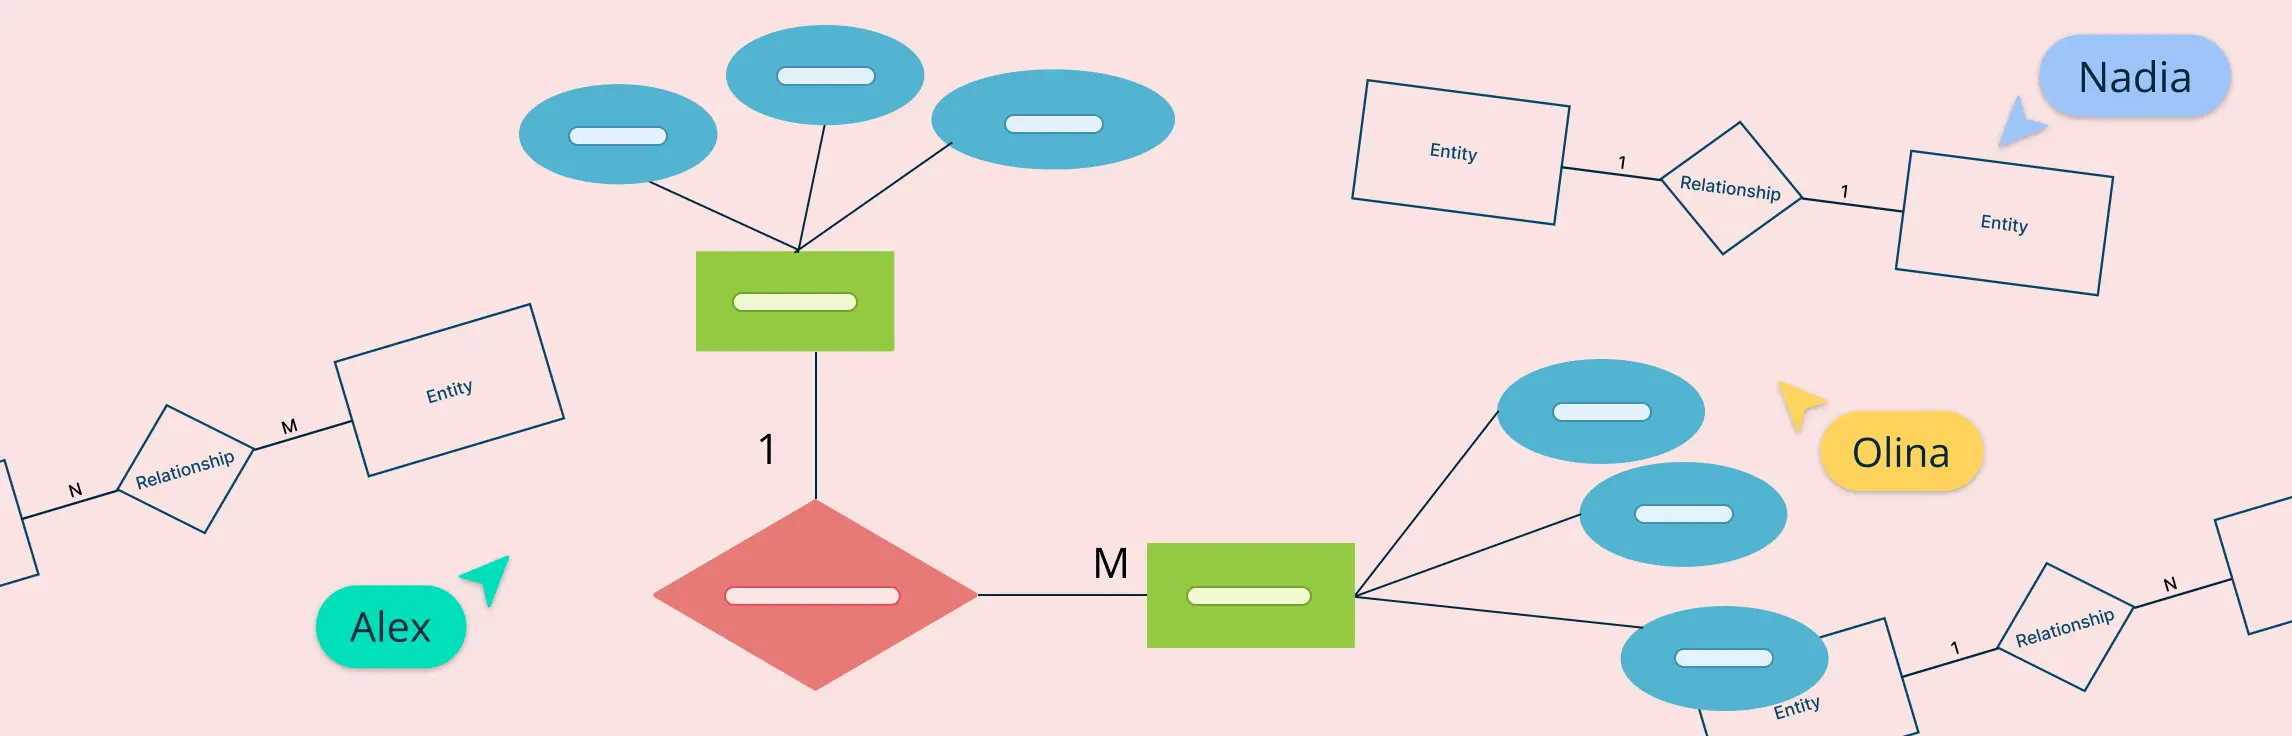
Designing a well-structured database starts with understanding how to represent data and its relationships clearly. One of the most influential tools for this is Chen notation, a visual language used in Entity-Relationship diagrams.
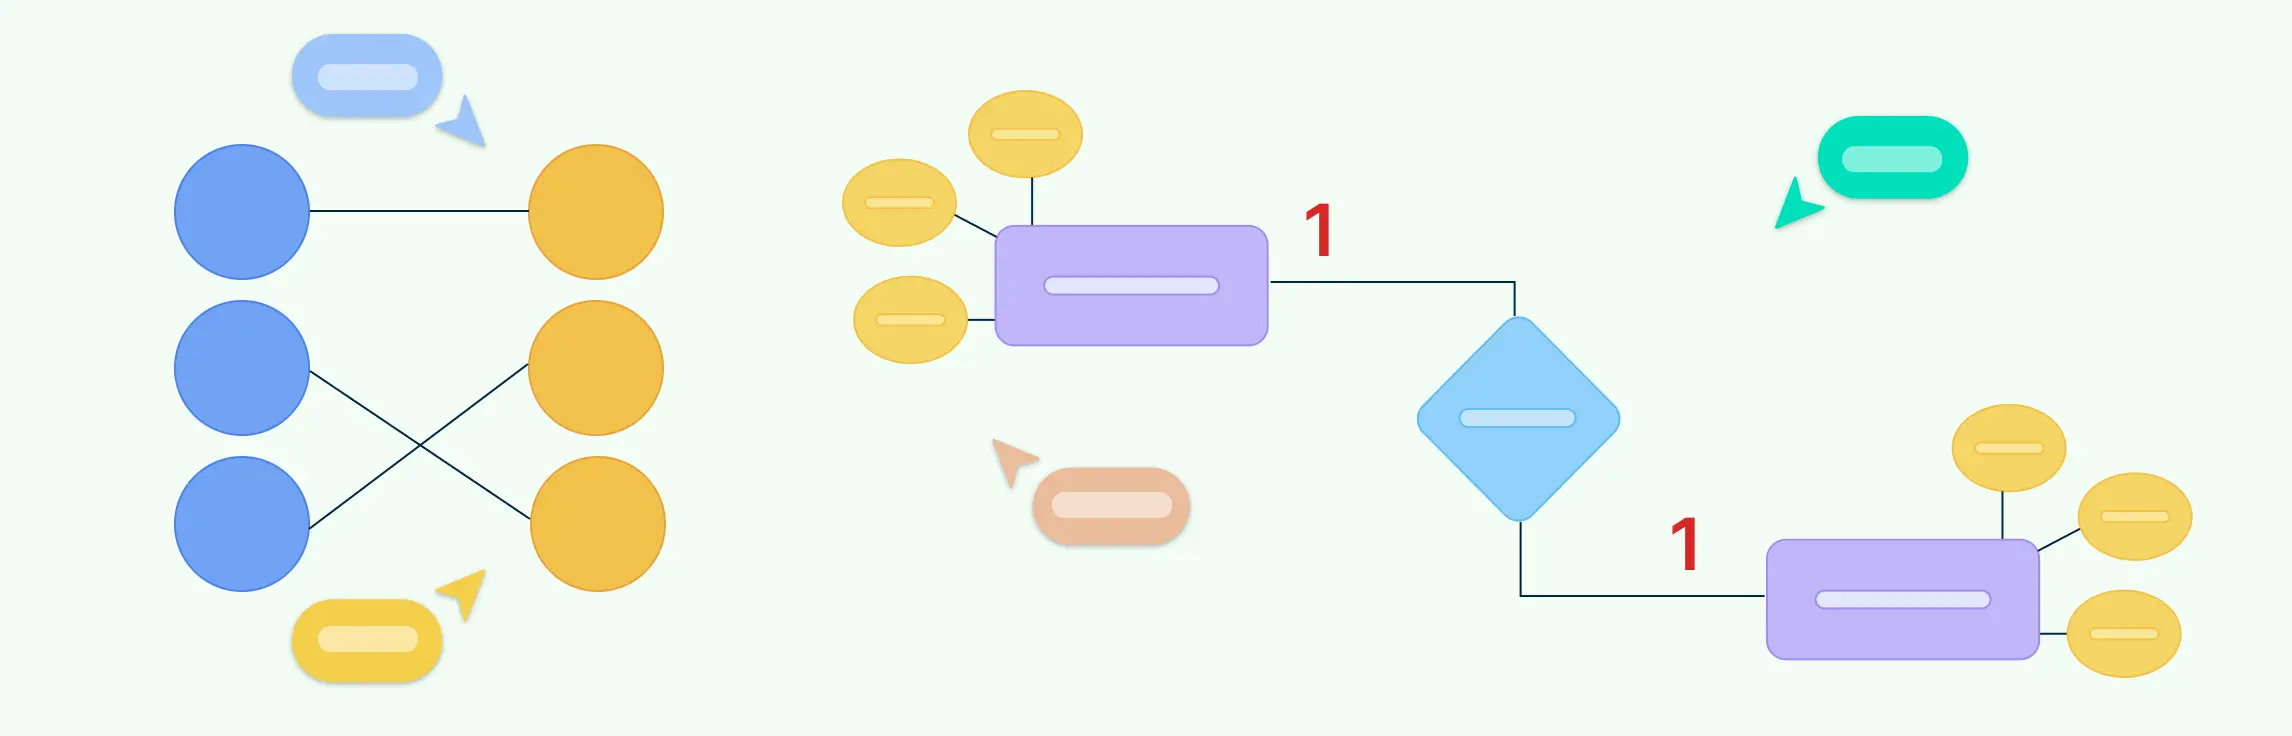
In database design, understanding how different entities relate to each other is essential for creating efficient and accurate data models. One of the most straightforward yet powerful types of relationships is the one-to-one relationship. This occurs when each record in one table is linked to exactly one record in another table—and vice versa.
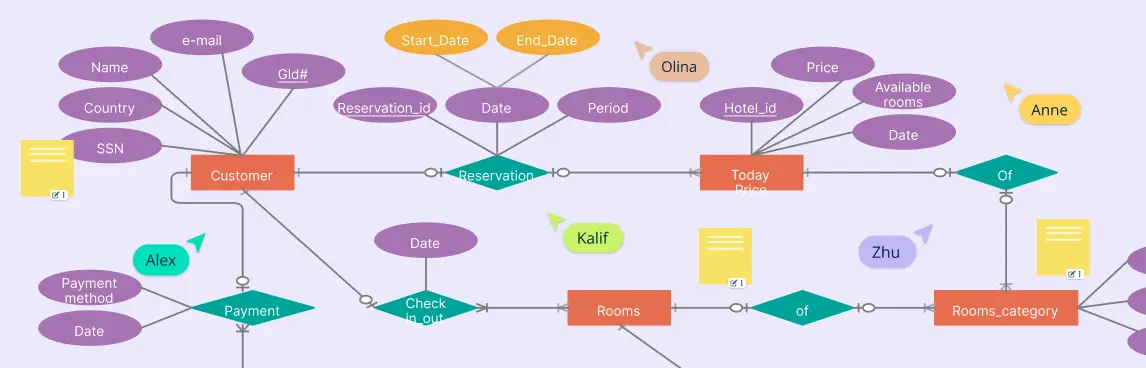
An ER diagram for a hotel management system is a simple way to show how all the parts of a hotel work together in a database. Whether you’re building hotel software or just trying to understand how hotel data is stored and managed, an ER diagram helps map out everything clearly—from guests and rooms to bookings and staff.
In database design, not all entities can stand on their own. Some rely on other entities to make sense or to be uniquely identified. These are called weak entities. They are an important part of ER diagrams, especially when modeling real-world situations where certain data cannot exist without being linked to other data.
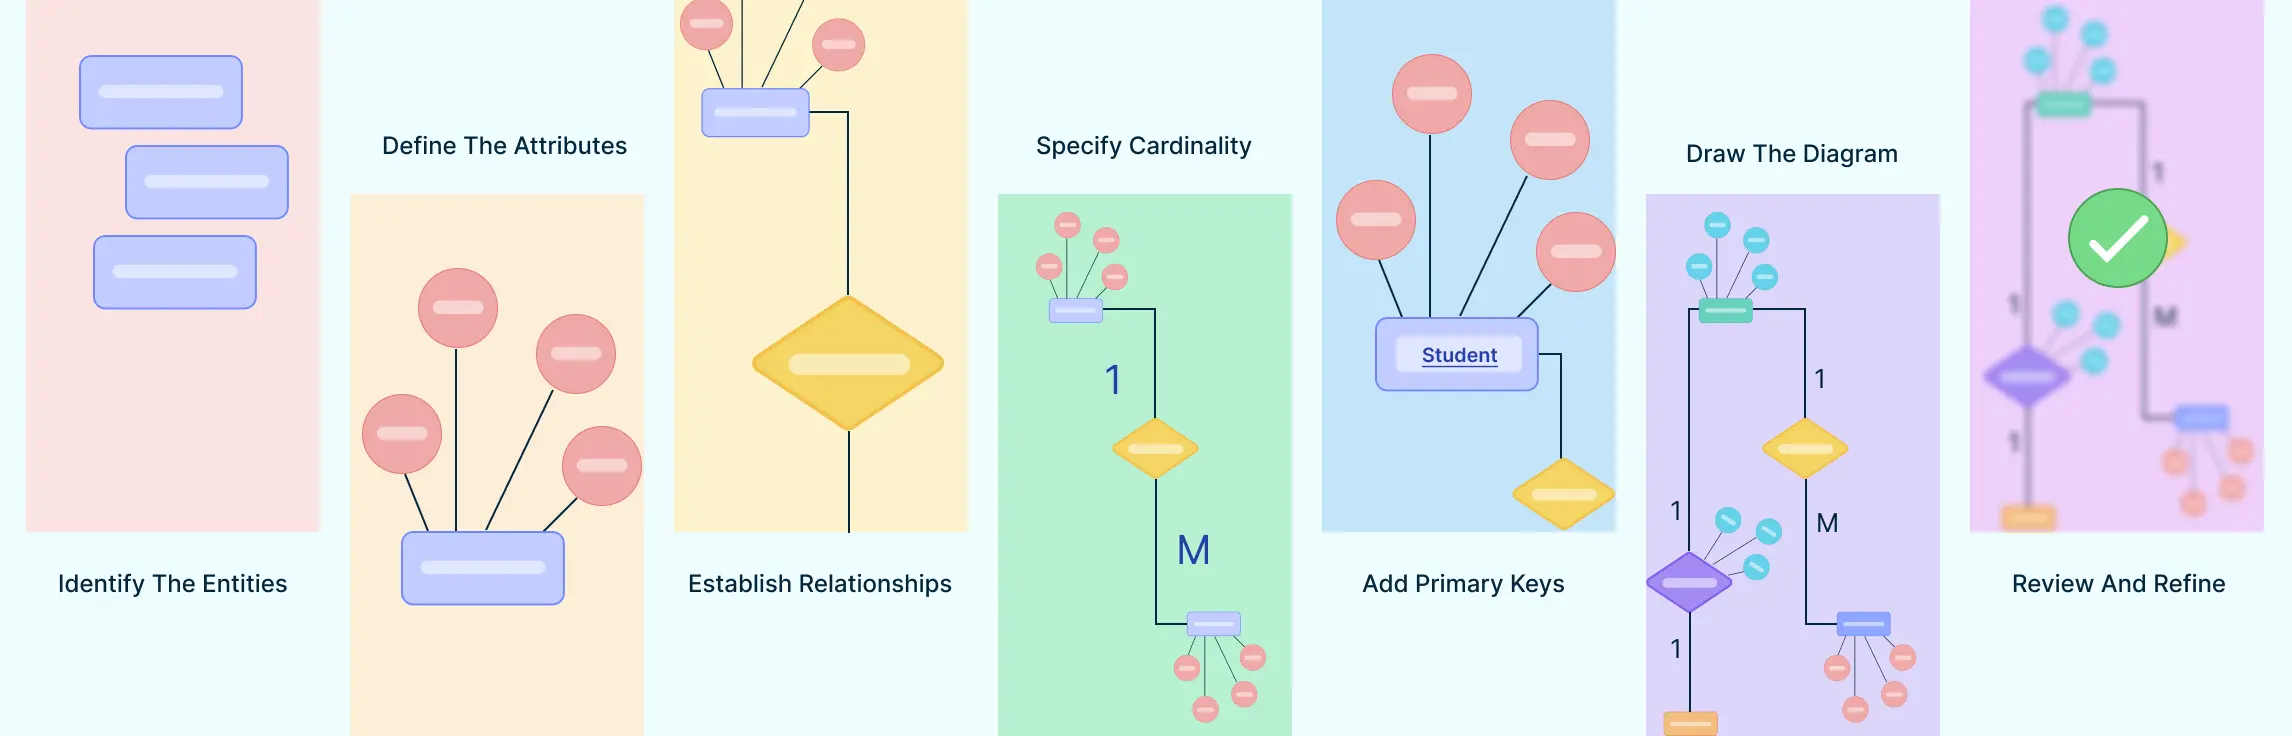
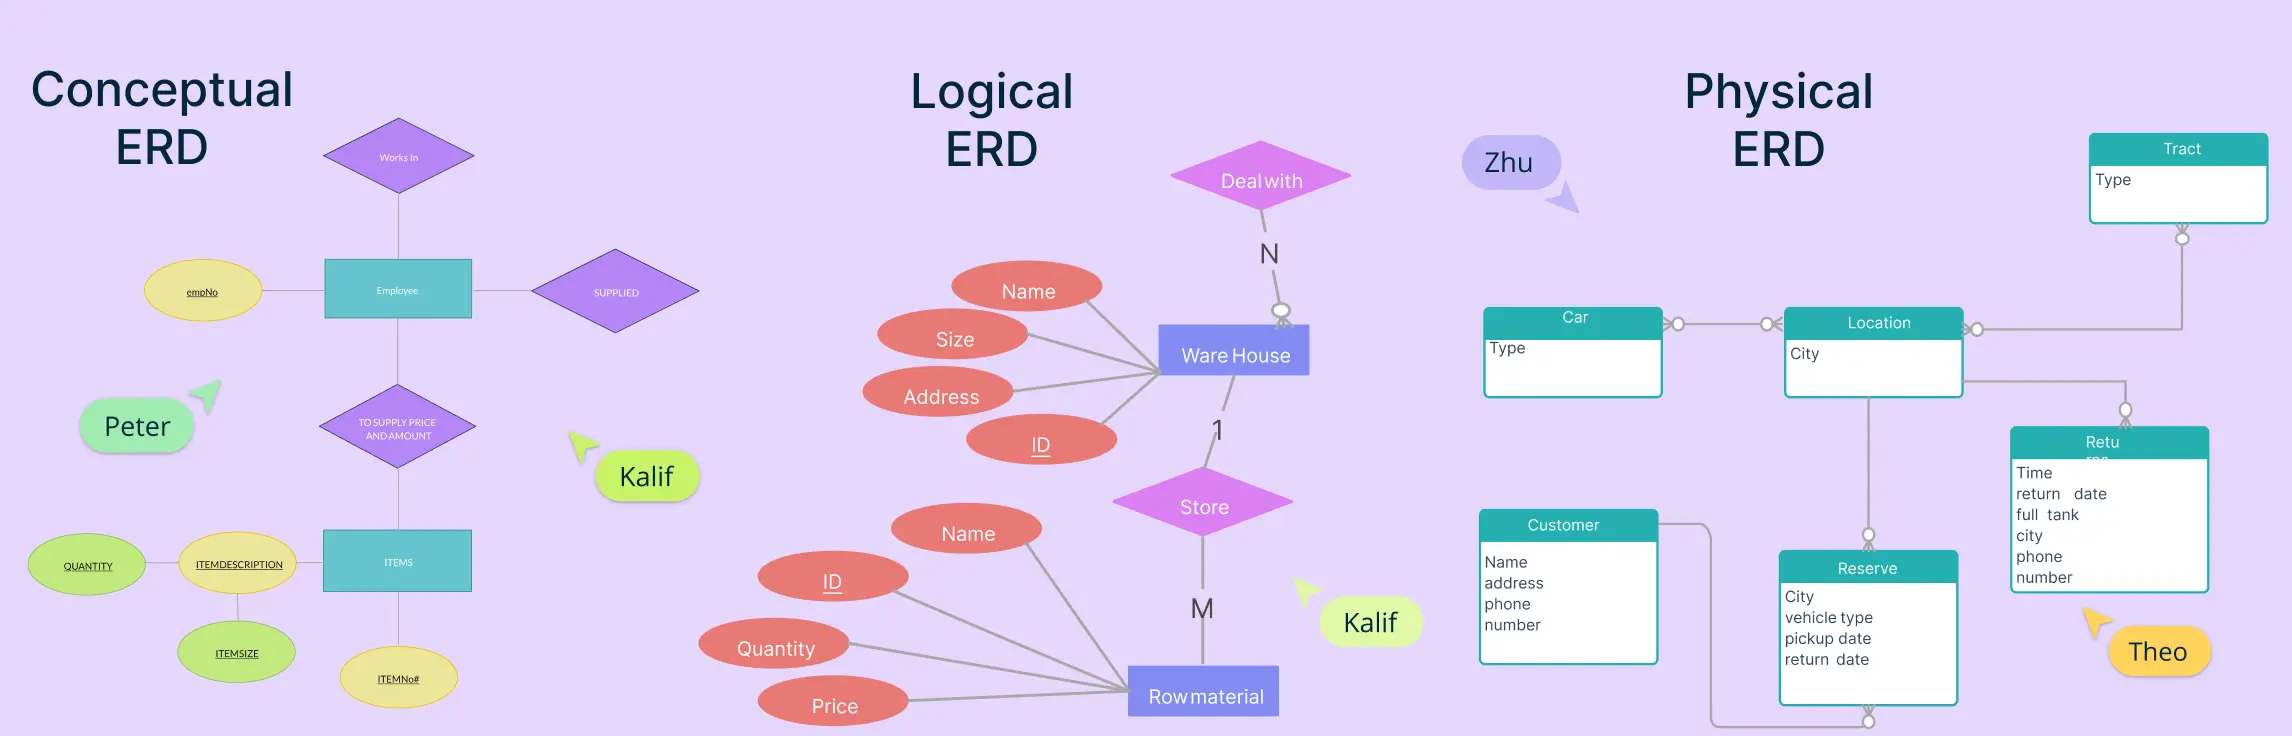
An entity relationship diagram is a visual representation of the structure of a database. It illustrates how entities (such as people, objects, or concepts) relate to one another within a system. Entity relationship diagrams are essential for designing databases, ensuring data is organized efficiently, and facilitating clear communication among stakeholders.
When designing a database, one of the most important steps is understanding how information connects and flows. That’s where Entity-Relationship Diagrams (ERDs) come in. ERDs help us map out the key parts of a system—like people, products, or events—and how they relate to one another.