Creating an organizational chart in Google Docs is a handy way to visualize team structures and reporting lines, especially if you’re already working within Google Workspace. While Docs doesn’t have a built-in org chart feature, you can still build one using the Drawing tool with shapes and connectors. In this guide, we’ll walk you through the steps, share tips to make the process easier, highlight the drawbacks of using a Google Doc org chart, and suggest a better alternative for more complex or professional org charts.
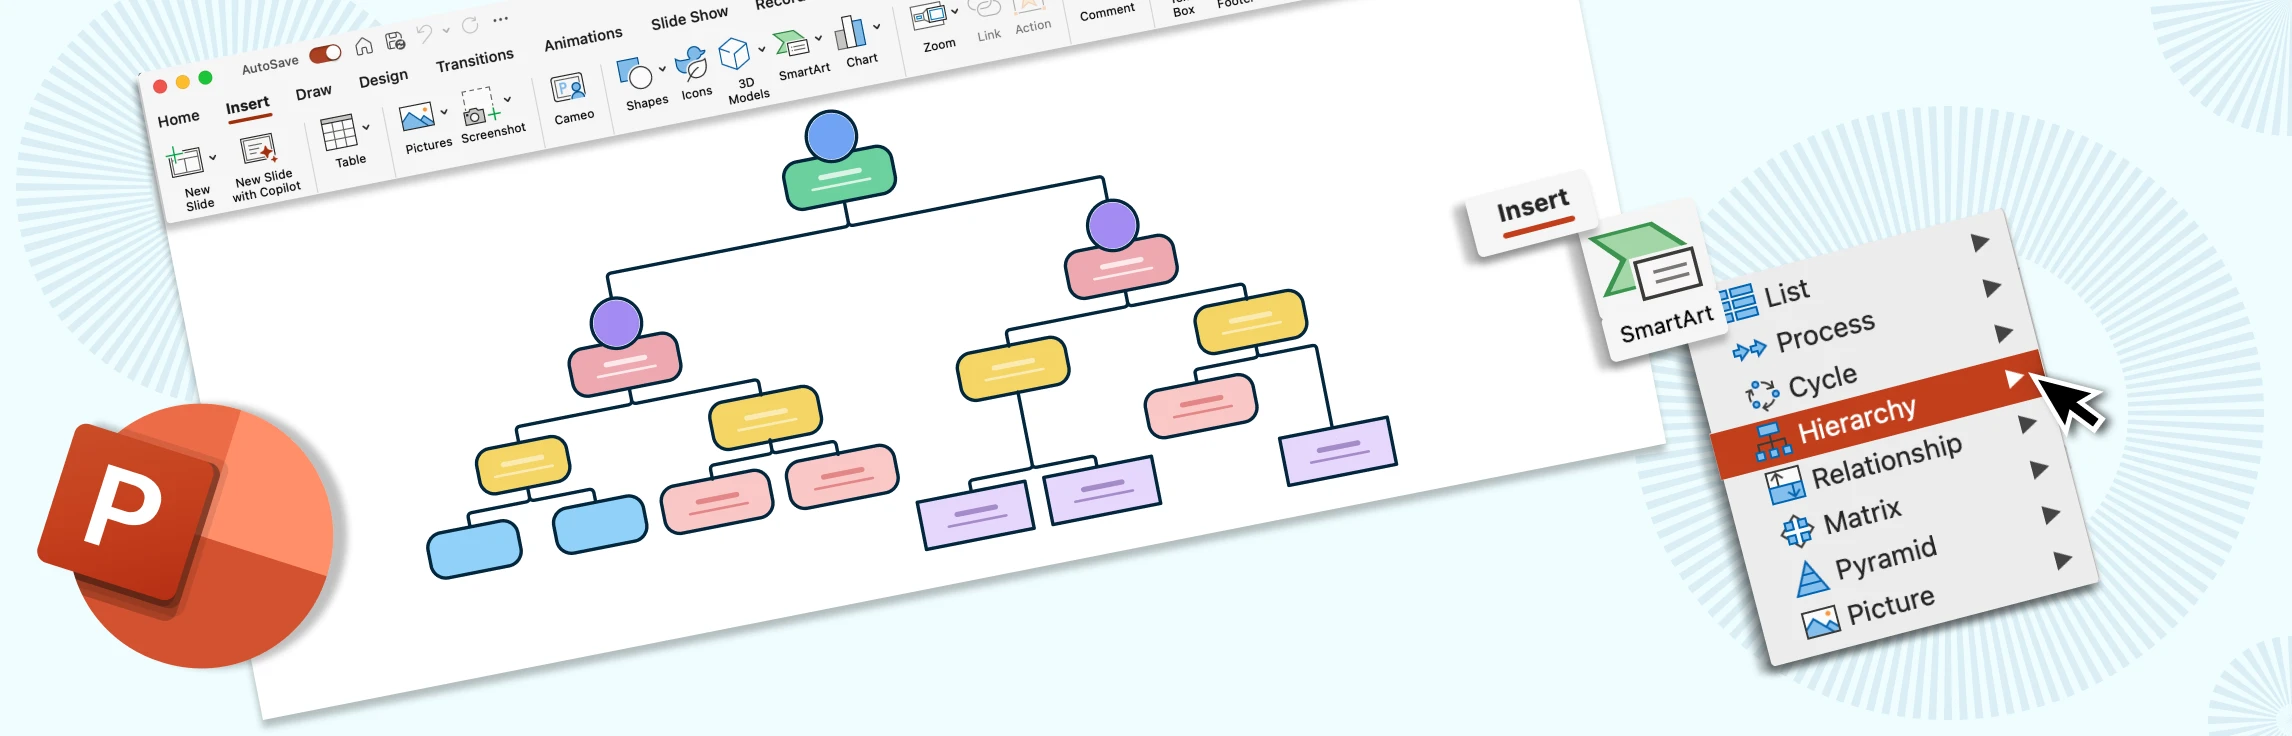
Creating an org chart in PowerPoint is a quick way to visualize reporting lines and align teams right inside your deck. This guide gives you step-by-step instructions on how to build an org chart in Powerpoint, practical layout and formatting tips to keep branches tidy and on brand, and common pitfalls to avoid. You’ll also get a clear view of PowerPoint’s limitations, and why a dedicated tool like Creately is better suited for creating professional organizational charts.
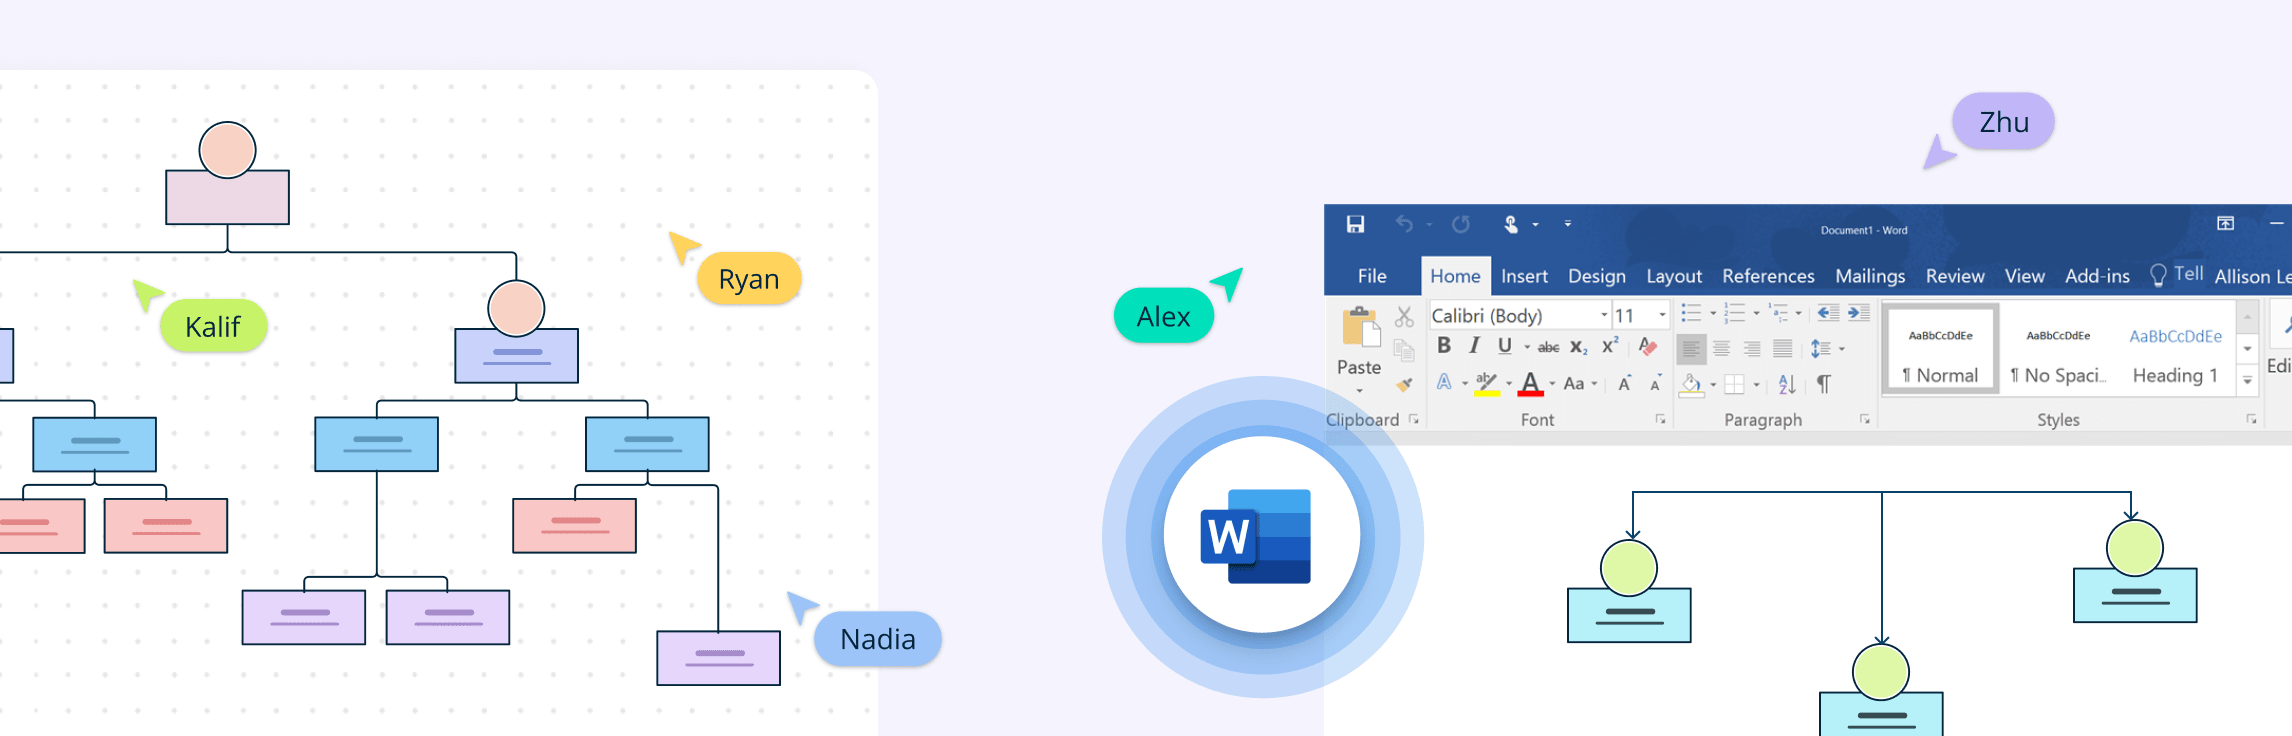
Creating an organizational chart in Microsoft Word is a quick way to visualize reporting structures and team hierarchies without needing specialized software. Whether you’re preparing a presentation, documenting your company structure, or sharing team roles, Word’s built-in SmartArt graphics make it possible to create a simple org chart directly within your document. In this guide, we’ll walk you through the steps, share tips to make the process smoother, point out Word’s limitations, and explore a better alternative if you need more flexibility.
In today’s fast-paced world, being productive and efficient is crucial as we juggle between personal and work commitments. Action items are the key to staying organized and keep things on track. They are specific, measurable, achievable, relevant, and time-bound tasks that help us get closer to our goals, whether it is finishing a work project or managing our daily lives.