Understanding how a system behaves is just as important as knowing its structure, and that’s where behavioral diagrams in UML come in. These diagrams provide a visual representation of system interactions, workflows, and object behavior over time, helping teams design more efficient software, communicate clearly, and ensure requirements are accurately captured. In this guide, we’ll explore what behavioral diagrams are, why they matter, and break down the seven main types along with examples to help you apply them effectively.
What Is a Behavioral Diagram?
A behavioral diagram in UML illustrates the dynamic behavior of a system, showing how objects, components, or actors interact over time to accomplish specific tasks. Unlike structural diagrams that focus on the system’s static elements, behavioral diagrams in UML capture workflows, processes, and interactions, helping teams understand how a system functions in real-world scenarios.
These diagrams are essential for software designers, analysts, and developers because they provide a visual representation of system activities, making it easier to analyze processes, detect bottlenecks, and ensure accurate system behavior before implementation. From use case modeling to mapping object interactions, behavioral diagrams bring clarity to complex system dynamics.
Why Behavioral Diagrams Matter in UML
Behavioral diagrams play a crucial role in software design, team collaboration, and system documentation. By visualizing how different parts of a system interact over time, these diagrams make complex processes easier to understand, ensuring everyone, from developers to stakeholders, shares a common understanding of system behavior.
The key benefits of behavioral diagrams in UML include:
- Identifying system workflows: Clearly map processes and interactions to understand how the system operates.
- Detecting bottlenecks: Spot inefficiencies or potential issues in workflows before they impact implementation.
- Ensuring accurate requirements: Validate that the system meets user and business needs by visually representing expected behaviors.
In short, behavioral diagrams help teams design better software, communicate effectively, and maintain clear documentation, making them an essential tool in any UML toolkit.
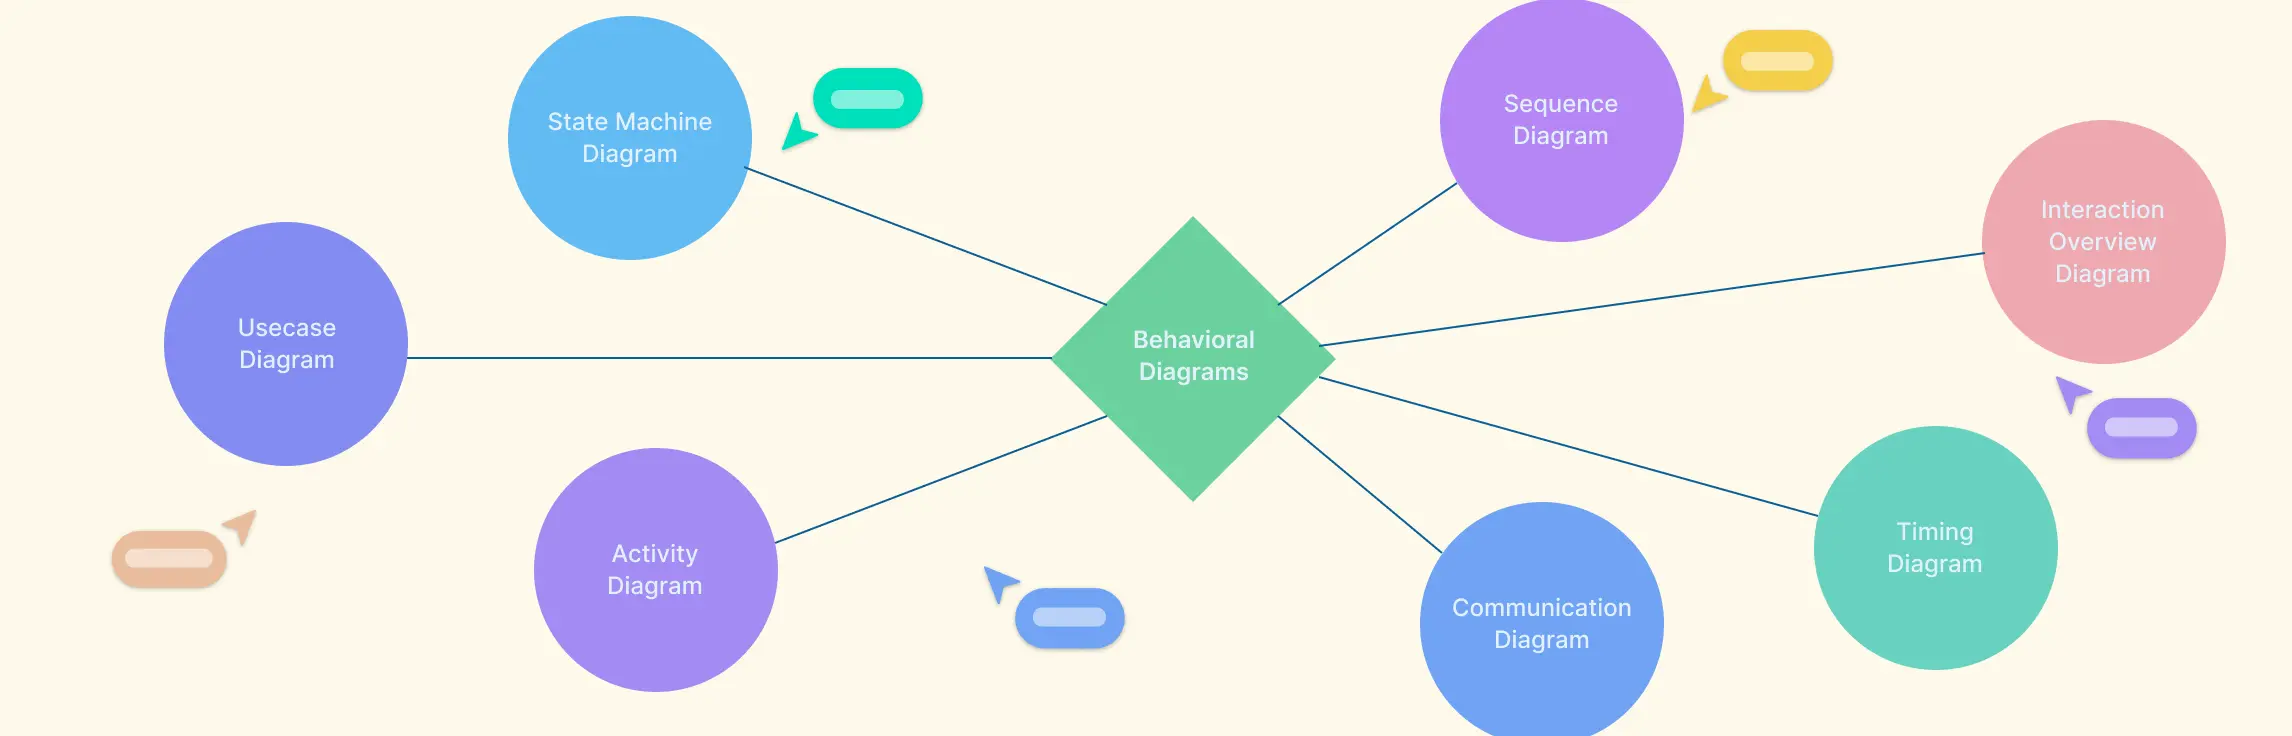
The 7 Types of Behavioral Diagrams in UML
Behavioral diagrams in UML provide a visual way to understand how a system operates dynamically. Each type focuses on different aspects of system behavior, making it easier for teams to analyze workflows, interactions, and processes.
1. Activity Diagram
An activity diagram represents workflows and processes, illustrating how tasks progress step by step within a system or business process. It is particularly useful for visualizing complex processes, identifying bottlenecks, and improving efficiency. Activity diagrams can model both high-level business workflows and detailed system operations, making them versatile for developers, analysts, and stakeholders.
Key Components of an Activity Diagram:
- Activities/Actions: Represent individual tasks or steps in the workflow.
- Start Node: Indicates the beginning of the process.
- End Node: Marks the completion of the workflow.
- Decision Nodes: Show branching points where conditions determine the next step.
- Merge Nodes: Combine multiple paths back into a single flow.
- Forks and Joins: Represent parallel processes and their synchronization.
- Transitions/Edges: Connect activities and indicate the flow of control between actions.
- Swimlanes: Divide the diagram to show the responsibilities of different actors or departments.


2. Use Case Diagram
A use case diagram illustrates system functionality from a user perspective, showing how different actors (users or external systems) interact with the system to achieve specific goals. These diagrams are particularly valuable for requirement gathering, stakeholder communication, and clarifying system boundaries, making them essential in the early stages of software design.
Try Creately’s Use Case Diagram Tool
Key Components of a Use Case Diagram:
- Actors: Represent users, roles, or external systems that interact with the system.
- Use Cases: Define the tasks or goals that the actors want to achieve.
- System Boundary: Encapsulates all the use cases and shows the scope of the system.
- Relationships:
- Association: Connects actors to use cases.
- Include: Indicates mandatory inclusion of one use case within another.
- Extend: Represents optional or conditional behavior.
- Generalization: Shows inheritance between actors or use cases.

3. State Machine Diagram
A state machine diagram models the lifecycle behavior of an object or component, showing the various states it can occupy and how it transitions between those states in response to events. This type of behavioral diagram is particularly useful for analyzing reactive systems, validating object behavior, and ensuring system reliability.
Try Creately’s State Diagram Maker
Key Components of a State Machine Diagram:
- States: Represent the conditions or situations an object can be in during its lifecycle.
- Initial State: Indicates where the object starts in its lifecycle.
- Final State: Marks the completion of the object’s lifecycle.
- Transitions: Arrows that show the movement from one state to another, often triggered by events.
- Events: Actions or occurrences that cause a state change.
- Guards/Conditions: Boolean expressions that must be true for a transition to occur.
- Actions/Activities: Operations performed as a result of entering, exiting, or during a state.

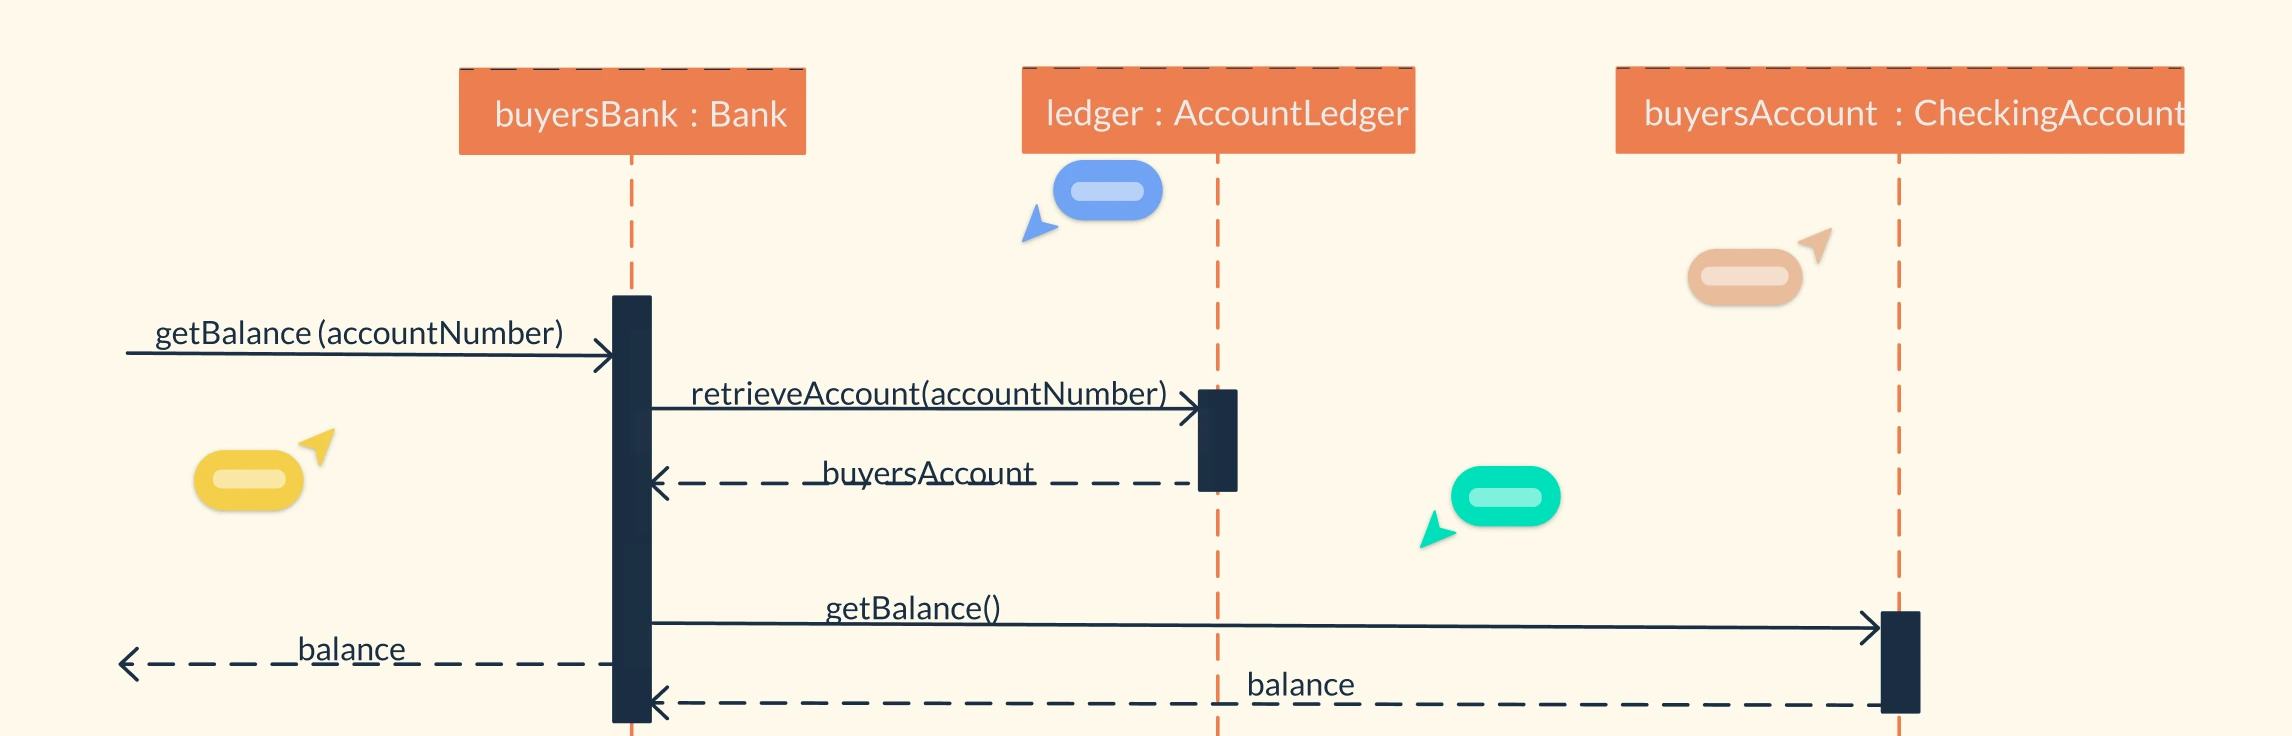
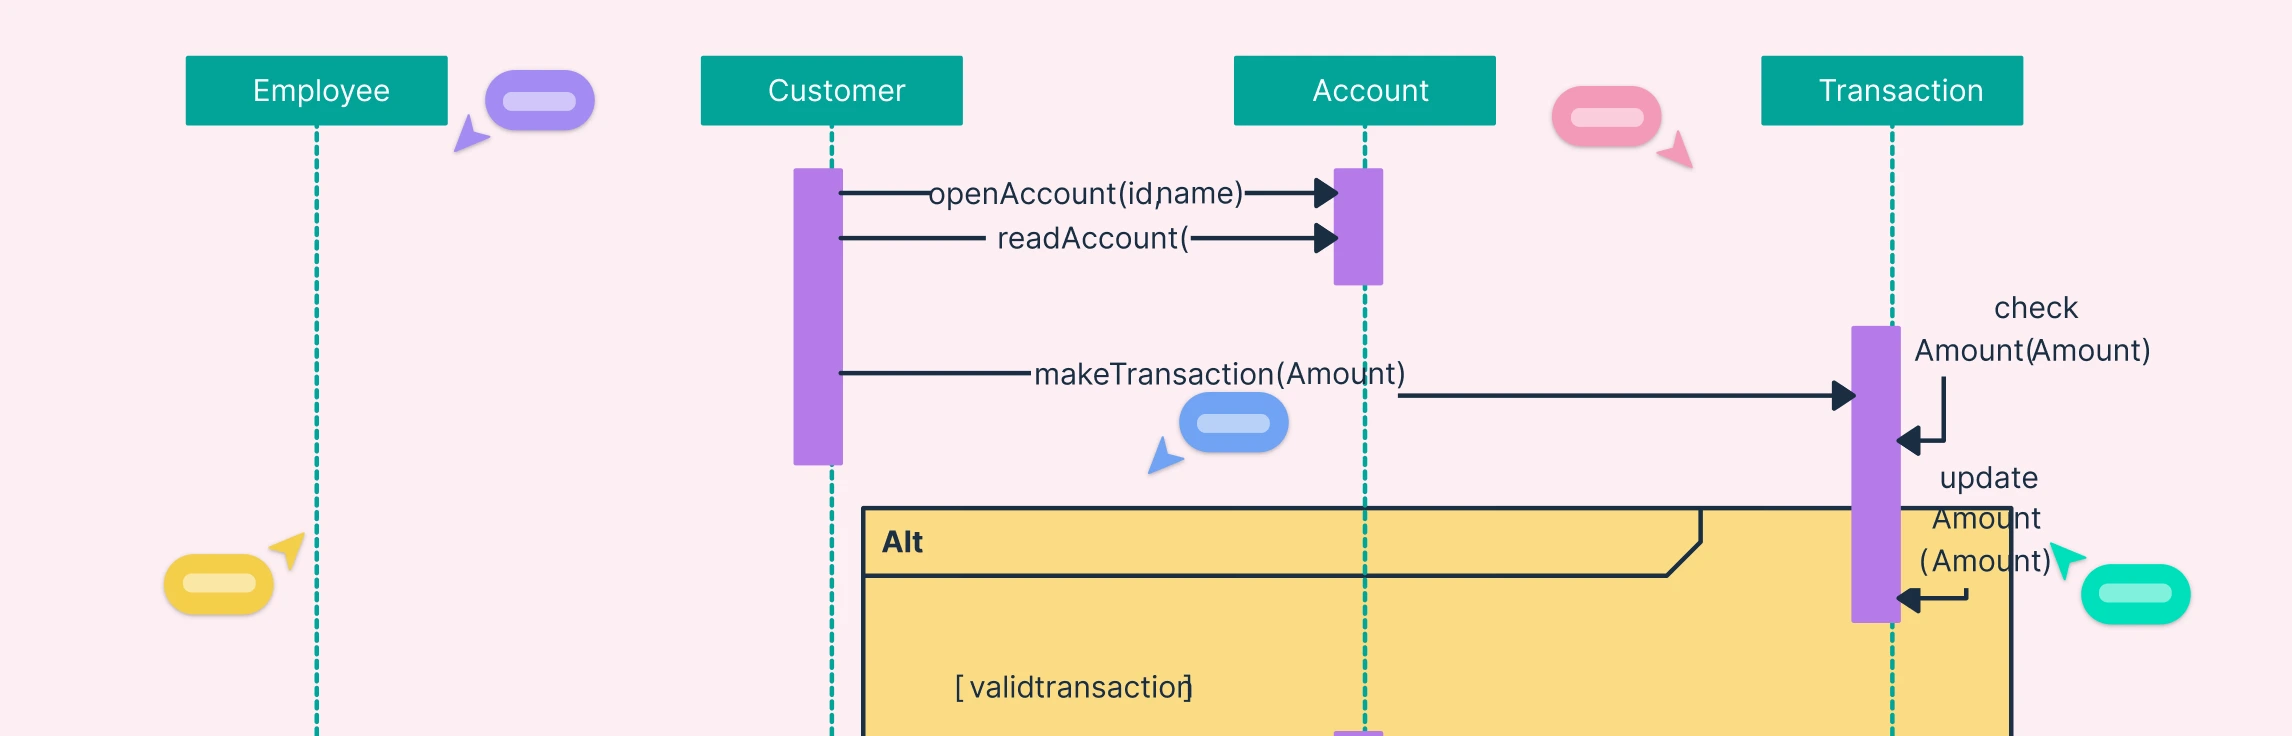
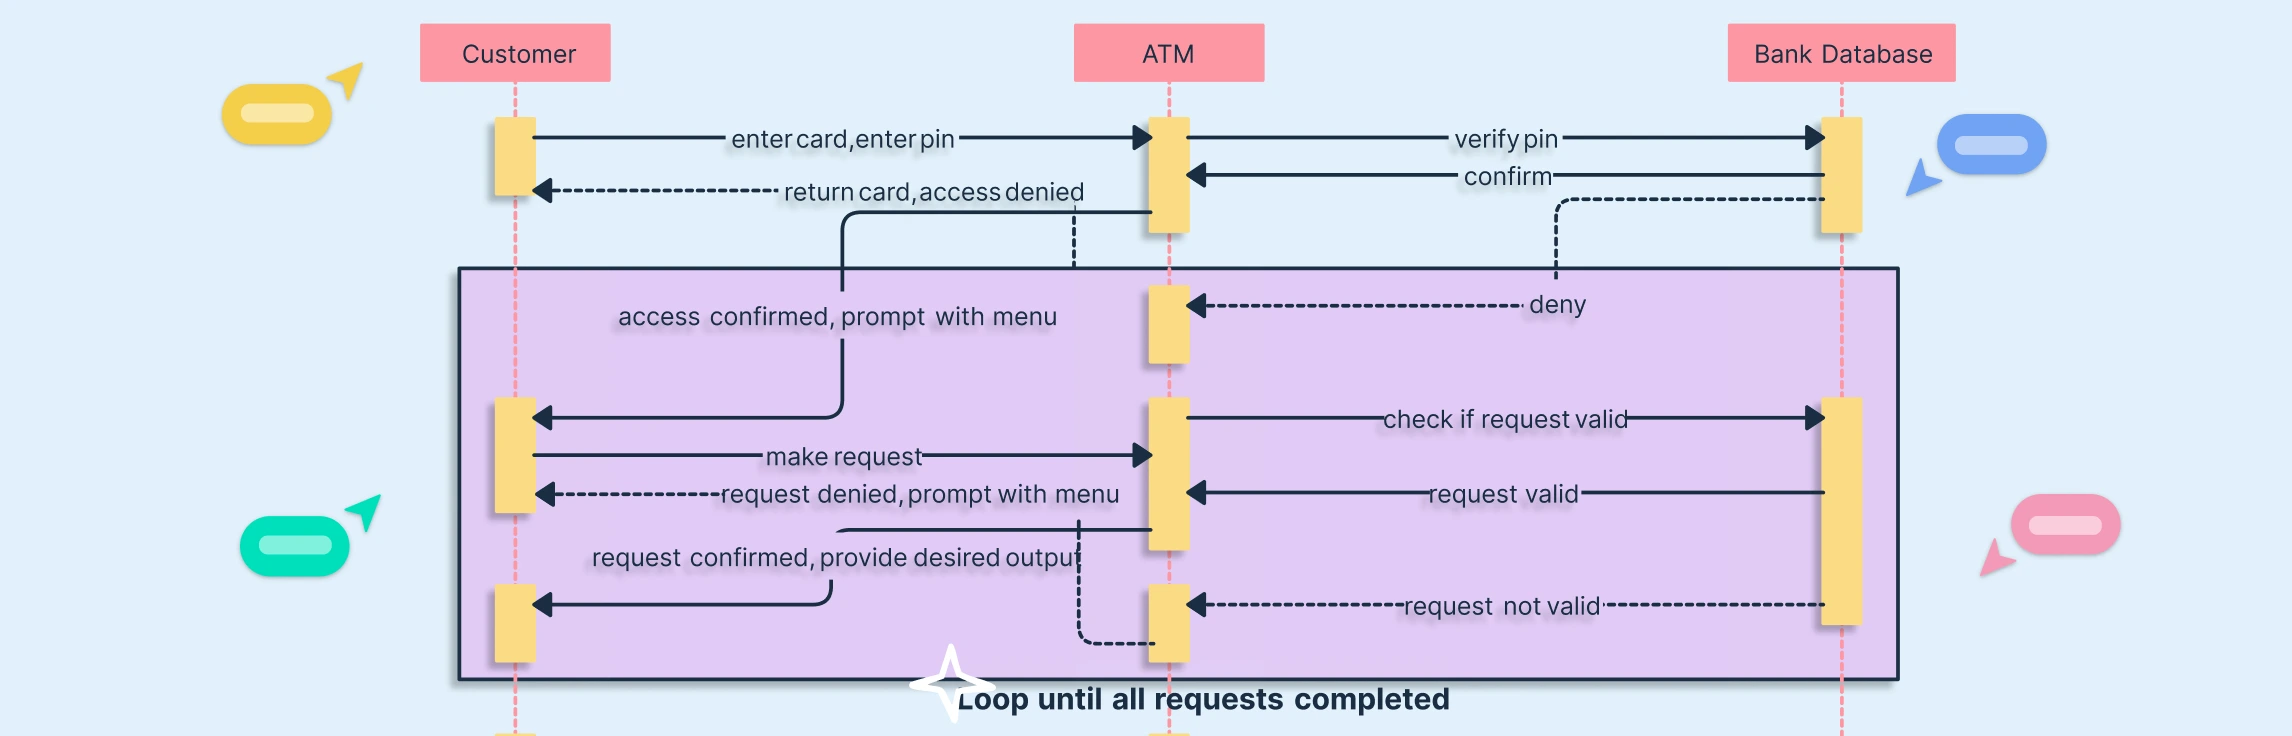
4. Sequence Diagram
A sequence diagram illustrates how objects interact over time, highlighting the chronological order of messages exchanged between them. This type of behavioral diagram is ideal for understanding method calls, communication sequences, and system workflows, making it essential for both design and documentation purposes.
Try Creately’s Sequence Diagram Tool
Key Components of a Sequence Diagram:
- Objects/Participants (Lifelines): Represent the entities involved in the interaction.
- Activation Bars: Indicate the period during which an object is performing an action.
- Messages: Arrows that show communication between objects; can be synchronous, asynchronous, or return messages.
- Interactions: Define the flow of messages, including loops, conditionals, or parallel actions.
- Combined Fragments: Represent complex control structures like alternatives (alt), loops (loop), or parallel processes (par).
- Gates: Points for connecting interactions with other diagrams or external processes.

5. Communication Diagram
A communication diagram, also known as a collaboration diagram, emphasizes interactions between objects rather than the timing of messages, highlighting the structural organization of the system. This behavioral diagram is ideal for analyzing object collaborations, understanding system relationships, and ensuring correct communication paths.
Key Components of a Communication Diagram:
- Objects/Participants: Represent the entities involved in the interaction.
- Links: Connections between objects that indicate relationships and communication pathways.
- Messages: Numbered arrows showing the sequence of interactions between objects.
- Message Numbers/Sequence: Indicate the order of messages, even though time is not the primary focus.
- Roles/Classifier Names: Describe the role or type of each object in the communication.

6. Interaction Overview Diagram
An interaction overview diagram provides a high-level view of system interactions, combining features of activity diagrams and sequence diagrams. This type of behavioral diagram is particularly useful for modeling complex processes, allowing teams to visualize the flow of interactions across multiple scenarios in a structured way.
Key Components of an Interaction Overview Diagram:
- Initial Node: Marks the starting point of the interaction flow.
- Final Node: Represents the completion of the interaction process.
- Activity Nodes: Contain interactions, which can be sequence diagrams or other interaction fragments.
- Decision/Merge Nodes: Control branching and merging of interaction flows.
- Fork/Join Nodes: Represent parallel or concurrent interaction paths.
- Edges/Flows: Show the order of interactions between activities or fragments.
- Interaction References: Reuse existing sequence diagrams or interaction fragments to simplify complex models.

7. Timing Diagram
A timing diagram visualizes changes in object states or conditions over time, making it particularly useful for real-time systems, embedded systems, or any time-sensitive operations. Unlike sequence diagrams that emphasize message order, timing diagrams focus on state evolution and duration, helping teams understand temporal behavior and synchronization.
Key Components of a Timing Diagram:
- Lifelines: Represent objects or participants whose states are being tracked over time.
- State/Condition Lines: Show the value or state of an object at specific points in time.
- Time Axis: Usually horizontal, representing the progression of time.
- Events/Transitions: Mark changes in state triggered by actions or conditions.
- Duration Constraints: Specify how long an object remains in a particular state.
- Messages (optional): Show interactions between objects in parallel with state changes.

Benefits of Using Behavioral UML Diagrams
Behavioral UML diagrams offer a range of advantages for software design, system analysis, and team collaboration:
Visualizing System Workflows
These diagrams act as visual stories, helping teams understand how different components of a system interact and operate together.
Clarifying the Sequence of Actions
They clearly depict the order in which actions occur, making it easier to follow processes and ensure accurate execution.
Planning Step-by-Step Processes
Developers can use behavioral diagrams to plan workflows in detail, reducing ambiguity and improving implementation efficiency.
Highlighting Changes and Decisions
Critical points where decisions are made or states change are easily identified, helping teams anticipate system behavior.
Representing Different States
For systems with multiple states, like objects or processes that change over time, these diagrams show transitions clearly, improving comprehension.
Enhancing Team Collaboration
Acting as a shared visual language, behavioral diagrams allow all team members—developers, analysts, and stakeholders—to understand system behavior quickly.
Identifying Issues Early
By modeling interactions and processes visually, teams can detect potential problems early, preventing costly errors later in development.
Challenges Faced in Developing Behavioral UML Diagrams
While behavioral UML diagrams are powerful tools, creating them comes with several challenges:
Deciding What to Include
Determining which interactions, processes, or states to represent without overwhelming the diagram can be tricky. The goal is to show enough detail to convey the system behavior clearly.
Managing Changes
Software systems evolve constantly, so diagrams need regular updates to reflect changes accurately, ensuring they remain aligned with the actual system.
Interpreting Different Perspectives
Team members may interpret diagrams differently. Ensuring a shared understanding across developers, analysts, and stakeholders is essential for effective communication.
Representing Time and Order
Accurately showing the sequence of actions or state transitions can be challenging, particularly for complex processes. Clarity in the flow is critical.
Balancing Detail and Simplicity
Diagrams must strike the right balance between comprehensiveness and readability. Too much detail can clutter the diagram, while too little can leave gaps in understanding.
Ensuring Usefulness for All Team Members
Diagrams should be relevant and interpretable for different audiences, from developers to business stakeholders.
Catching Errors Early
Mistakes in the diagram can lead to miscommunication or design flaws. Identifying and correcting issues early ensures the diagram remains reliable.
Maintaining Clarity
Keeping diagrams simple, clear, and easy to understand is always a challenge, especially as system complexity increases.
By recognizing these challenges, teams can take steps to create behavioral diagrams in UML that are both accurate and practical for collaborative development.
Best Practices for Developing Behavioral UML Diagrams
Creating effective behavioral UML diagrams requires careful planning and attention to clarity. Here are some best practices to ensure your diagrams are both accurate and easy to understand:
Tell a Clear Story: Ensure the diagram clearly communicates how the system behaves, making it easy for all team members to follow.
Include Important Steps: Don’t omit critical actions or interactions; each significant step should be represented to provide a complete picture.
Choose What to Show Wisely: Focus on relevant processes and interactions while avoiding unnecessary details that may clutter the diagram.
Update When Things Change: Keep diagrams current by updating them whenever system behavior changes, ensuring they remain accurate and reliable.
Consider Different Perspectives: Remember that team members may interpret diagrams differently; design them so they are understandable to developers, analysts, and stakeholders alike.
Show the Order of Events: Clearly indicate the sequence of actions and transitions to maintain logical flow and readability.
Balance Detail and Simplicity: Include enough information to be informative while keeping the diagram simple enough to avoid confusion.
Make It Useful for Everyone: Ensure diagrams serve as a practical reference for all team members, from beginners to experts.
Catch Mistakes Early: Review diagrams frequently to spot errors or inconsistencies before they affect development.
Keep It Simple and Clear: Prioritize clarity and simplicity to make the diagram easy to read and interpret.
Behavioral diagrams are essential tools for visualizing dynamic system behavior, improving collaboration, and ensuring accurate software design. Whether you’re documenting workflows, mapping object interactions, or modeling complex processes, these UML diagrams make it easier to communicate and validate your ideas. Start creating your own behavioral diagrams with Creately’s UML Diagram Software and bring clarity to your system designs today.