Class Diagram Definition
A class diagram is a type of UML (Unified Modeling Language) diagram that visually represents the structure of a system by showing its classes, attributes, methods, and relationships. It serves as a blueprint for how different parts of an object-oriented system interact and organize data. Class diagrams are fundamental in system design because they bridge the gap between real-world concepts and code implementation. This helps developers, analysts, and stakeholders understand how the system’s components are connected and how they collaborate to perform various functions.
What is included in a Class
A class represents a group of objects that share common characteristics and behavior within a system. Each class defines:
Structural features (attributes): These describe what an object of the class “knows” — its properties or data fields that capture the object’s state. Attributes define the static or structural aspects of the class.
Behavioral features (operations or methods): These describe what an object of the class “can do” — the actions it can perform or the services it provides. Operations define the dynamic behavior of the class and describe how its objects interact with other elements in the system.


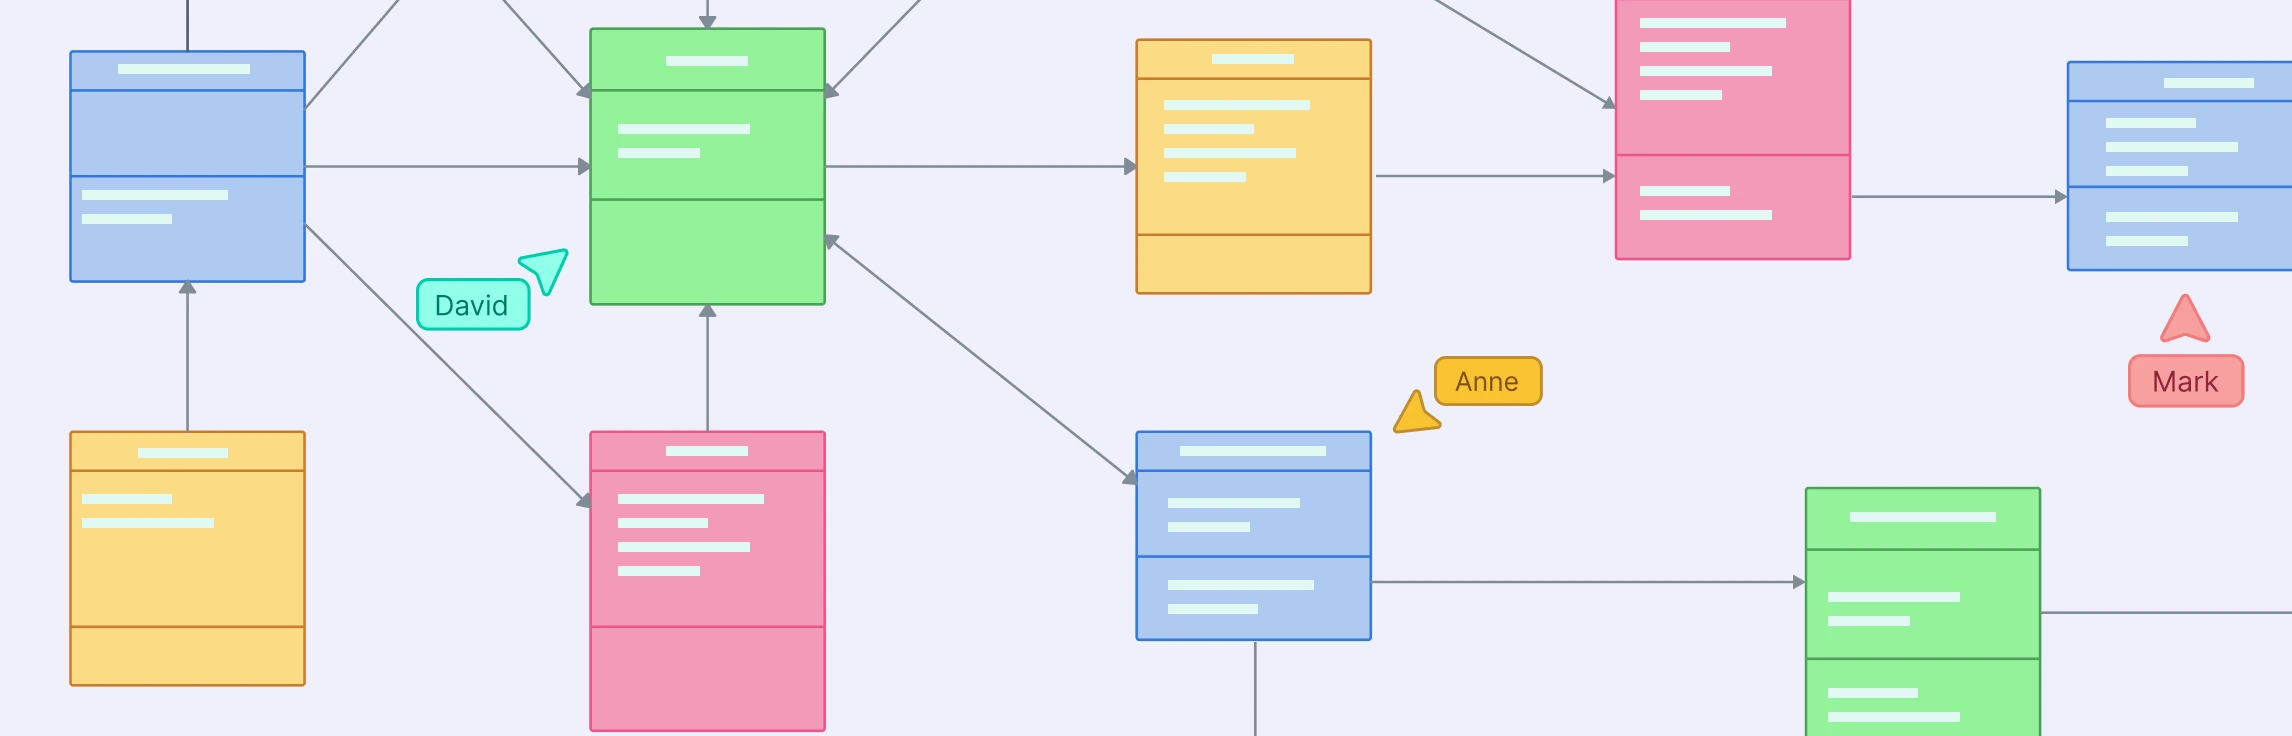
Key Components of a Class Diagram
Classes
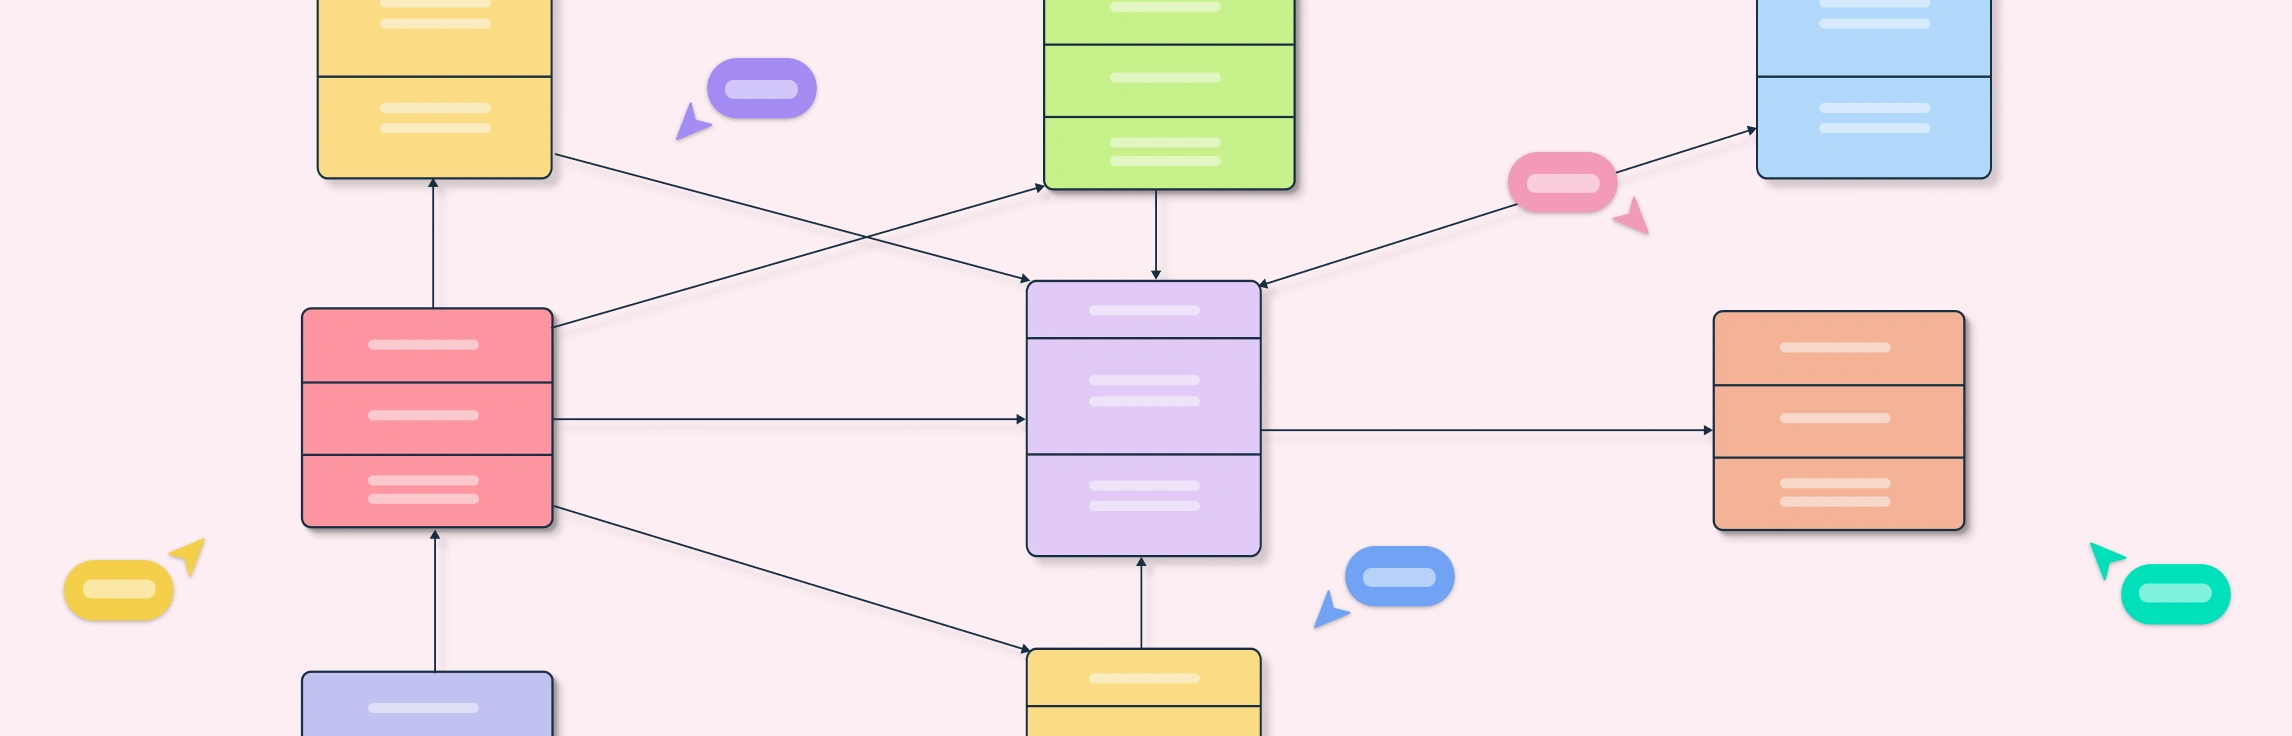
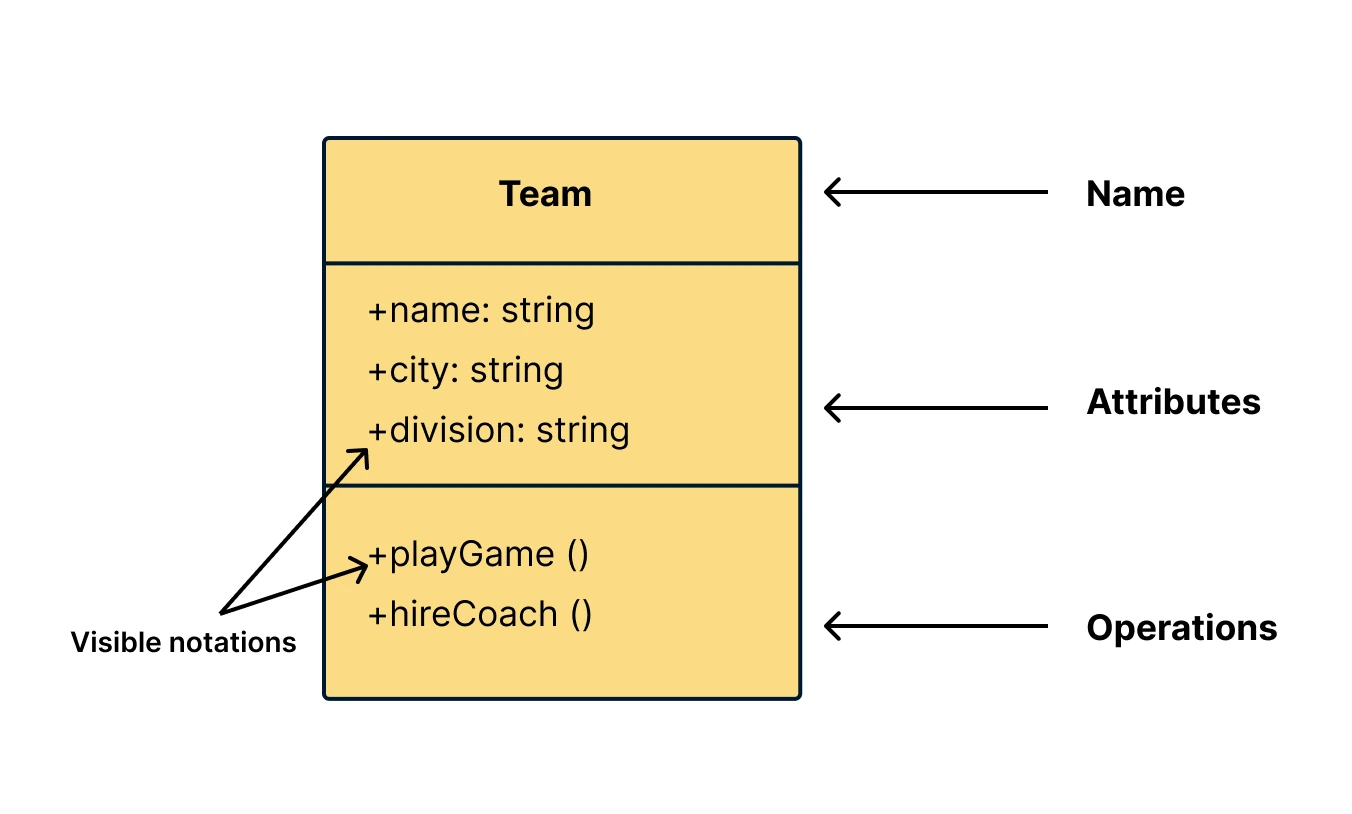
Each class encapsulates its attributes (data) and operations (functions) to define its structure and behavior. In a UML class diagram, a class is shown as a rectangle divided into three compartments, the top displays the class name, the middle lists its attributes, and the bottom contains its operations (methods).
Class Attributes: The characteristics or data fields of a class that describe its state, such as make, model, and year. Attributes are shown in the second compartment of a class in a UML class diagram, and the attribute type appears after a colon (for example, make: String or year: Int). In code, attributes correspond to member variables (data members) that store the object’s data.
Class Operations (Methods): The actions or functions a class can perform that define its behavior, such as start() or stop(). Operations appear in the third compartment of a UML class and represent the services the class provides. The return type is shown after a colon (e.g., startl(): void), and parameter types follow each parameter name (e.g., drive(in speed: Int): void). In code, operations map to class methods that implement behavior and enable object interaction.
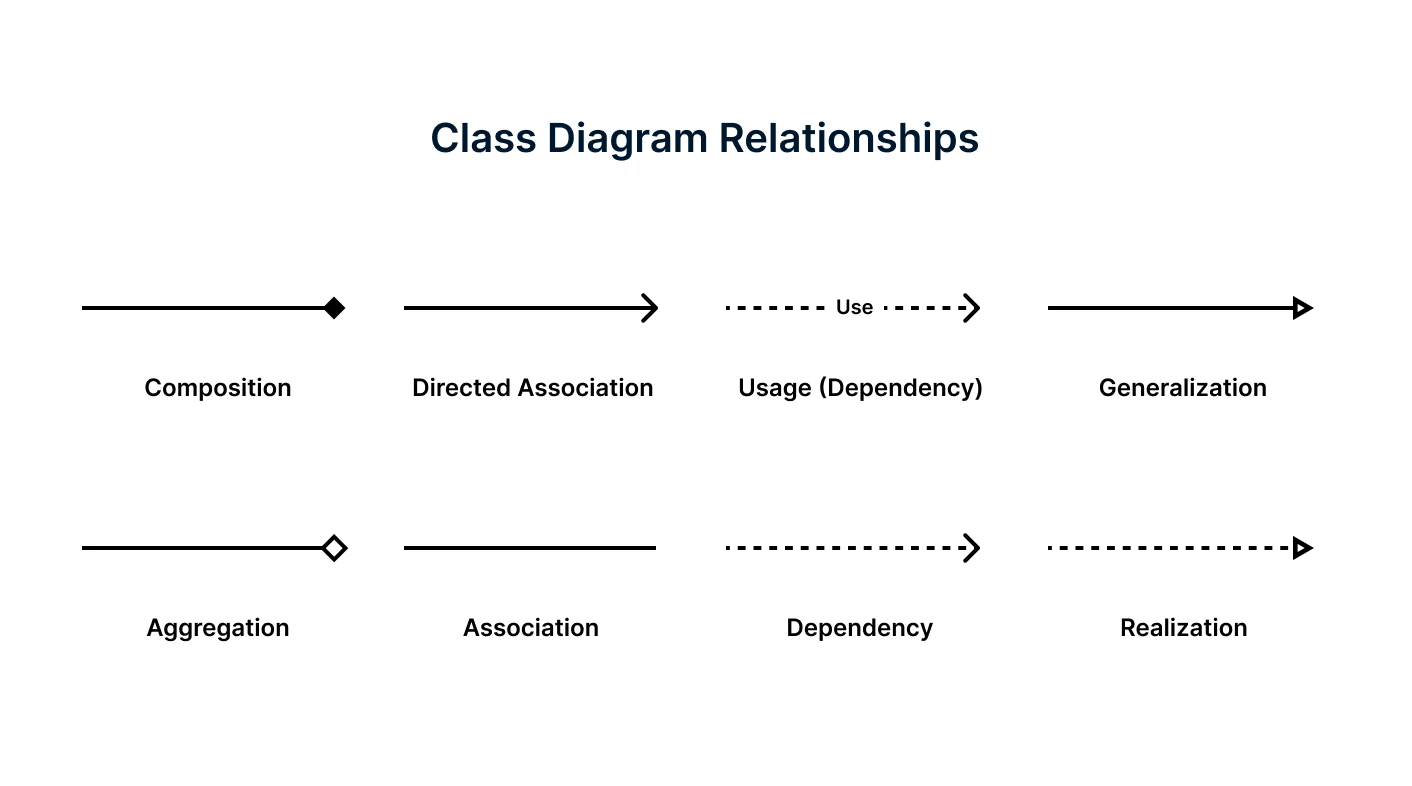
Relationships
Show how classes interact or depend on one another within the system. Different types of class diagram relationships convey various connection strengths and roles:
Association: A general relationship between two classes, often shown with a solid line and optional arrows to indicate direction or multiplicity. Example: A Customer places an Order.
Aggregation: A “has-a” relationship where one class contains other classes as components, but the parts can exist independently. It’s represented by a white (hollow) diamond on the aggregate side. Example: A Team has Players.
Composition: A stronger form of aggregation, where the parts cannot exist without the whole. It’s represented by a black (filled) diamond on the aggregate side. Example: A Car contains Wheels.
Inheritance (Generalization): An “is-a” relationship where one class inherits attributes and methods from another. Shown with a hollow triangle pointing toward the parent (superclass). Example: A Manager inherits from an Employee.
Dependency: A “uses-a” relationship showing that one class temporarily depends on another for some behavior or functionality. It’s usually illustrated with a dashed arrow. Example: A Report class depends on a DatabaseConnection class.
Realization: A “implements” relationship where one class fulfills the behavior or contract defined by another, often an interface or abstract class. It is represented by a dashed line with an unfilled arrowhead pointing toward the supplier (the interface or abstract class). Example: The PaymentProcessor class realizes the IPayment interface.
Navigability
Navigability shows the direction of access between two associated classes in a diagram. It is indicated by an arrow on the association line, showing whether one class can identify or reference instances of the other. For example, an arrow from Order to Customer means each order knows its customer, but not necessarily the other way around.
Multiplicities
Define how many instances of one class can be associated with another. Multiplicity represents cardinality in relationships in the following ways.
- Exactly one – 1
- Zero or one – 0..1
- Zero or Many – 0..* or *
- One or more – 1..*
Visibility
Defines the level of access for class attributes and methods, determining how data and behavior are exposed or hidden. Visibility ensures encapsulation, a key principle in object-oriented design. Visibility can be,
+Public – Accessible from anywhere.-Private – Accessible only within the class itself.#Protected – Accessible within the class and its subclasses.~Package – Accessible only within the same package or namespace.
Purpose of a Class Diagram
Clarify system structure: Class diagrams visually represent the building blocks of a system, its classes, attributes, and methods, making complex systems easier to understand.
Aid developers: Help programmers plan object relationships, identify reusable components, and write cleaner, more organized code.
Support analysts: Allow business analysts to map real-world processes into logical models that align with system requirements.
Guide stakeholders: Provide a high-level overview that helps non-technical stakeholders grasp how the system functions and where their requirements fit in.
Simplify object-oriented design: Show inheritance, associations, and dependencies clearly, helping teams design systems that are modular, scalable, and maintainable.
Improve collaboration: Act as a shared visual reference that aligns design understanding across teams during both planning and implementation phases.
How to Read Class Diagram Syntax
To read a class diagram, start by looking at the overall structure before focusing on individual elements. The goal is to understand how the system’s components connect and interact to form a complete model.
Step 1: Identify the Main Classes
Identify the core classes in the diagram. These usually represent key entities or objects within the system. Their names often reveal their roles, such as Customer, Order, or Product.
Step 2: Observe Relationships Between Classes
Follow the connecting lines to see how classes are related. Note the type of relationship (association, aggregation, composition, inheritance, or dependency) and the direction of arrows. This helps you understand which classes work together and how tightly they’re connected.
Step 3: Check Multiplicities
Examine the numbers or symbols near each end of a relationship line. They indicate how many instances of one class can be linked to another — for example, one Customer can be connected to many Orders.
Step 4: Trace Inheritance Hierarchies
Look for the triangle symbols representing inheritance. Follow them upward to identify parent classes and downward for subclasses. This shows how attributes and methods are shared or extended across different levels.
Step 5: Identify Class Responsibilities
Within each class, review the listed attributes and methods to understand its purpose. Attributes describe what the class knows, while methods show what it does. This distinction helps clarify the role each class plays in the system.
Step 6: Interpret Dependencies
Dashed arrows indicate one class uses another for specific operations. These are usually temporary or functional connections that occur during program execution.
Step 7: Build the Big Picture
Once you understand individual classes and relationships, step back and view how the entire system operates. You’ll see how data moves, how responsibilities are divided, and how components collaborate to achieve the system’s functionality.
Real World Applications of Class Diagrams
Software Design and Development: Used to plan and visualize the structure of object-oriented software before coding begins, ensuring consistency between design and implementation.
Database Design: Help define entities, their attributes, and relationships, serving as a conceptual model for creating relational database schemas.
System Analysis: Assist analysts in modeling the logical structure of systems to understand requirements, workflows, and interactions between components.
Documentation and Maintenance: Serve as long-term documentation for understanding existing codebases, which is especially valuable during debugging or system upgrades.
Business Process Modeling: Represent real-world business objects (like customers, orders, or invoices) and their interactions, bridging the gap between business logic and technical implementation.
Reverse Engineering: Used to extract class diagrams from existing codebases to analyze legacy systems or refactor complex applications.
Educational and Training Tools: Help students and new developers understand the principles of object-oriented programming (OOP) and system architecture.
Class Diagram vs. Other UML Diagrams
While a class diagram focuses on the static structure of a system, by showing classes, attributes, methods, and relationships, other UML diagram types capture how the system behaves and interacts over time. Understanding the differences helps you choose the right diagram for your purpose.
Diagram Type | Focus | Purpose | Best Used For |
Class Diagram | Structure | Defines system architecture (classes, attributes, relationships) | Designing or documenting system models |
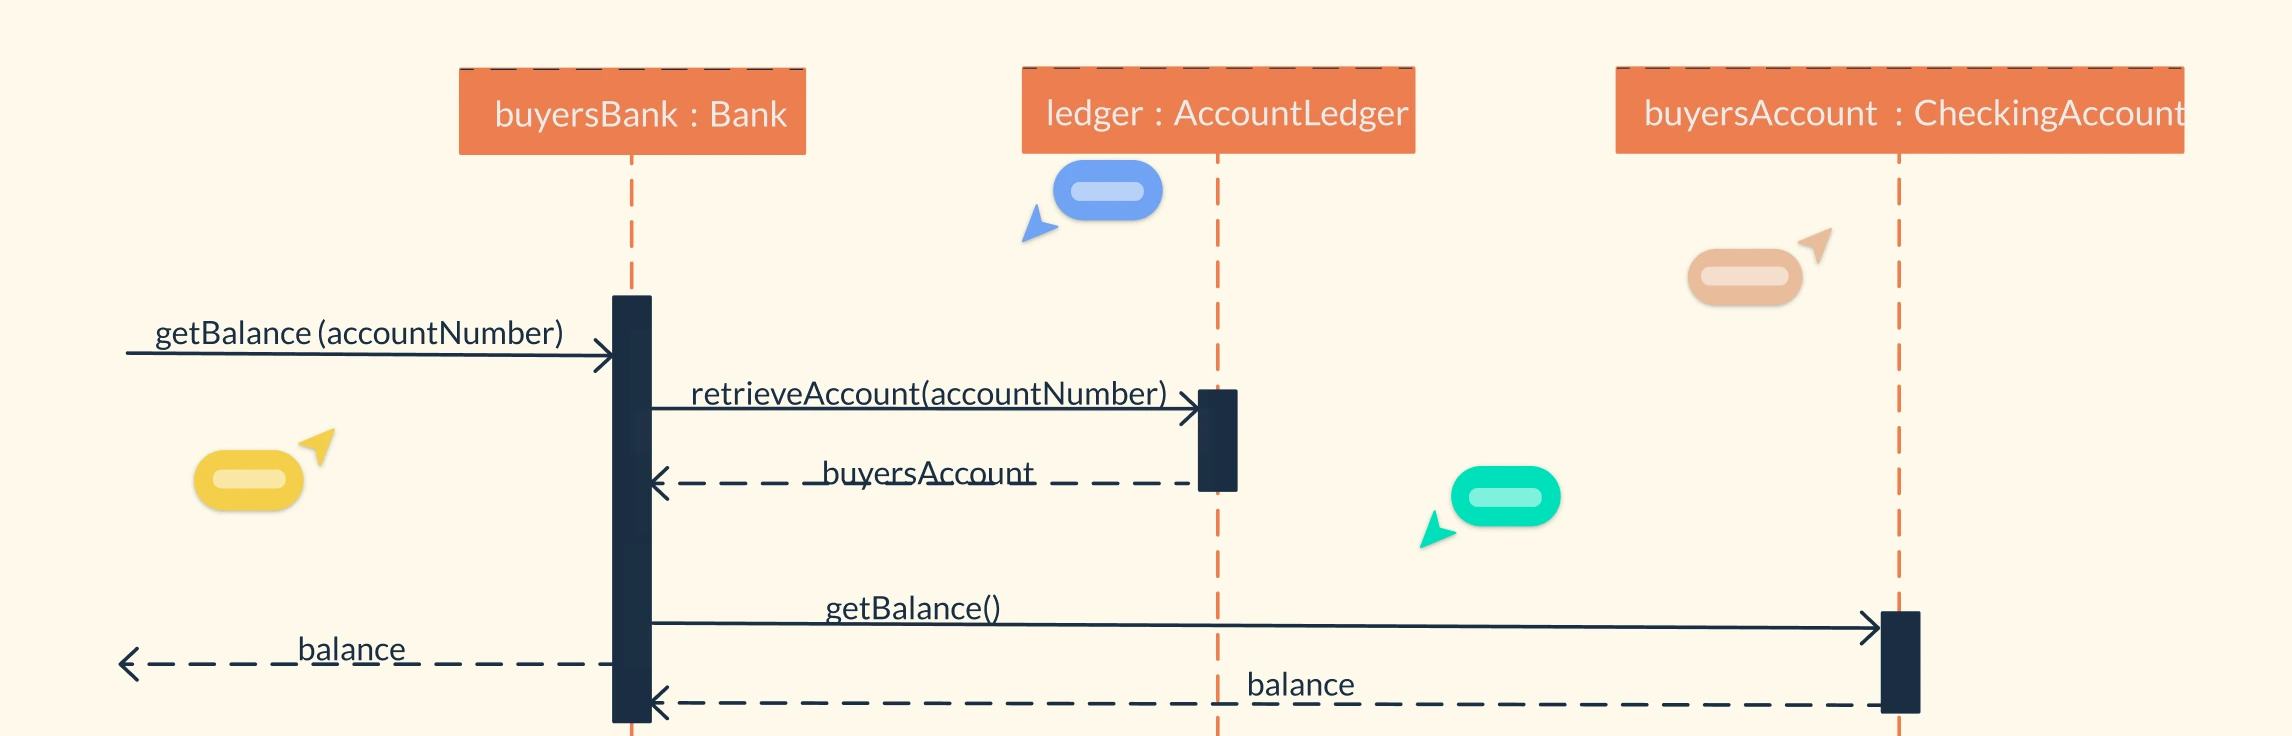
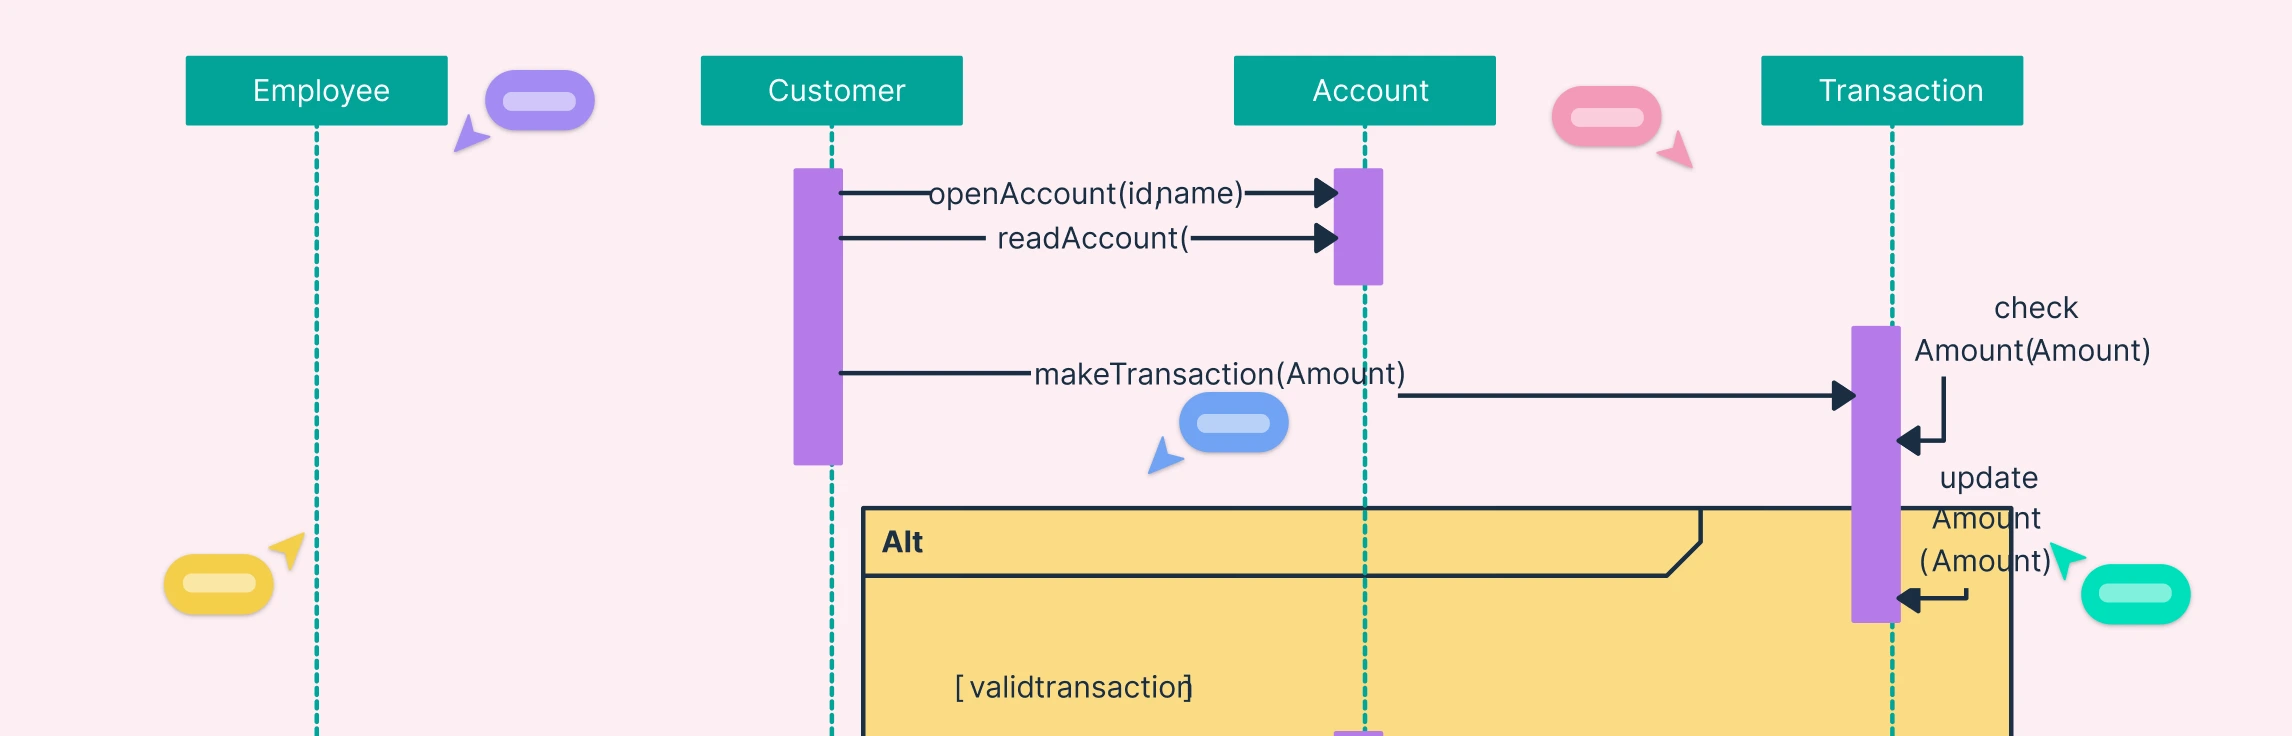
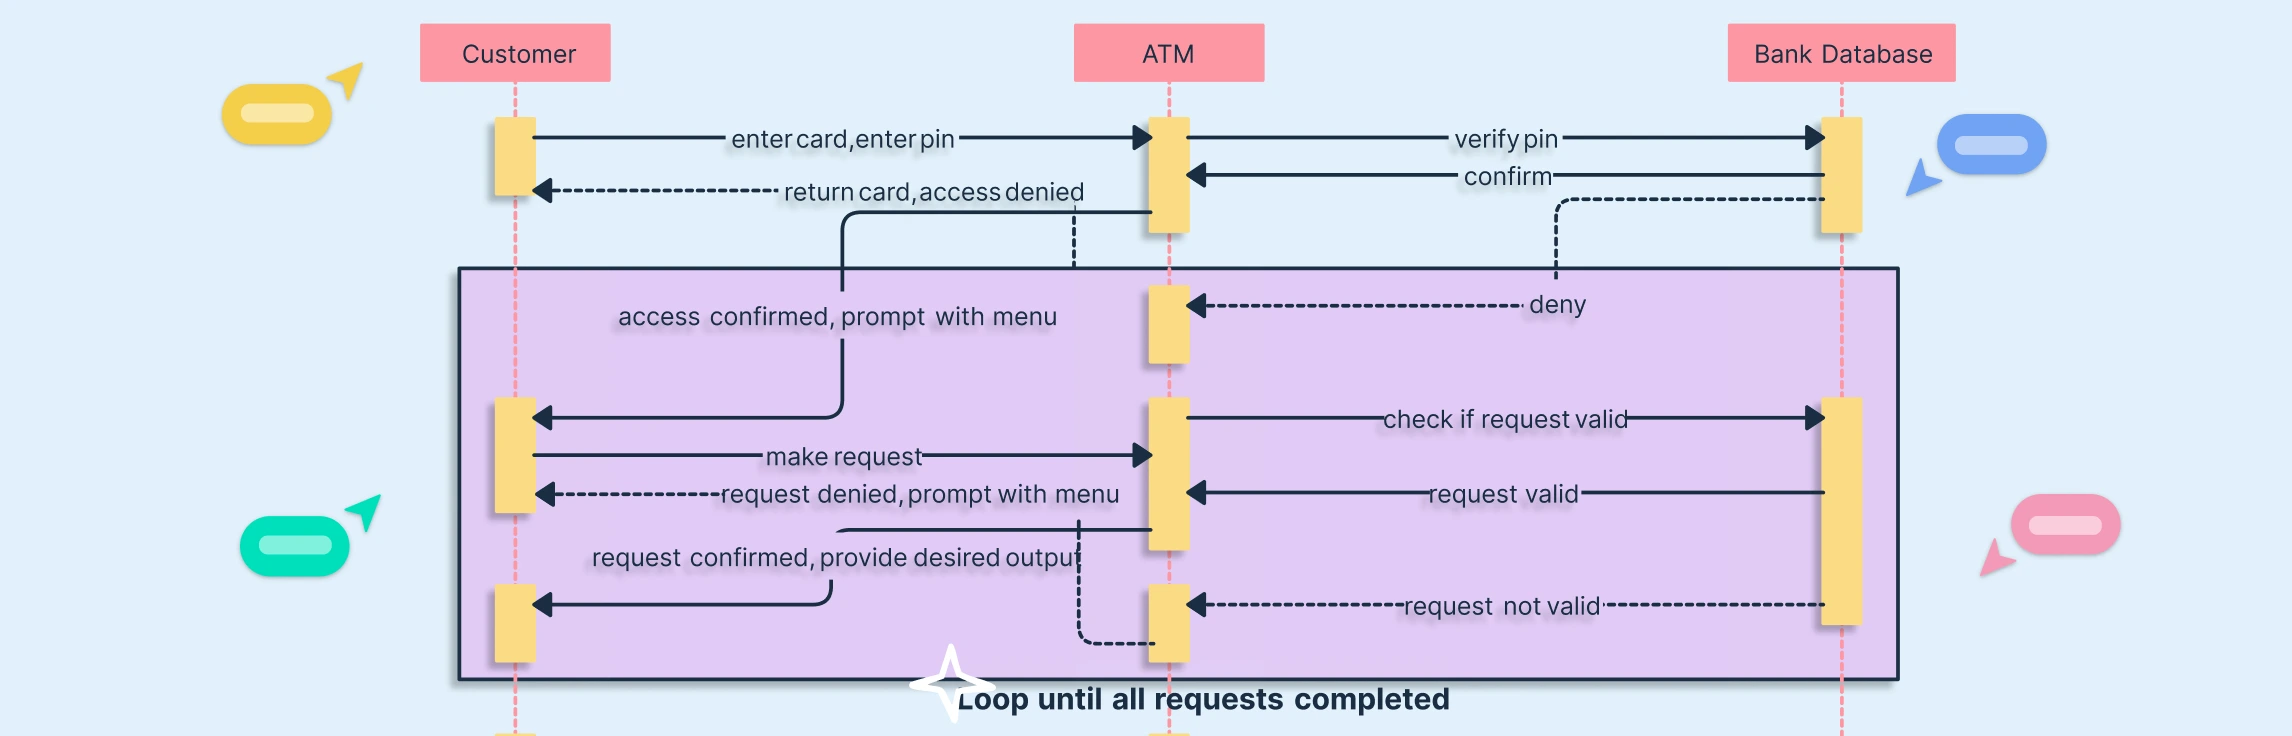
Sequence Diagram | Behavior over time | Shows object interactions and message order | Modeling workflows or system operations |
Use Case Diagram | User interaction | Defines functional requirements | Gathering or communicating system goals |
Object Diagram | Instance-level view | Represents real examples of classes and links | Testing or visualizing runtime scenarios |
Class Diagrams in the Software Development Lifecycle
Class diagrams can be applied at different stages of the software development lifecycle, each serving a unique purpose. They are typically modeled from three progressive perspectives as the system design evolves:
Conceptual Perspective: At this level, the diagram represents real-world concepts and their relationships within the problem domain. It focuses on understanding the business or domain logic rather than implementation details, making it language-independent and useful for analysts and stakeholders.
Specification Perspective: This perspective focuses on the software design and interfaces rather than real-world objects. It defines how classes interact and what services they provide, without tying them to a specific technology or implementation.
Implementation Perspective: At this stage, the diagram reflects the actual software implementation in a chosen language or platform. Classes, methods, and data types are detailed according to the system’s code structure, helping developers translate design into working software.
Free Class Diagram Templates to Get Started


Helpful Resources for Class Diagrams
Learn about making UML Class Diagrams with a tutorial.
Browse our collection of class diagram templates.
Discover all the different types of UML diagrams.
FAQs about UML Class Diagrams
Can class diagrams represent real data or runtime states?
For complex systems, should I use one large class diagram or multiple smaller ones?
How do you indicate a generic class or interface in a UML Class Diagram?
What is the difference between a Domain Class Diagram and a Design Class Diagram?
Resources
Evans, A. S. “Reasoning with UML Class Diagrams.” IEEE Xplore, 1 Oct. 1998, https://ieeexplore.ieee.org/abstract/document/766304.
Osman, Hafeez, et al. UML Class Diagram Simplification. 1 Oct. 2012, pp. 1–6, https://doi.org/10.1145/2424563.2424570.