UML Diagram Definition
A UML Diagram is a visual representation of a system created using the Unified Modeling Language (UML) to illustrate how different parts of a software system interact, function, or are structured. It helps developers, designers, and stakeholders understand and communicate system design clearly before or during implementation. UML diagrams are generally divided into two main types, structural and behavioral. In complex organizations, 43% of people in highly matrixed environments report complexity hurts decision quality and speed, which is why clear system modeling matters early (Marmolejo et al., 2021).
Why Do We Need UML?
Standardized Communication: UML gives developers, analysts, and stakeholders a common visual language to describe system architecture, behavior, and interactions. This reduces misunderstandings in design discussions.
Simplifies Complex Systems: Large systems can be difficult to explain in words or code alone. UML breaks them down into manageable visual components (like classes, objects, activities, and deployments) for easier analysis and collaboration.
Improves Design Quality: By modeling systems before coding, UML helps identify flaws, dependencies, and inefficiencies early, leading to cleaner and more scalable architectures.
Supports Multiple Views of a System: UML offers different diagram types (e.g., Class, Sequence, Use Case, Activity, Deployment), allowing teams to view a system from different perspectives such as structure, behavior, and implementation.
Facilitates Documentation and Maintenance: UML diagrams serve as living documentation that makes it easier to maintain, update, and onboard new team members as the system evolves.
Enhances Collaboration: Whether between developers, testers, or clients, UML diagrams provide a shared reference point that improves alignment and decision-making.
Tool Integration and Automation: Many modern development tools can generate code from UML diagrams or reverse-engineer diagrams from code, speeding up design and implementation cycles.
Types of UML Diagrams
Unified Modeling Language (UML) diagrams provide a standardized way to visualize and document different aspects of a system, from its structure to its behavior. Broadly, UML diagrams fall into two major categories: structural and behavioral. Understanding the distinction between these helps in selecting the right diagram type for your modeling needs.
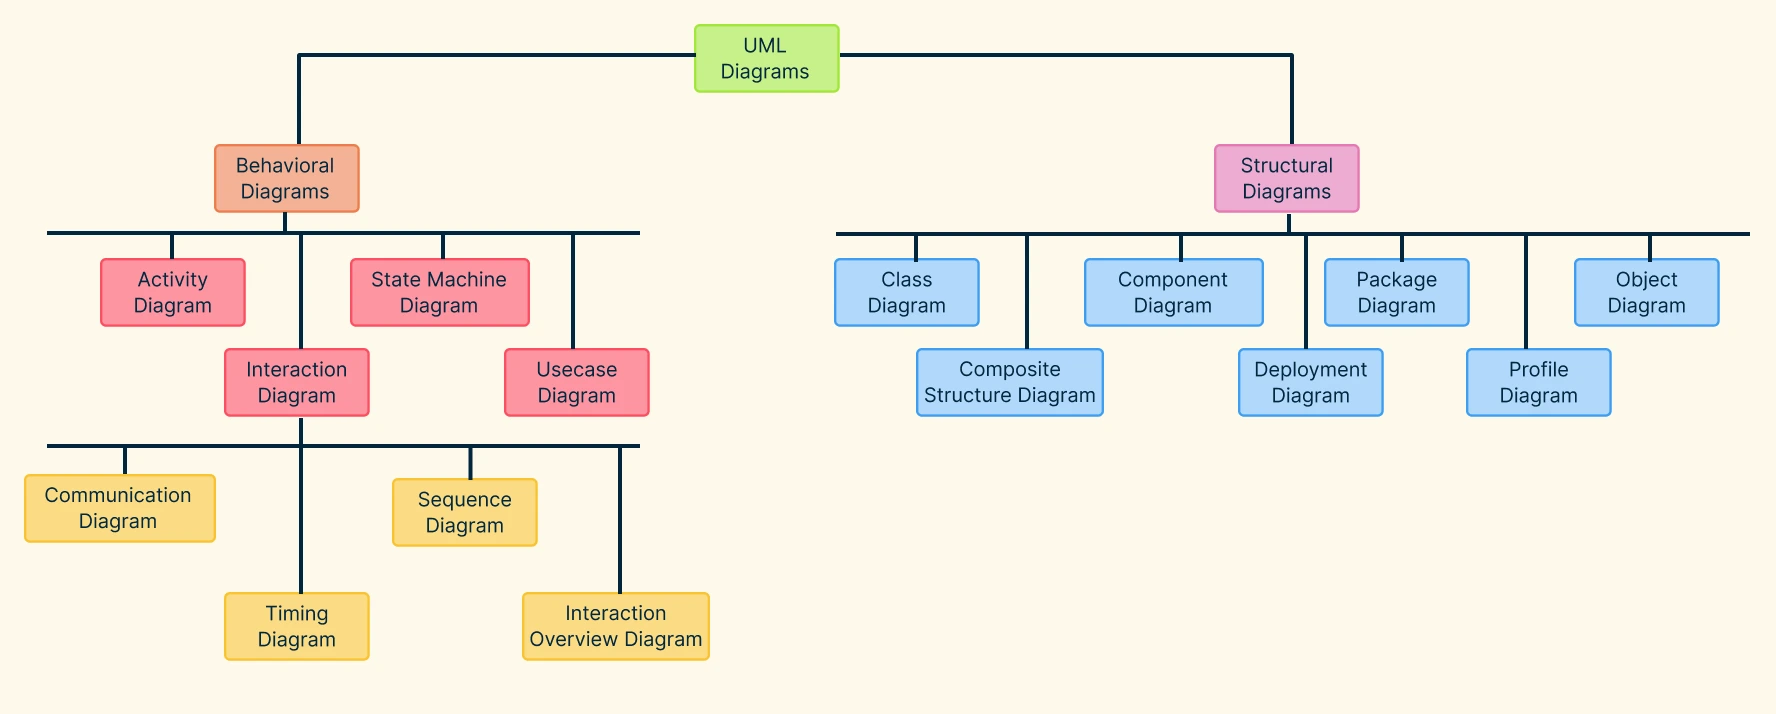
Structural UML Diagrams
Structural diagrams represent the static aspects of a system. These are the components, relationships, and organization. They show how elements like classes, objects, and components are connected and how the system is built. Common structural UML diagrams include:
- Class Diagram – Shows classes, attributes, methods, and relationships. Design your system architecture effortlessly with the Class Diagram Tool and build clear, detailed models of your software structure.
- Object Diagram – Depicts instances of classes at a specific moment in time. Explore this visually with the Object Diagram Tool to easily map and analyze object interactions.
- Component Diagram – Illustrates how components are wired together to form a complete system.
- Deployment Diagram – Visualizes how software components are deployed across hardware nodes. Design and customize your own system with the Deployment Diagram Tool to plan and optimize your system architecture.
- Package Diagram – Groups related elements into packages for better organization.
- Profile Diagram – Customizes UML models using stereotypes, tagged values, and constraints.
- Composite Structure Diagram – Represents the internal structure of a class and how its parts interact.
Behavioral UML Diagrams
Behavioral diagrams represent the dynamic aspects of a system. This includes how it behaves, interacts, and responds to events over time. They focus on the logic and flow of processes between components or users. Common behavioral UML diagrams include:
- Use Case Diagram – Shows interactions between users (actors) and the system. Map your system’s user interactions effortlessly with the Use Case Diagram Software and visualize how each actor contributes to system goals.
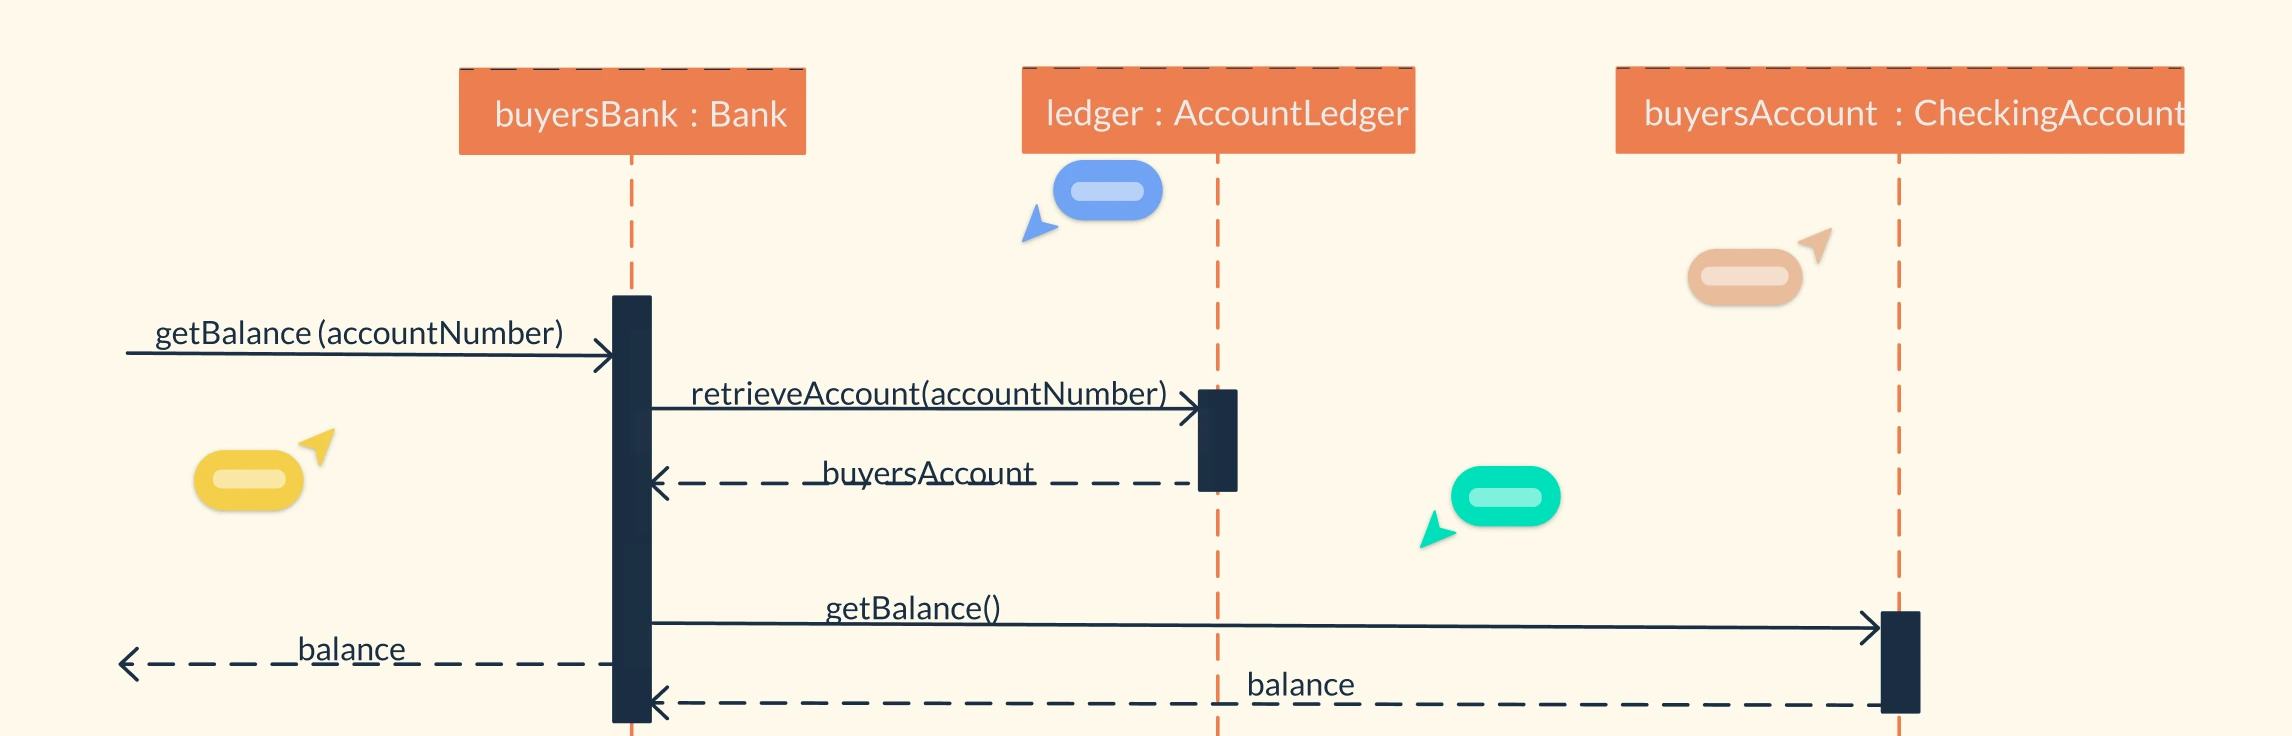
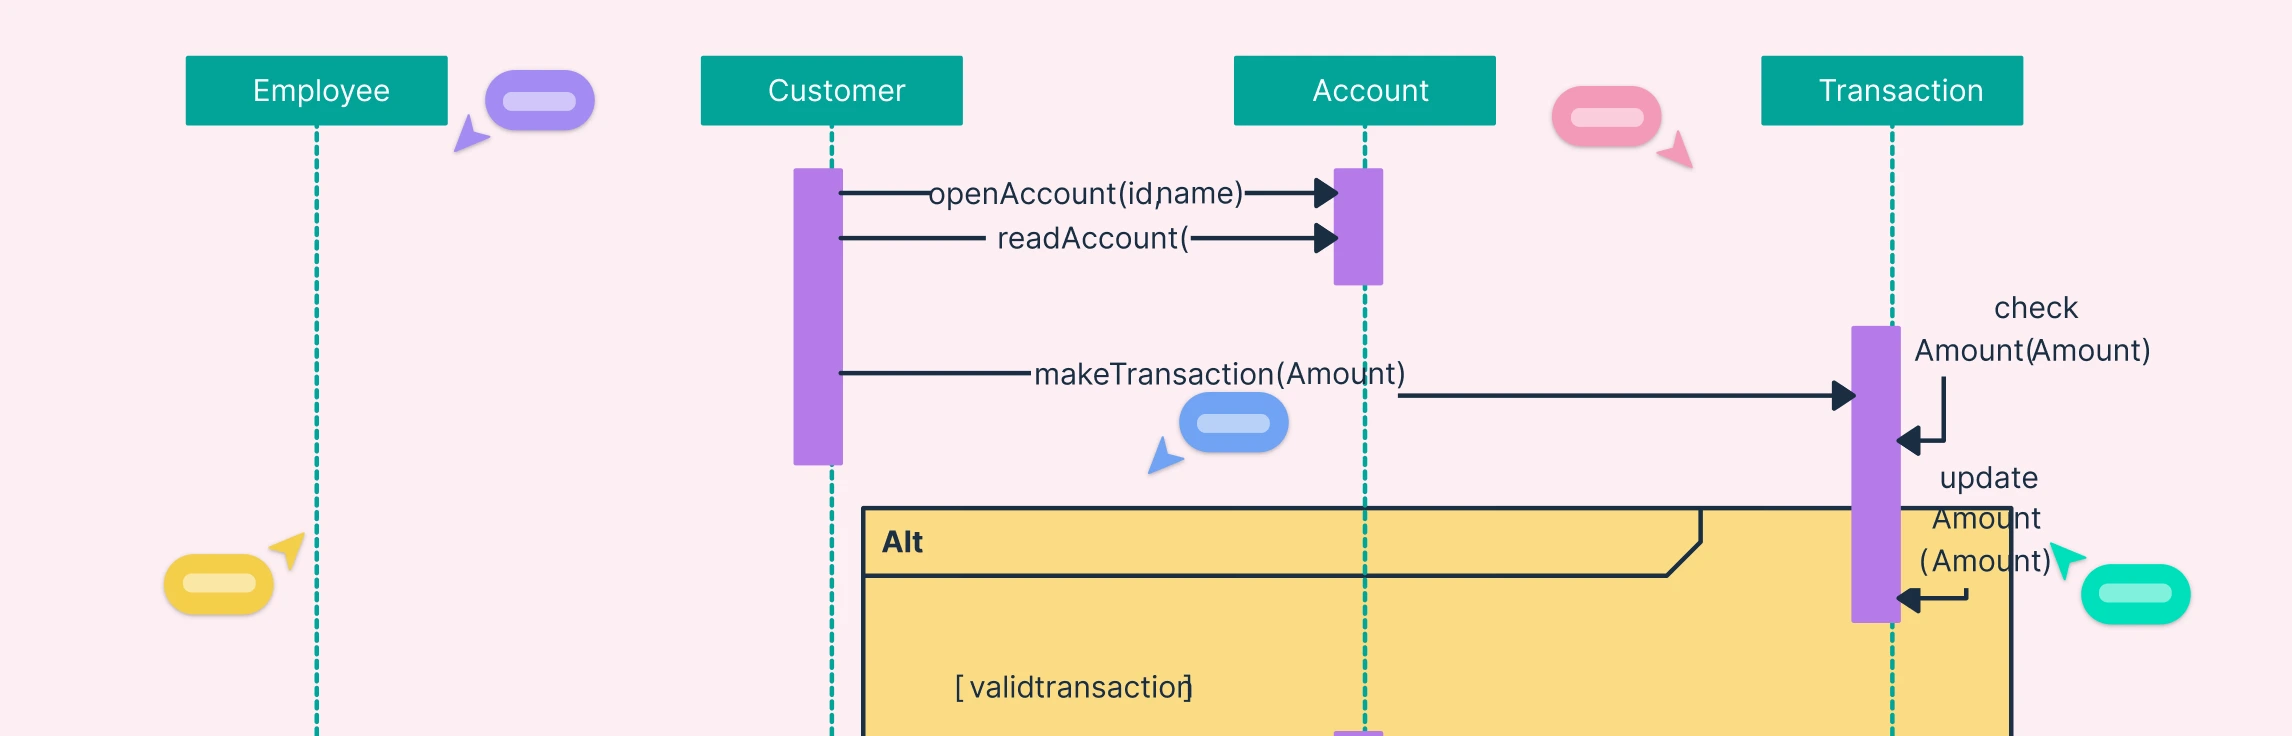
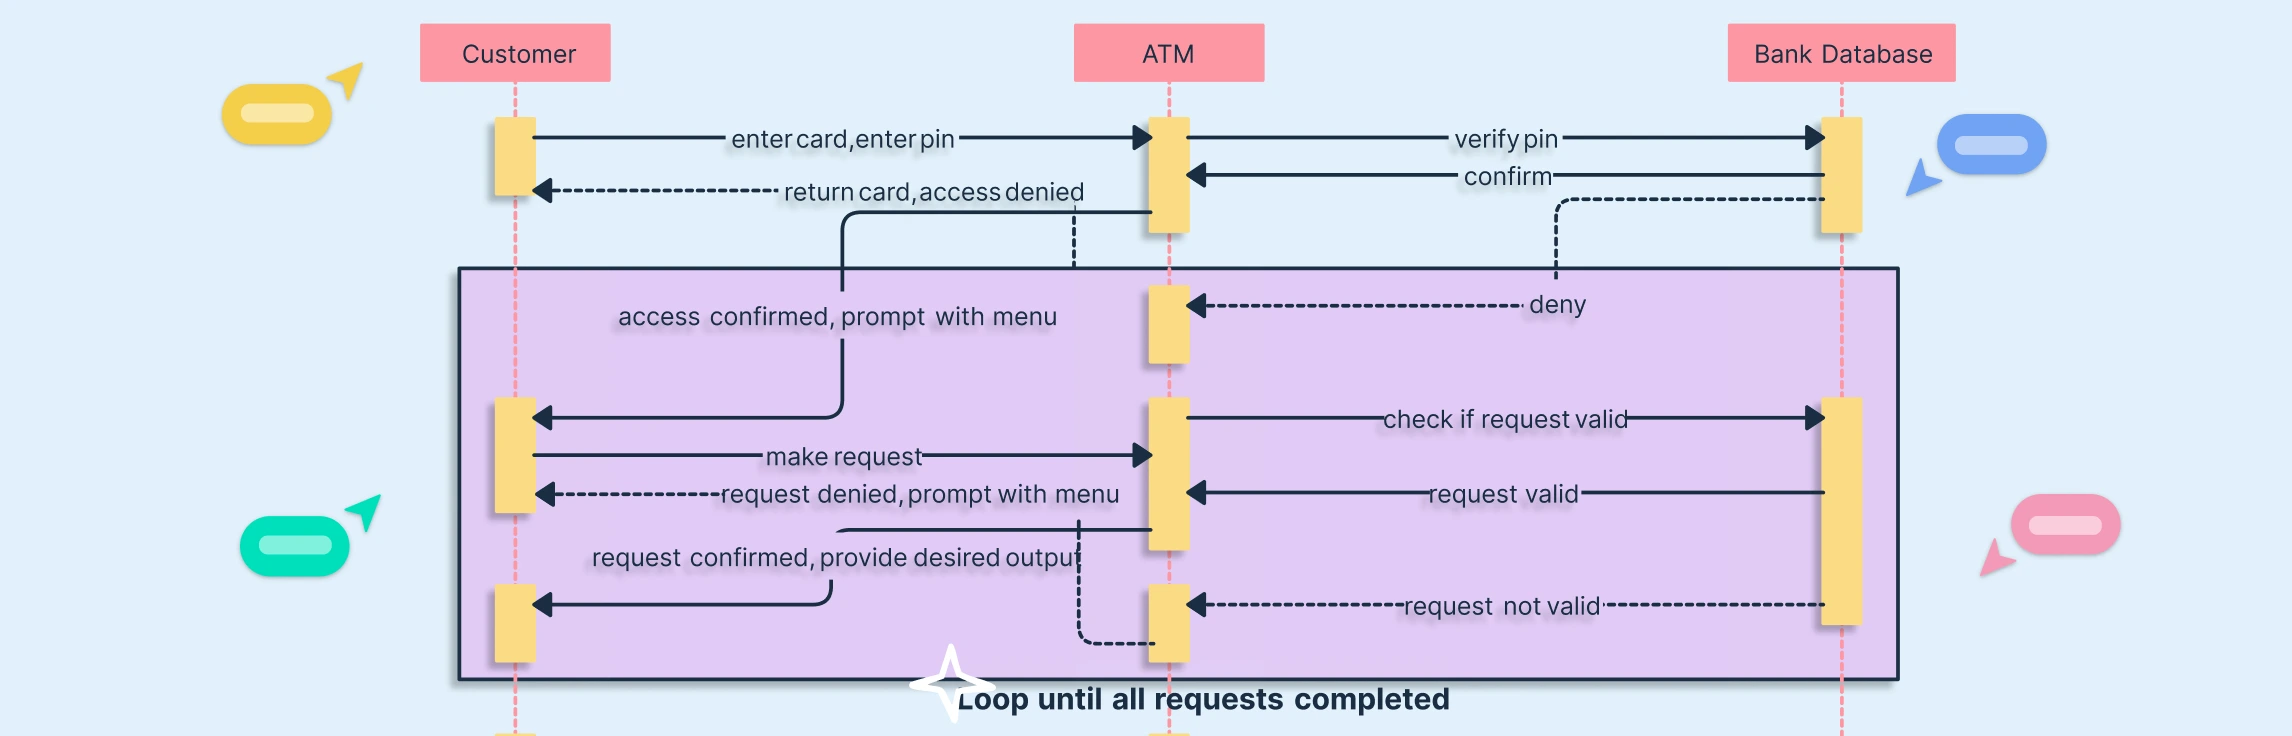
- Sequence Diagram – Details the flow of messages and interactions between objects.
- Activity Diagram – Visualizes workflows and decision points within a process. Create clear, interactive process flows with the Activity Diagram Maker to map actions, conditions, and outcomes visually.
- State Machine Diagram – Represents object states and transitions based on events. Illustrate dynamic system behavior with the State Machine Diagram Tool and visualize how events trigger state changes.
- Communication Diagram – Highlights object interactions in a structured format.
- Interaction Overview Diagram – Combines activity and sequence diagrams to show overall control flow.
- Timing Diagram – Focuses on object behavior over time, showing changes in state or condition across a timeline. Visualize time-based interactions easily with the Timing Diagram Maker to track state changes and event sequences clearly.
Benefits for Using UML Diagrams
Clear Visualization of Systems: UML diagrams provide a graphical view of system structure and behavior, making complex software easier to understand and explain.
Improved Communication: They create a common visual language between developers, designers, and stakeholders, reducing misunderstandings and aligning everyone on system goals. Better communication and collaboration in interaction-heavy work has been associated with 20-25% productivity gains (Keller and Meaney, 2013).
Better System Design and Architecture: By visualizing relationships, dependencies, and workflows, UML helps in designing scalable, maintainable, and well-organized architectures.
Early Error Detection: Modeling with UML allows teams to identify design flaws, missing requirements, or inefficiencies before implementation, saving time and cost. This is especially important as 92% of companies consider redesign important and 80%+ are actively restructuring or recently restructured (Deloitte, 2016).
Efficient Documentation: UML diagrams serve as living documentation that evolves with the system, making it easier to maintain and onboard new team members.
Supports Multiple Development Methodologies: UML is flexible and can be used in Agile, Waterfall, or hybrid environments for planning, analysis, and iterative design.
Enhanced Collaboration: With Creately, teams can collaboratively create and edit UML diagrams in real time, ensuring continuous alignment across distributed or hybrid teams.
When to Use UML Diagrams
UML Diagrams in Software Engineering
In software engineering, UML diagrams help teams design and communicate system architecture effectively. They provide a shared language between developers, architects, and stakeholders, reducing ambiguity in system design. UML makes it easier to plan features, identify dependencies, and ensure that both functional and technical requirements are met. By visualizing how components interact and evolve, teams can detect design flaws early, maintain consistency throughout development, and build scalable, maintainable systems.
UML Diagrams in Business Process Management
In business process management, UML diagrams help map, analyze, and optimize business workflows. They make processes more transparent by illustrating how tasks, decisions, and stakeholders connect across different operations. This clarity allows organizations to identify inefficiencies, eliminate redundancies, and streamline operations. UML also bridges the gap between business and IT teams by providing a unified view of how business logic aligns with technical systems, supporting better process automation and strategic decision-making.
UML Diagrams in Project Management
In project management, UML diagrams serve as visual planning and communication tools that bring structure and clarity to complex projects. They help project teams understand relationships between tasks, systems, and stakeholders, ensuring everyone stays aligned on goals and deliverables. UML supports better coordination across departments, simplifies documentation, and enhances stakeholder communication, ultimately helping projects stay organized, transparent, and on track from start to finish.
UML Diagram Best Practices
Define a Clear Purpose: Start with a clear goal for your diagram whether it’s to model structure, visualize behavior, or communicate design. Each diagram should answer a specific question or serve a defined audience.
Keep It Simple and Focused: Avoid overloading diagrams with too many details. Focus on the essential elements that convey your message clearly. Use multiple smaller diagrams if needed.
Use Consistent Notation: Stick to standard UML symbols, naming conventions, and line styles. Consistency improves readability and ensures everyone interprets the diagram the same way.
Maintain Logical Organization: Arrange elements logically (top-to-bottom or left-to-right) to reflect hierarchy, sequence, or flow. A well-organized layout makes complex systems easier to follow.
Add Descriptive Labels and Notes: Use meaningful names for classes, objects, and relationships. Add brief annotations or notes where necessary to explain intent or clarify complex interactions.
Keep Diagrams Up-to-Date: Update UML diagrams as the system evolves. Outdated visuals can cause confusion and misalignment between design and implementation.
Collaborate and Review Regularly: Encourage peer reviews and feedback to validate accuracy, maintain consistency, and improve overall diagram quality.
Common Mistakes to Avoid When Making UML Diagrams
Using Incorrect Relationships or Connectors: Misusing associations, dependencies, or generalizations can distort meaning and lead to incorrect interpretations of system behavior.
Combining Multiple Diagram Types in One: Mixing elements from different UML diagrams (for example, adding sequence flow into a class diagram) makes the purpose unclear. Keep each diagram focused on a single UML view.
Neglecting Hierarchy and Scope: Failing to define boundaries between subsystems or modules can make diagrams ambiguous and harder to navigate. Use packages or separate diagrams to manage scope clearly.
Ignoring Audience and Context: A diagram meant for developers shouldn’t look the same as one meant for business stakeholders. Tailor the level of technical detail to suit the audience.
Free UML Diagram Templates to Get Started


Helpful Resources for UML Diagrams
An overview of modeling diagram objects used in UML.
Learn about the basic guidelines for making UML Class diagrams.
Browse our collection of UML diagram templates.
FAQs about UML Diagrams
Should I create UML diagrams before or after coding?
What UML diagrams are required for a web application?
Can UML Diagrams be used in Agile development?
What is the difference between UML and flowcharts?
Resources
Dobing, Brian, and Jeffrey Parsons. “Dimensions of UML Diagram Use.” IGI Global EBooks, 1 Jan. 2009, pp. 1760–1779, https://doi.org/10.4018/978-1-60566-060-8.ch104.
Koç, Hatice, et al. “UML Diagrams in Software Engineering Research: A Systematic Literature Review.” Proceedings, vol. 74, no. 1, 10 Mar. 2021, p. 13. MDPI, https://doi.org/10.3390/proceedings2021074013.