Drowning in sticky notes after a brainstorming session? Struggling to make sense of scattered ideas or conflicting feedback?
That’s where an affinity diagram comes in. Also known as an affinity map or the K-J method, this simple yet powerful visual tool helps you group related ideas, uncover patterns, and bring structure to messy information. In this guide, you’ll learn what an affinity diagram is, how to create one from scratch, and when to use an affinity diagram to improve collaboration and decision-making. We’ll also walk you through real-world affinity diagram examples, share expert tips, and give you access to free templates so you can start organizing your thoughts more strategically.
What Is an Affinity Diagram?
An affinity diagram is a visual brainstorming and data organization tool used to sort and categorize ideas, data, or insights based on natural relationships or common themes. It is one of the Seven Management and Planning tools and is also known as the K-J method, affinity chart, or affinity map. It is especially useful when dealing with large volumes of unstructured information, typically gathered from brainstorming sessions, meetings, interviews, or research activities.
The affinity diagram definition centers around its ability to help teams make sense of complex or scattered information by grouping related ideas into meaningful clusters. These clusters or themes are called affinity sets or affinity groups. By clustering related items together, the affinity diagram highlights connections, patterns, and overarching themes that might otherwise go unnoticed. This helps teams gain deeper insight into the issue under discussion.
The Origin of the Affinity Diagram: Jiro Kawakita and the K-J Method
The affinity diagram was developed by Japanese anthropologist Jiro Kawakita in the 1960s as a way to organize qualitative research data. Originally called the K-J method, it was designed to help researchers and teams uncover hidden relationships among scattered ideas. Today, this method is widely used in project management, UX design, quality improvement, and various fields where synthesizing information is crucial.
Why Use an Affinity Diagram?
Using an affinity diagram simplifies the process of analyzing complex information. When dealing with vast amounts of qualitative data, such as customer feedback or creative brainstorming outputs, things can get complicated. This is where the affinity diagram comes in handy. It simplifies the process of analysis by visually breaking down data into manageable sections, encouraging collaboration and deeper insights.
Seeing the Bigger Picture with an Affinity Diagram
One of the greatest strengths of an affinity diagram is its ability to help teams see the bigger picture. When faced with a chaotic mix of ideas, feedback, or research data, it’s easy to get overwhelmed or miss critical insights. The affinity diagram helps group ideas under main themes that help to see a bigger picture of the problem at hand. The structured approach of the affinity diagram helps clarify the connections between different pieces of information, allowing teams to step back and understand broader trends, root causes, or strategic directions. It transforms scattered input into an organized visual map, making it easier to prioritize actions, make informed decisions, and align everyone around shared insights.
How to Create an Affinity Diagram
Knowing how to make an affinity diagram can help teams break down complex information, uncover patterns, and drive more focused discussions. Whether you’re brainstorming solutions, organizing research findings, or gathering user feedback, the steps below will guide you through creating an effective affinity diagram.
Step 1: Collect Ideas or Data
Begin by gathering all the raw information you want to organize. This could come from a brainstorming session, survey responses, meeting notes, research findings, or customer feedback. Write each idea or data point on a separate sticky note, index card, or digital note if using an Affinity Diagram Maker.
Step 2: Share and Display the Information
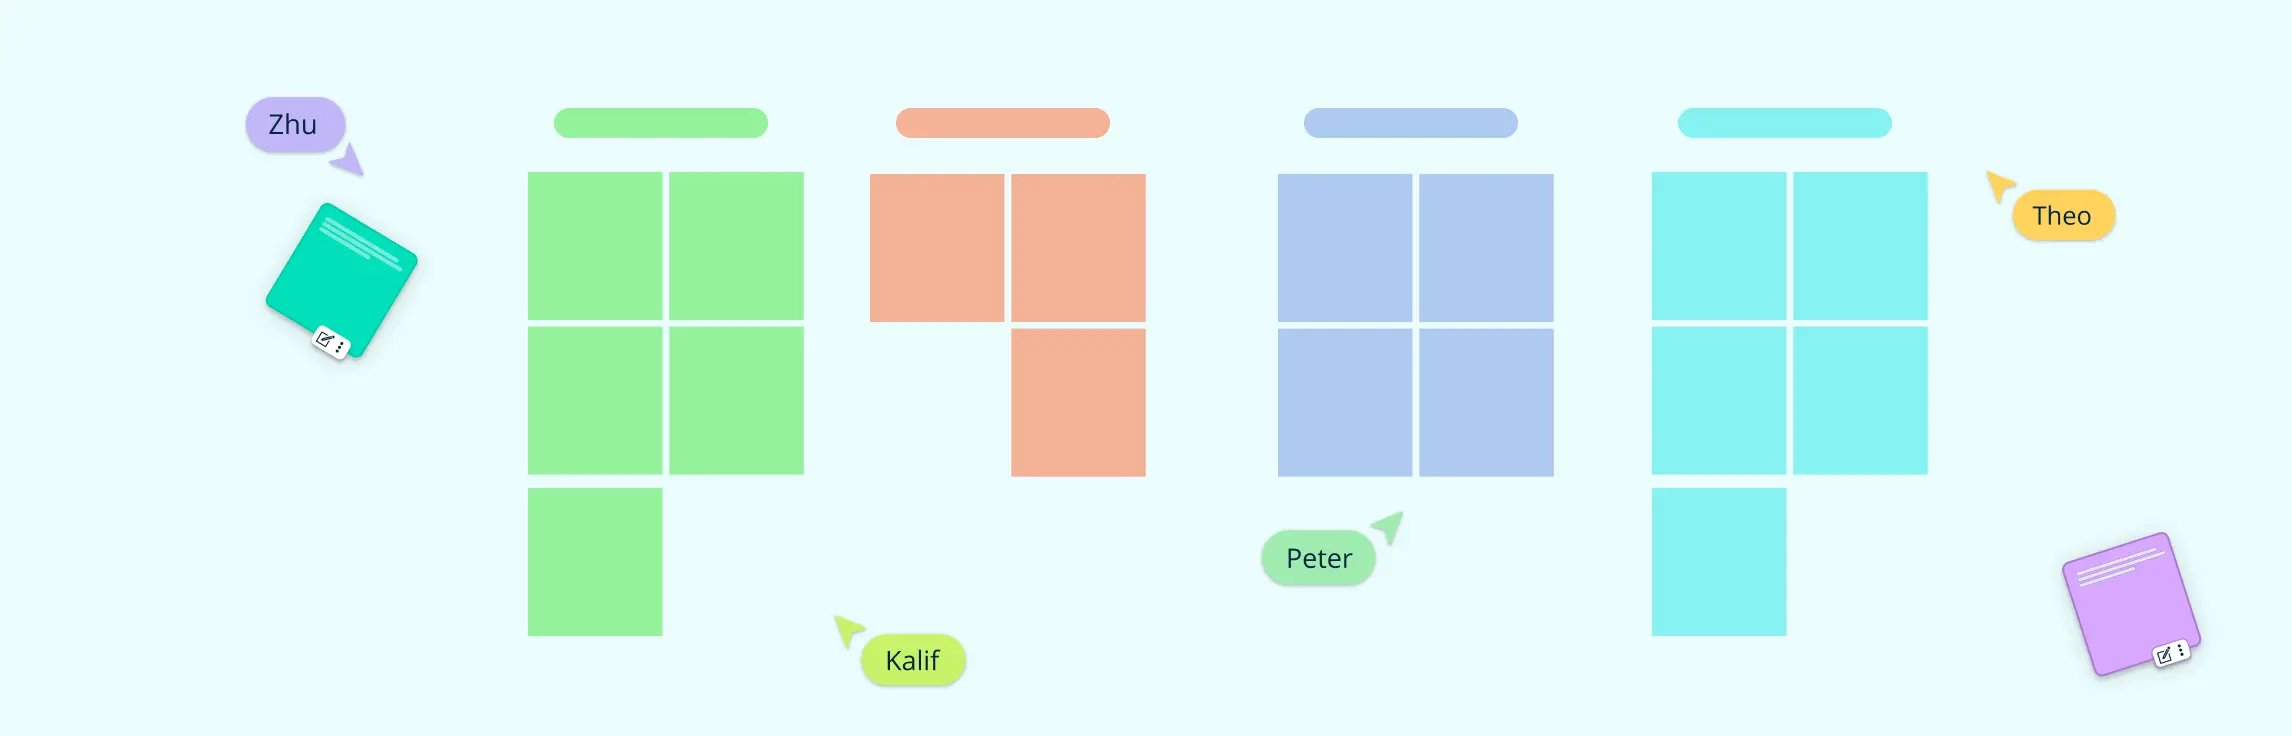
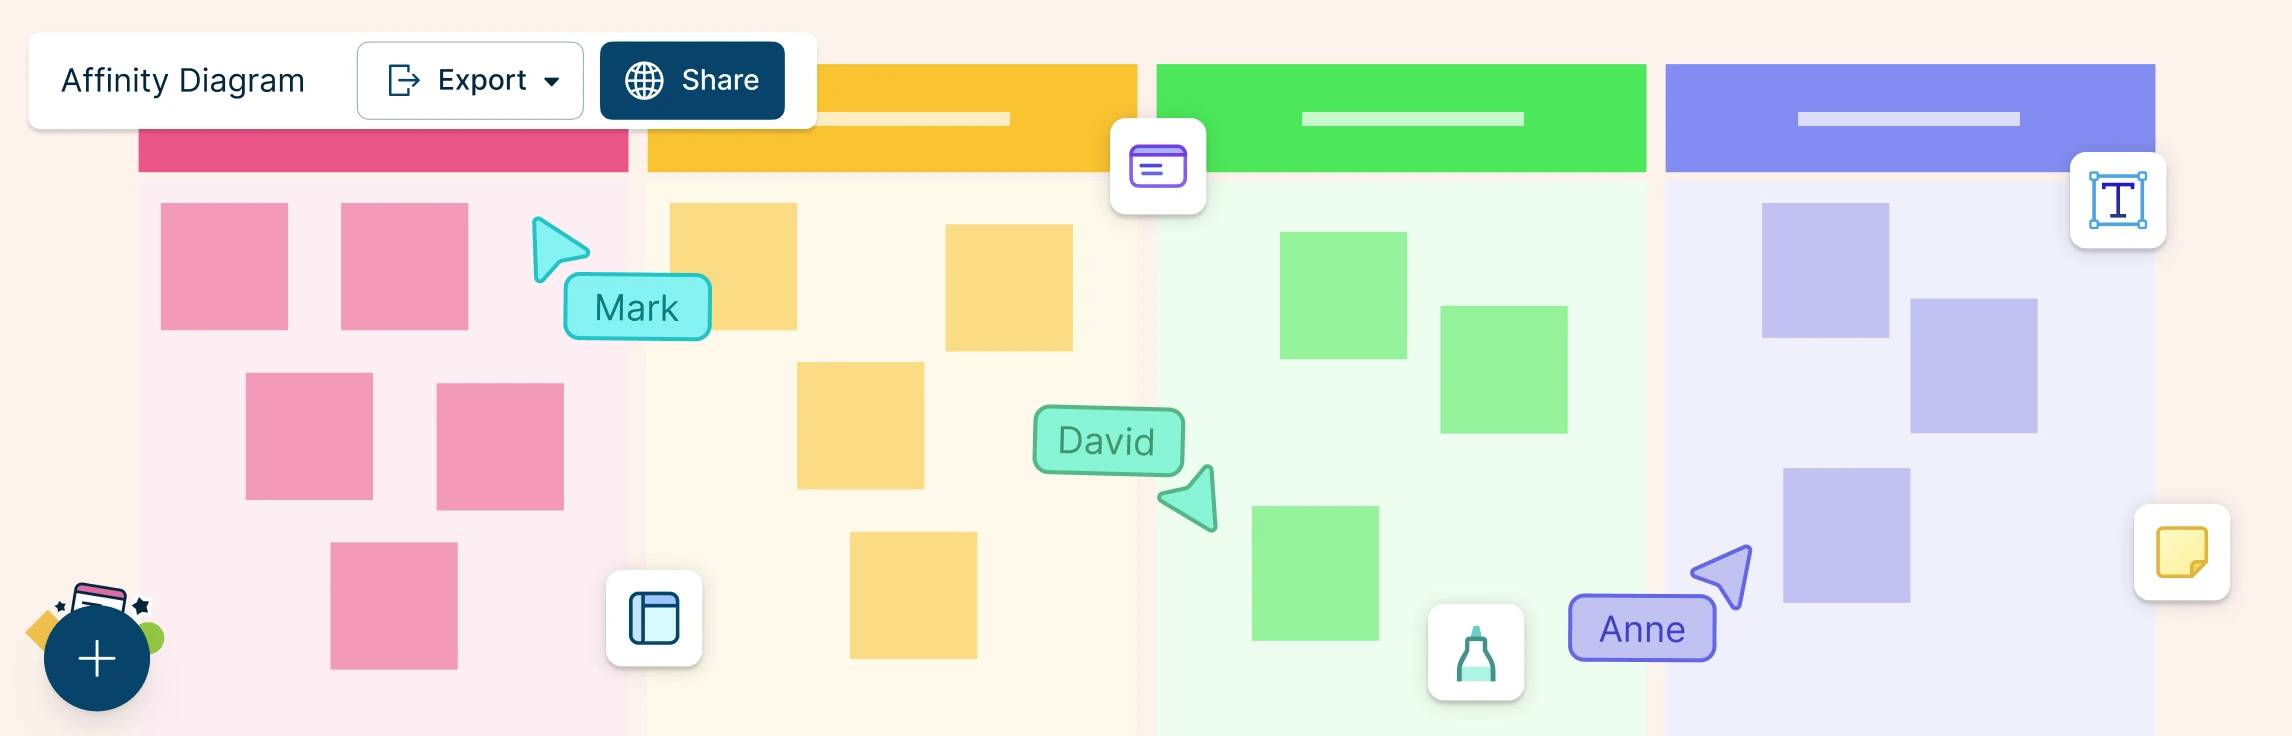
Once you’ve collected the data, display all the individual items in a shared space—on a wall, whiteboard, or digital canvas. Avoid pre-sorting at this stage. The goal is to let the ideas “speak” for themselves without any assumptions.
Step 3: Group Similar Items Together
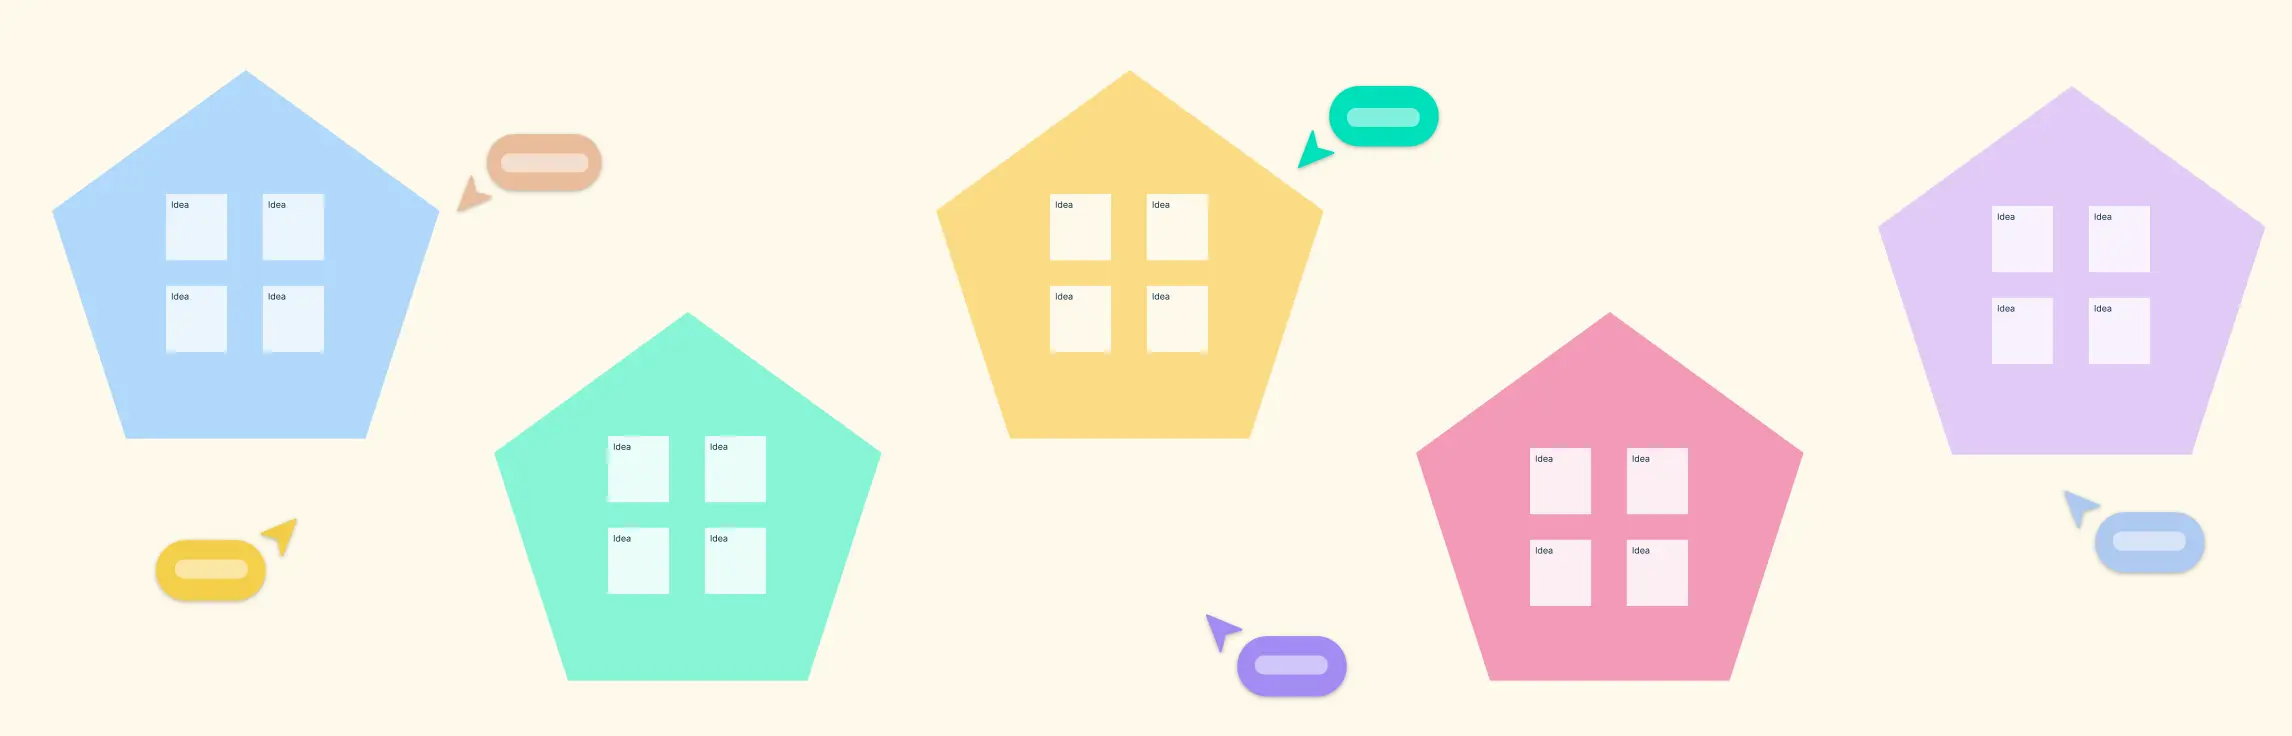
Now, it’s time to identify connections. Begin clustering items that seem related or fall under a similar theme. These groupings form the core of your affinity diagram. Don’t rush—take the time to review and rearrange as needed. This process often sparks new insights and team discussions.
Step 4: Create Category Headings
After grouping the items, assign a heading to each cluster. These headings should represent the overarching theme or common thread that links the items in the group. You can think of these as affinity sets or categories that make the diagram easier to interpret.
Step 5: Review and Refine
Take a step back and review the entire affinity diagram. Are there any misplaced items? Do some groups need to be merged or split? Make adjustments to ensure the final diagram accurately reflects the relationships and themes present in the data.
Step 6: Analyze the Results
Once your diagram is finalized, use it to extract insights, identify trends, or guide decision-making. The visual layout helps teams quickly understand key issues, prioritize actions, and align on next steps.
Affinity Diagram Examples
Understanding when to use an affinity diagram becomes easier with practical examples. Below are some real-world affinity diagram examples that illustrate how they can be applied in different contexts.
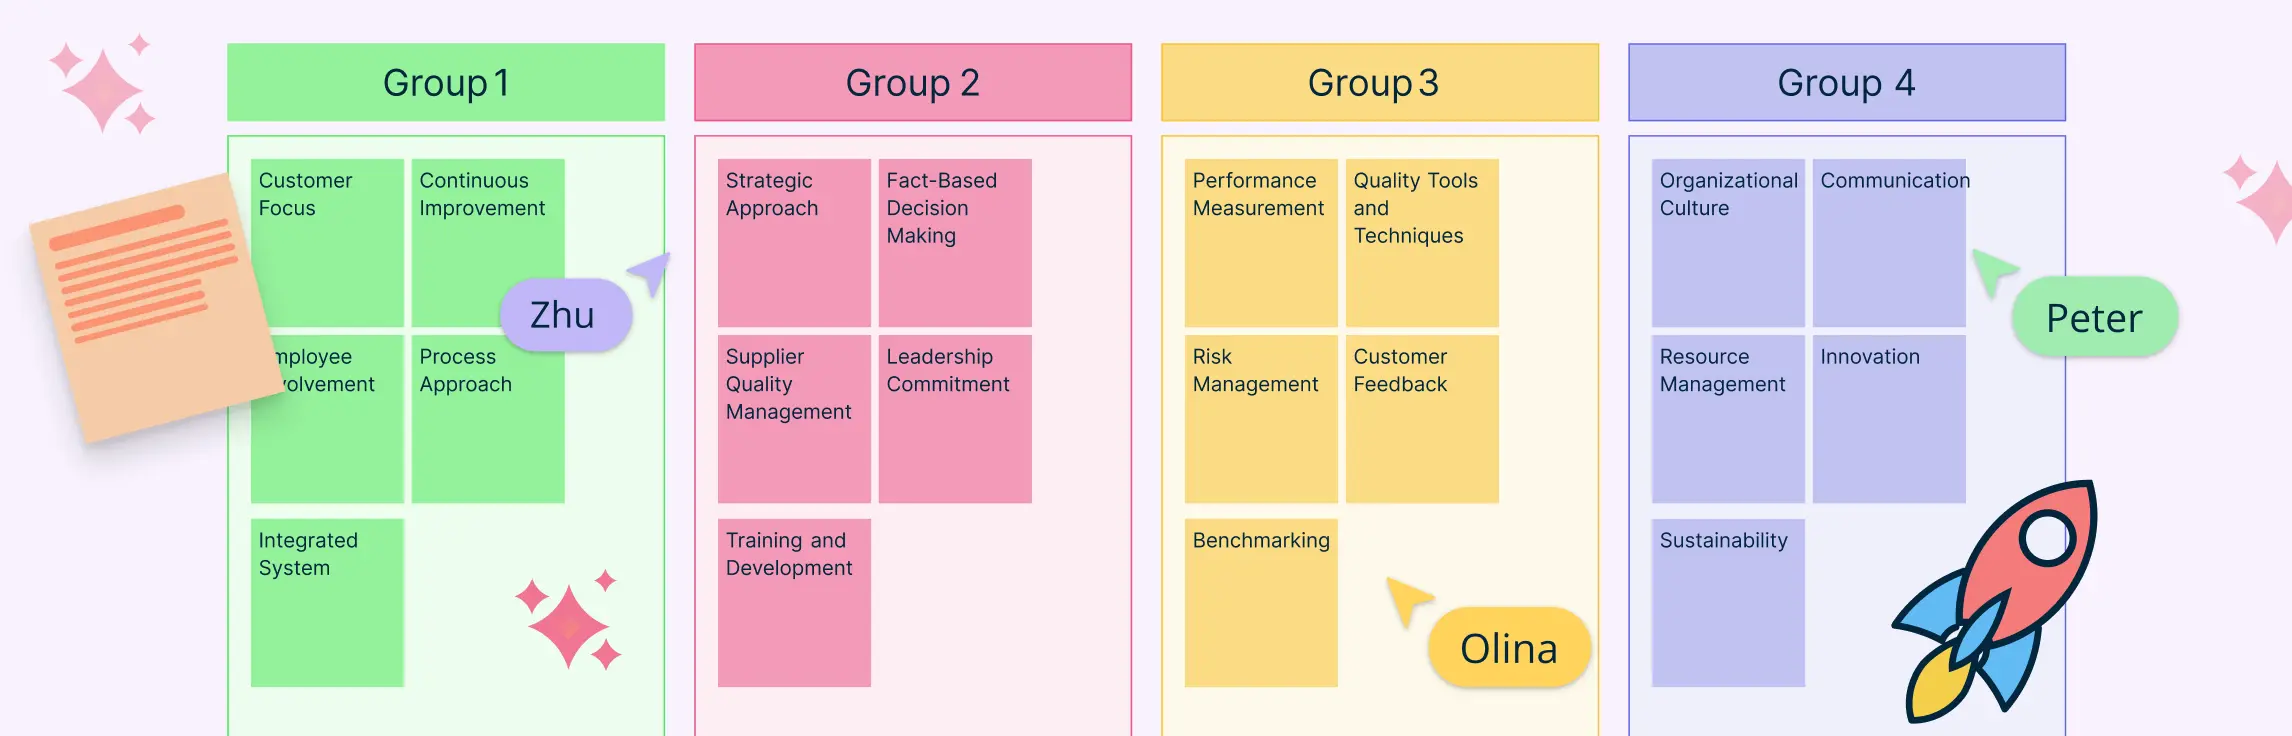
Affinity Diagram Example for Total Quality Management
In Total Quality Management (TQM), affinity diagrams are often used to analyze problems and improve processes. This example shows how affinity diagrams can be used as a quality management tool to identify challenges in management and planning. This specific affinity diagram example explores reasons for substandard customer service. The collected data can be grouped under themes like:
- Inadequate employee training
- Poor communication between departments
- Lack of standardized procedures
Affinity Diagram Example for User Research
UX and product development teams frequently use affinity diagrams to analyze qualitative data from user interviews to understand the customer journey. This affinity diagram example groups insights and findings collected from user interviews. It can group customer feedback information on shopping on an e-commerce retailer for clothing under themes like:
- Benefits of online shopping
- Frustrations with product filters and search
- Concerns about sizing and returns
- Expectations for delivery times
When to Use an Affinity Diagram
But knowing when to use an affinity diagram can help teams make sense of complex information, foster collaboration, and drive better decision-making.
Here are some of the most effective examples of what an affinity diagram is used for:
1. Organizing Complex or Unstructured Data
When you’re overwhelmed with a large volume of ideas, customer feedback, or qualitative research findings, an affinity diagram helps you sort through the noise. By grouping related information it allows you to quickly identify patterns and structure your insights in a logical, easy-to-understand format.
2. Solving Complex Problems with Cross-Functional Teams
Affinity diagrams are ideal for collaborative problem-solving, especially when the challenge is unclear or multi-layered. Bringing together people from different departments or backgrounds encourages diverse thinking and can lead to unexpected, innovative solutions.
3. Enhancing Team Participation and Collaboration
This method promotes equal input from all participants, making it especially valuable in brainstorming sessions and workshops. Because everyone contributes and engages in categorizing the ideas, it often reveals fresh perspectives and uncovers patterns that may not emerge in traditional discussions.
4. Driving Innovation and Idea Generation
If you’re looking for breakthrough ideas or creative strategies, an affinity map can help spark rich discussions. It guides participants to explore connections between thoughts, leading to new angles of thinking and more impactful solutions.
5. Presenting Insights Clearly and Visually
One of the key uses of an affinity diagram is its ability to visually present complex data in a simplified way. Whether you’re sharing results with stakeholders or aligning your team, the clear, thematic structure of an affinity diagram makes your analysis more digestible and persuasive.
Advantages of Affinity Diagrams
Using an affinity diagram offers several powerful benefits that make it an essential tool for teams and individuals tackling complex information or problem-solving tasks. Here are some key advantages of affinity diagrams:
1. Simplifies Complex Data
Affinity diagrams transform large, unstructured sets of ideas or data into organized, manageable groups. This simplification helps teams quickly identify patterns and connections that might otherwise go unnoticed.
2. Enhances Collaboration and Inclusivity
By encouraging participation from people with diverse perspectives and backgrounds, affinity diagrams foster teamwork and ensure that all voices are heard. This inclusive approach often leads to more innovative solutions.
3. Encourages Creative Problem Solving
Grouping ideas visually helps uncover new relationships and insights, inspiring creative thinking and generating effective solutions to difficult problems.
4. Improves Clarity and Focus
Affinity diagrams help teams prioritize issues or ideas by highlighting major themes. This focus supports better decision-making and planning.
5. Facilitates Clear Communication
The visual nature of affinity diagrams makes it easier to present complex findings and insights to stakeholders, helping align teams and gain buy-in for next steps.
5 Tips for Creating Affinity Diagrams
Creating an effective affinity diagram involves more than just grouping sticky notes—it requires clarity, collaboration, and good design. Below are some expert tips to help you get the most out of the process, especially if you’re learning how to make an affinity diagram for brainstorming, planning, or analysis.
1. Set a Clear Objective Before You Begin
Before the brainstorming session starts, define the goals and purpose of your affinity diagram. Having a clear focus ensures that discussions stay on track and that the final affinity map reflects relevant and actionable outcomes. Ask yourself: What are we trying to solve or explore?
2. Involve a Diverse Group of Participants
A key advantage of using an affinity diagram is bringing together different perspectives. Include participants with varied backgrounds, roles, and experiences to capture a broader range of ideas and insights. Diversity fosters innovation and often reveals connections others might miss.
3. Encourage a Judgment-Free Brainstorming Environment
The quality and quantity of ideas improve when people feel safe sharing freely. Promote open, judgment-free brainstorming by allowing everyone ample time to contribute. Avoid critiquing ideas during the session—evaluation comes later, once everything is grouped into the affinity diagram.
4. Use Visual Cues for Clarity
To make your affinity diagram visually effective, use tools like color coding, shapes, or icons to highlight categories and themes. A clean, visually appealing affinity map makes it easier for participants to spot patterns and engage with the information at a glance.
5. Avoid Over-Clustering: Stick to 5–7 Groups
While it’s tempting to create a category for every variation, too many groups can overwhelm the diagram and obscure key themes. Aim for around 5 to 7 meaningful groups—just enough to cover the important ideas without losing clarity.
These tips not only improve the effectiveness of your affinity diagram but also streamline the process of turning raw data into clear, focused insights. If you’re exploring how to make an affinity diagram that drives action and alignment, following these best practices is a great place to start.
Affinity Diagram Templates to Try
How to Use AI to Create an Affinity Diagram
With advancements in artificial intelligence, creating an affinity diagram has become faster and more efficient. AI-powered tools can help you automatically cluster ideas, identify themes, and generate visual maps—saving time and enhancing accuracy in your brainstorming and data analysis sessions.
Creately’s AI analyze your input data—such as notes, survey responses, or research findings—and group related items based on semantic similarity. This reduces manual sorting and allows teams to focus on interpreting insights rather than organizing raw data. Many platforms also offer smart templates and drag-and-drop interfaces that leverage AI to simplify the process, making it accessible even for beginners.
For a ready-to-use AI-powered affinity diagram template, explore the AI Affinity Diagram Template, where you can start mapping ideas quickly with intelligent assistance.
Conclusion: Turn Chaos into Clarity with Affinity Diagrams
As you’ve seen throughout this guide, an affinity diagram is more than just a sticky-note exercise—it’s a structured yet flexible tool that helps teams organize data, encourage collaboration, and generate solutions with confidence. By learning how to create an affinity diagram, recognizing when to use it, and applying the best practices we’ve shared, you’ll be able to lead more focused discussions, drive innovation, and communicate insights clearly.
Don’t forget to explore Creately and the free affinity diagram templates included in this guide to save time and start organizing your ideas today.
FAQ on Affinity Diagrams
What are the benefits of an affinity diagram?
Affinity diagrams are used to generate, organize, and consolidate information related to a product, process, or problem. And they have multiple benefits for teams across industries. Affinity diagrams,
- Help teams, collaboratively analyze research findings.
- Help make better sense of qualitative research data by grouping similar information.
- Give everyone the opportunity to contribute and share their ideas, hence allowing to incorporate everyone’s perspectives in decision-making.
- Help generate innovative ideas and effective solutions to problems by discovering important patterns and trends in data.
What is affinity mapping?
How do you use an affinity diagram?
How to use affinity diagrams in UX design?
Can we draw affinity diagrams using AI?
Resources:
Lucero, A. (2015). Using Affinity Diagrams to Evaluate Interactive Prototypes. Human-Computer Interaction – INTERACT 2015, 9297, pp.231–248. doi:https://doi.org/10.1007/978-3-319-22668-2_19.
Widjaja, W. and Takahashi, M. (2016). Distributed interface for group affinity-diagram brainstorming. Concurrent Engineering, 24(4), pp.344–358. doi:https://doi.org/10.1177/1063293x16657860.