Object Diagram Definition
A UML Object Diagram is a structural diagram that shows a snapshot of objects, their attributes, and relationships at a specific point in time. It represents how instances of classes interact in a real situation, reflecting the system’s state during execution. While class diagrams define the blueprint of a system, object diagrams display the actual data and connections between objects, making them useful for understanding, validating, and illustrating how a system behaves at runtime.
Key Elements of an Object Diagram in UML
Objects
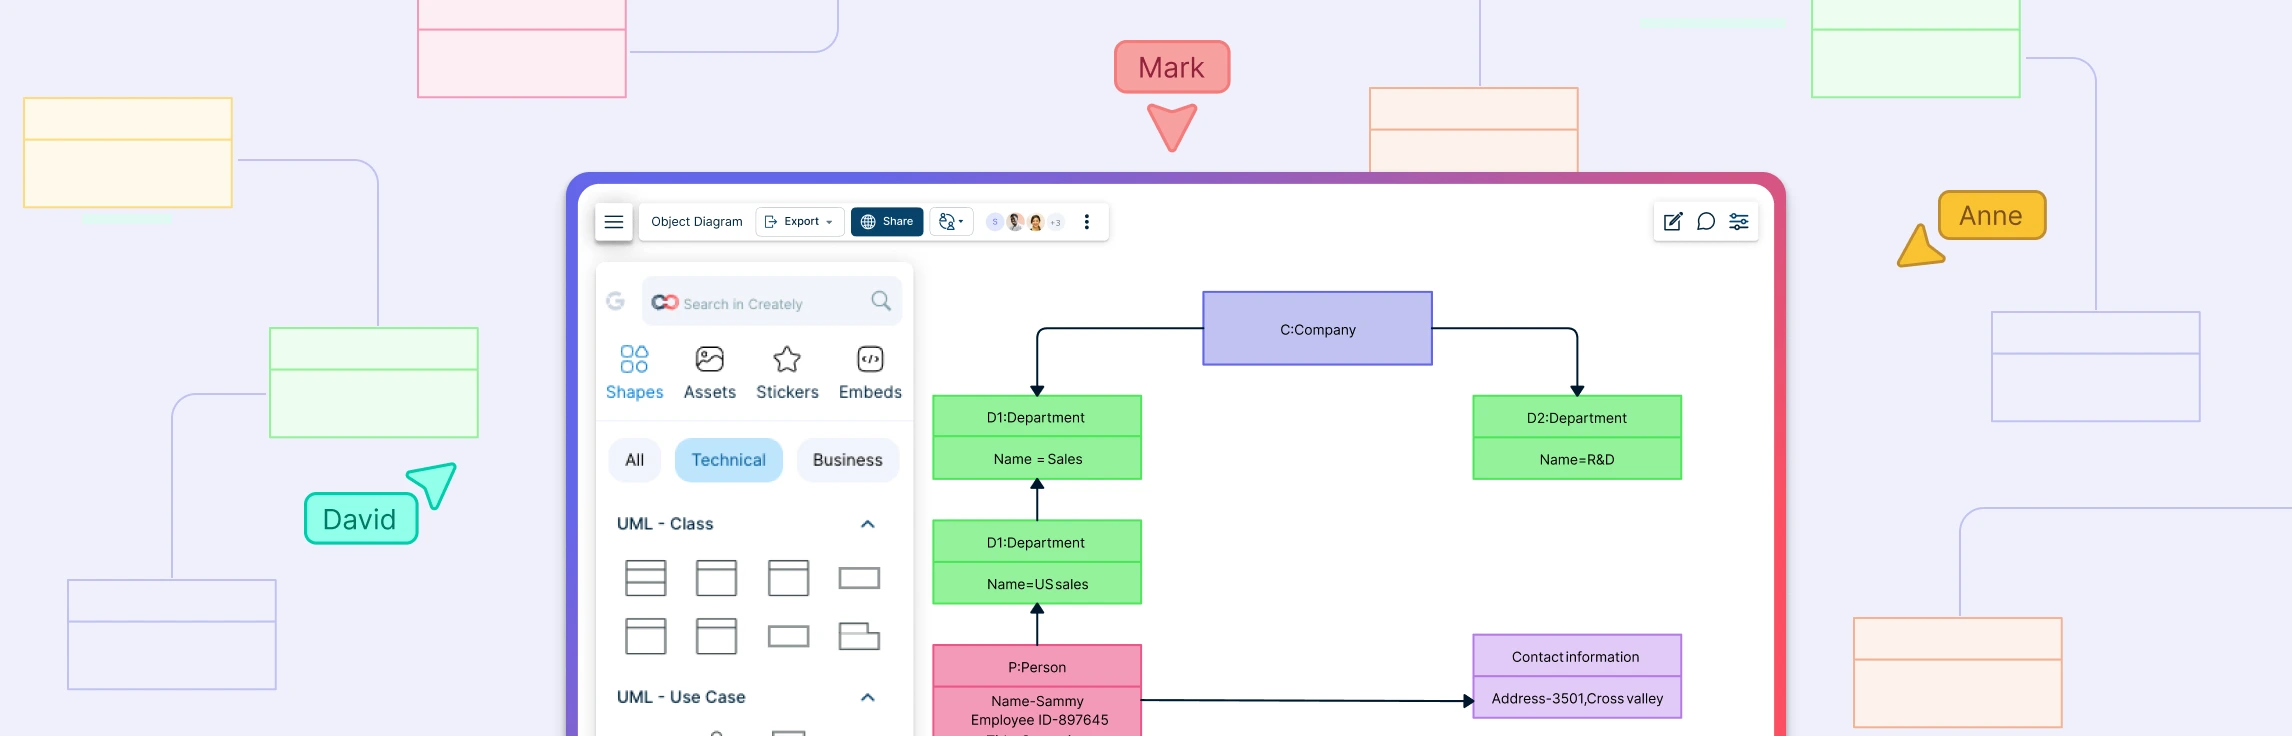
Objects are the core elements of an object diagram and represent specific instances of classes that exist in the system at a particular moment. Each object typically has a name and an associated class, formatted as objectName:ClassName (e.g., order1:Order or customerA:Customer). Objects can stand alone or be connected through links that show relationships. In diagrams, the object’s name is often underlined to indicate it’s an instance rather than a class definition.
Attributes and Values
Attributes define the current state of an object, showing specific values assigned to its properties at runtime. These give the object diagram its “snapshot” quality.
For example, the attributes for customer1:Customer can be,
- name = “Alice”
- email = “alice@email.com”
- membership = “Gold”
By visualizing these details, you can see how the system behaves under actual conditions, identify default values, and check for missing or incorrect data mappings.
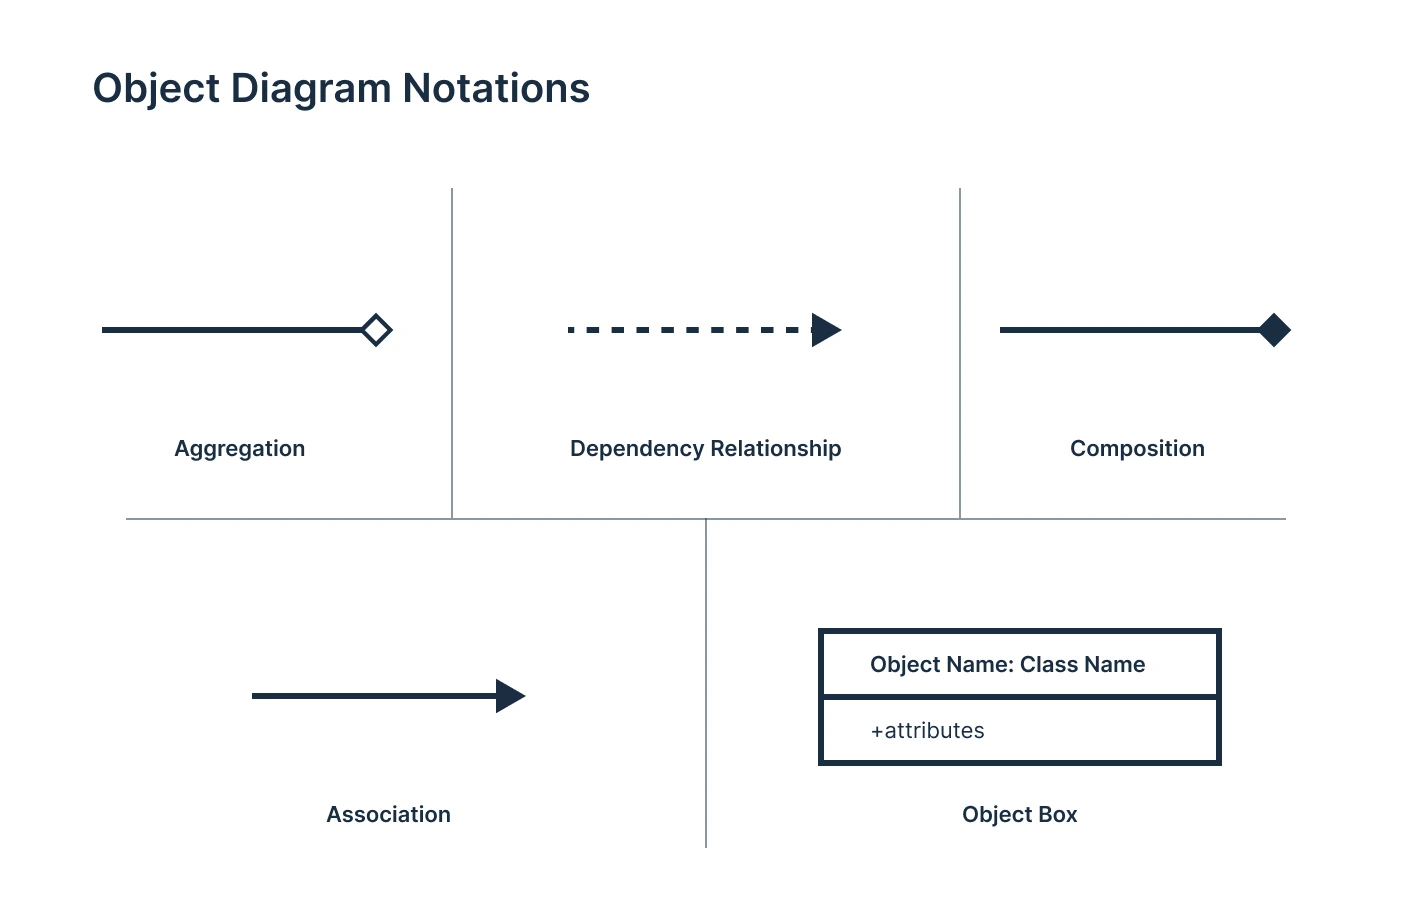
Links (Relationships)
Links represent connections between objects that correspond to associations defined in the class diagram. They show how individual instances interact. Links help model real-time relationships, such as ownership, composition, or dependency. They are drawn as solid lines and can also include direction or role names to clarify the relationship type.
- Association: A basic link showing that objects are connected or interact (e.g.,
Customer↔Order). - Aggregation: A “whole–part” relationship where parts can exist independently (e.g.,
Team→Player). - Composition: A strong “whole–part” relationship where parts depend on the whole (e.g.,
Car→Engine). - Dependency: One object relies on another to perform an action (e.g.,
Invoice→Payment).
Multiplicity and Roles
Multiplicity specifies how many objects participate in a relationship, such as one-to-one, one-to-many, or many-to-many. Roles describe the part each object plays in that relationship. These details make the diagram more expressive and clarify cardinalities between instances, mirroring the relationships modeled in the class diagram.
For instance, a customer may place multiple orders, but each order belongs to exactly one customer — shown as 1..* and 1.
Purpose of an Object Diagram
Visualize System State: Shows how objects and their relationships exist at a specific moment during program execution, providing a snapshot of the system in action.
Simulate System Behavior: Depict how a system’s structure changes over time by showing object configurations before, during, and after certain operations or transactions.
Clarify Class Behavior: Helps understand how instances of classes interact and behave based on the structure defined in the class diagram.
Validate Class Design: Verify that class relationships, attributes, and associations work correctly when applied to real-world instances.
Simplify Complex Systems: Turn abstract class structures into tangible examples, making it easier to comprehend how different parts of the system connect and exchange information.
Explore Object Lifecycles: Demonstrate how objects are created, modified, or destroyed within the system, helping designers understand lifecycle management and dependencies.
Validate Requirements and Business Rules: Help confirm that system behavior aligns with specified business requirements by visually modeling real instances that reflect expected outcomes.
Assist in Debugging and Testing: Reveals incorrect values, missing links, or unintended dependencies between objects, supporting error detection during testing and development.
Support Documentation and Communication: Serve as a clear visual aid for explaining system behavior to stakeholders, developers, and learners. This bridges the gap between technical and non-technical understanding.
Benefits of Object Diagrams
Bridges design and implementation: Shows how class structures translate into real-world object instances, helping validate design accuracy before coding.
Simplifies complex systems: Provides a clear, visual view of how multiple objects interact, making large or abstract systems easier to understand.
Improves team communication: Offers a shared visual language for developers, analysts, and stakeholders to discuss functionality and relationships effectively.
Enables early error detection: Reveals missing links, redundant connections, or design inconsistencies early in development, reducing rework later.
Supports documentation and knowledge sharing: Captures the state of a system at a specific moment, creating valuable visual references for maintenance, onboarding, or reviews.
Aids in testing and debugging: Helps model real runtime states, making it easier to trace logic issues or verify expected object interactions.
Strengthens model-driven development: Acts as a bridge between abstract class models and executable designs, promoting a smoother flow from analysis to implementation.
Where Object Diagrams are Used
Database and Schema Design
Object diagrams can represent sample records and relationships between database entities, showing how tables and keys relate in real-world scenarios. This helps database designers verify data structure, relationships, and constraints before physical implementation, ensuring consistency between logical models and actual data instances.
Prototyping and Early Design Reviews
An object diagram in software engineering serves as a lightweight prototype to visualize how components of a proposed system interact. In early development stages, object diagrams help teams test assumptions, validate data structures, and communicate design intent before coding complex class models.
Reverse Engineering and System Understanding
In existing or legacy systems, object diagrams can be generated from code or databases to reveal runtime object configurations and dependencies. This helps engineers understand the current system state, trace interactions, and identify refactoring opportunities without needing to comb through the entire codebase.
Integration and API Modeling
Object diagrams are useful in multi-system or API-driven architectures, showing how data objects from different systems communicate. By visualizing these object exchanges, teams can design secure, efficient integration points between internal modules and external APIs or services.
Modeling Example Data Sets
They can be used to illustrate sample data and object relationships, providing snapshots of realistic runtime information. This is particularly useful in documentation, testing, or teaching, where concrete examples make abstract designs more understandable.
System Migration and Upgrade Planning
When planning migrations or version upgrades, object diagrams help teams compare current and target system states. They highlight how relationships and data mappings change across systems, allowing smoother transitions and reducing the risk of data loss or misalignment.
Explaining Use Case Scenarios
They are ideal for illustrating object interactions within specific workflows, such as a customer placing an order or a user completing a registration form. These diagrams show how data moves between objects during an operation, helping business analysts and developers align system design with real user flows.
Teaching and Knowledge Transfer
In education and onboarding, object diagrams make UML concepts easier to understand by demonstrating live examples of objects, links, and attribute values. They bridge the gap between theory and practice, helping new learners and team members quickly grasp system structure and behavior.
Free Object Diagram Templates to Get Started


FAQs about Object Diagrams
What are some limitations of object diagrams?
Can an object diagram include objects from multiple subsystems?
What is the difference between a Class Diagram and an Object Diagram?
Can I create a Class Diagram from an Object Diagram in UML?
Resources
M. Torchiano. Empirical Assessment of UML Static Object Diagrams. 13 Nov. 2004, https://doi.org/10.1109/wpc.2004.1311064.
Maoz, Shahar, et al. “Modal Object Diagrams.” Lecture Notes in Computer Science, 2011, pp. 281–305, https://doi.org/10.1007/978-3-642-22655-7_14.