Circular Flow Diagram Maker
Draw Economic Dynamics with Circular Flow Diagrams
Bring in data from any source to create a circular flow diagram to trace interconnections between various elements of an economy.
Multiple templates to visualize the circular flow model
Real-time collaboration to connect with multiple participants
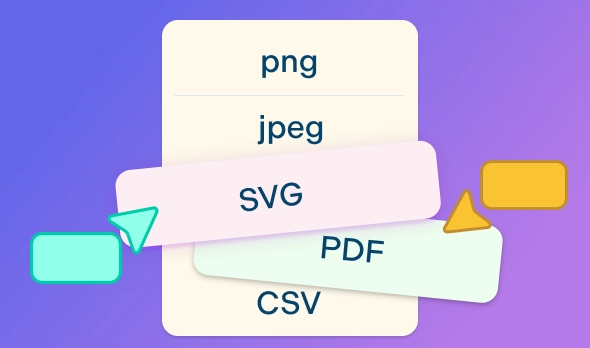
Export in SVG, PNG, JPEG, or PDF formats


 Diagramming Visual Collaboration Org Chart


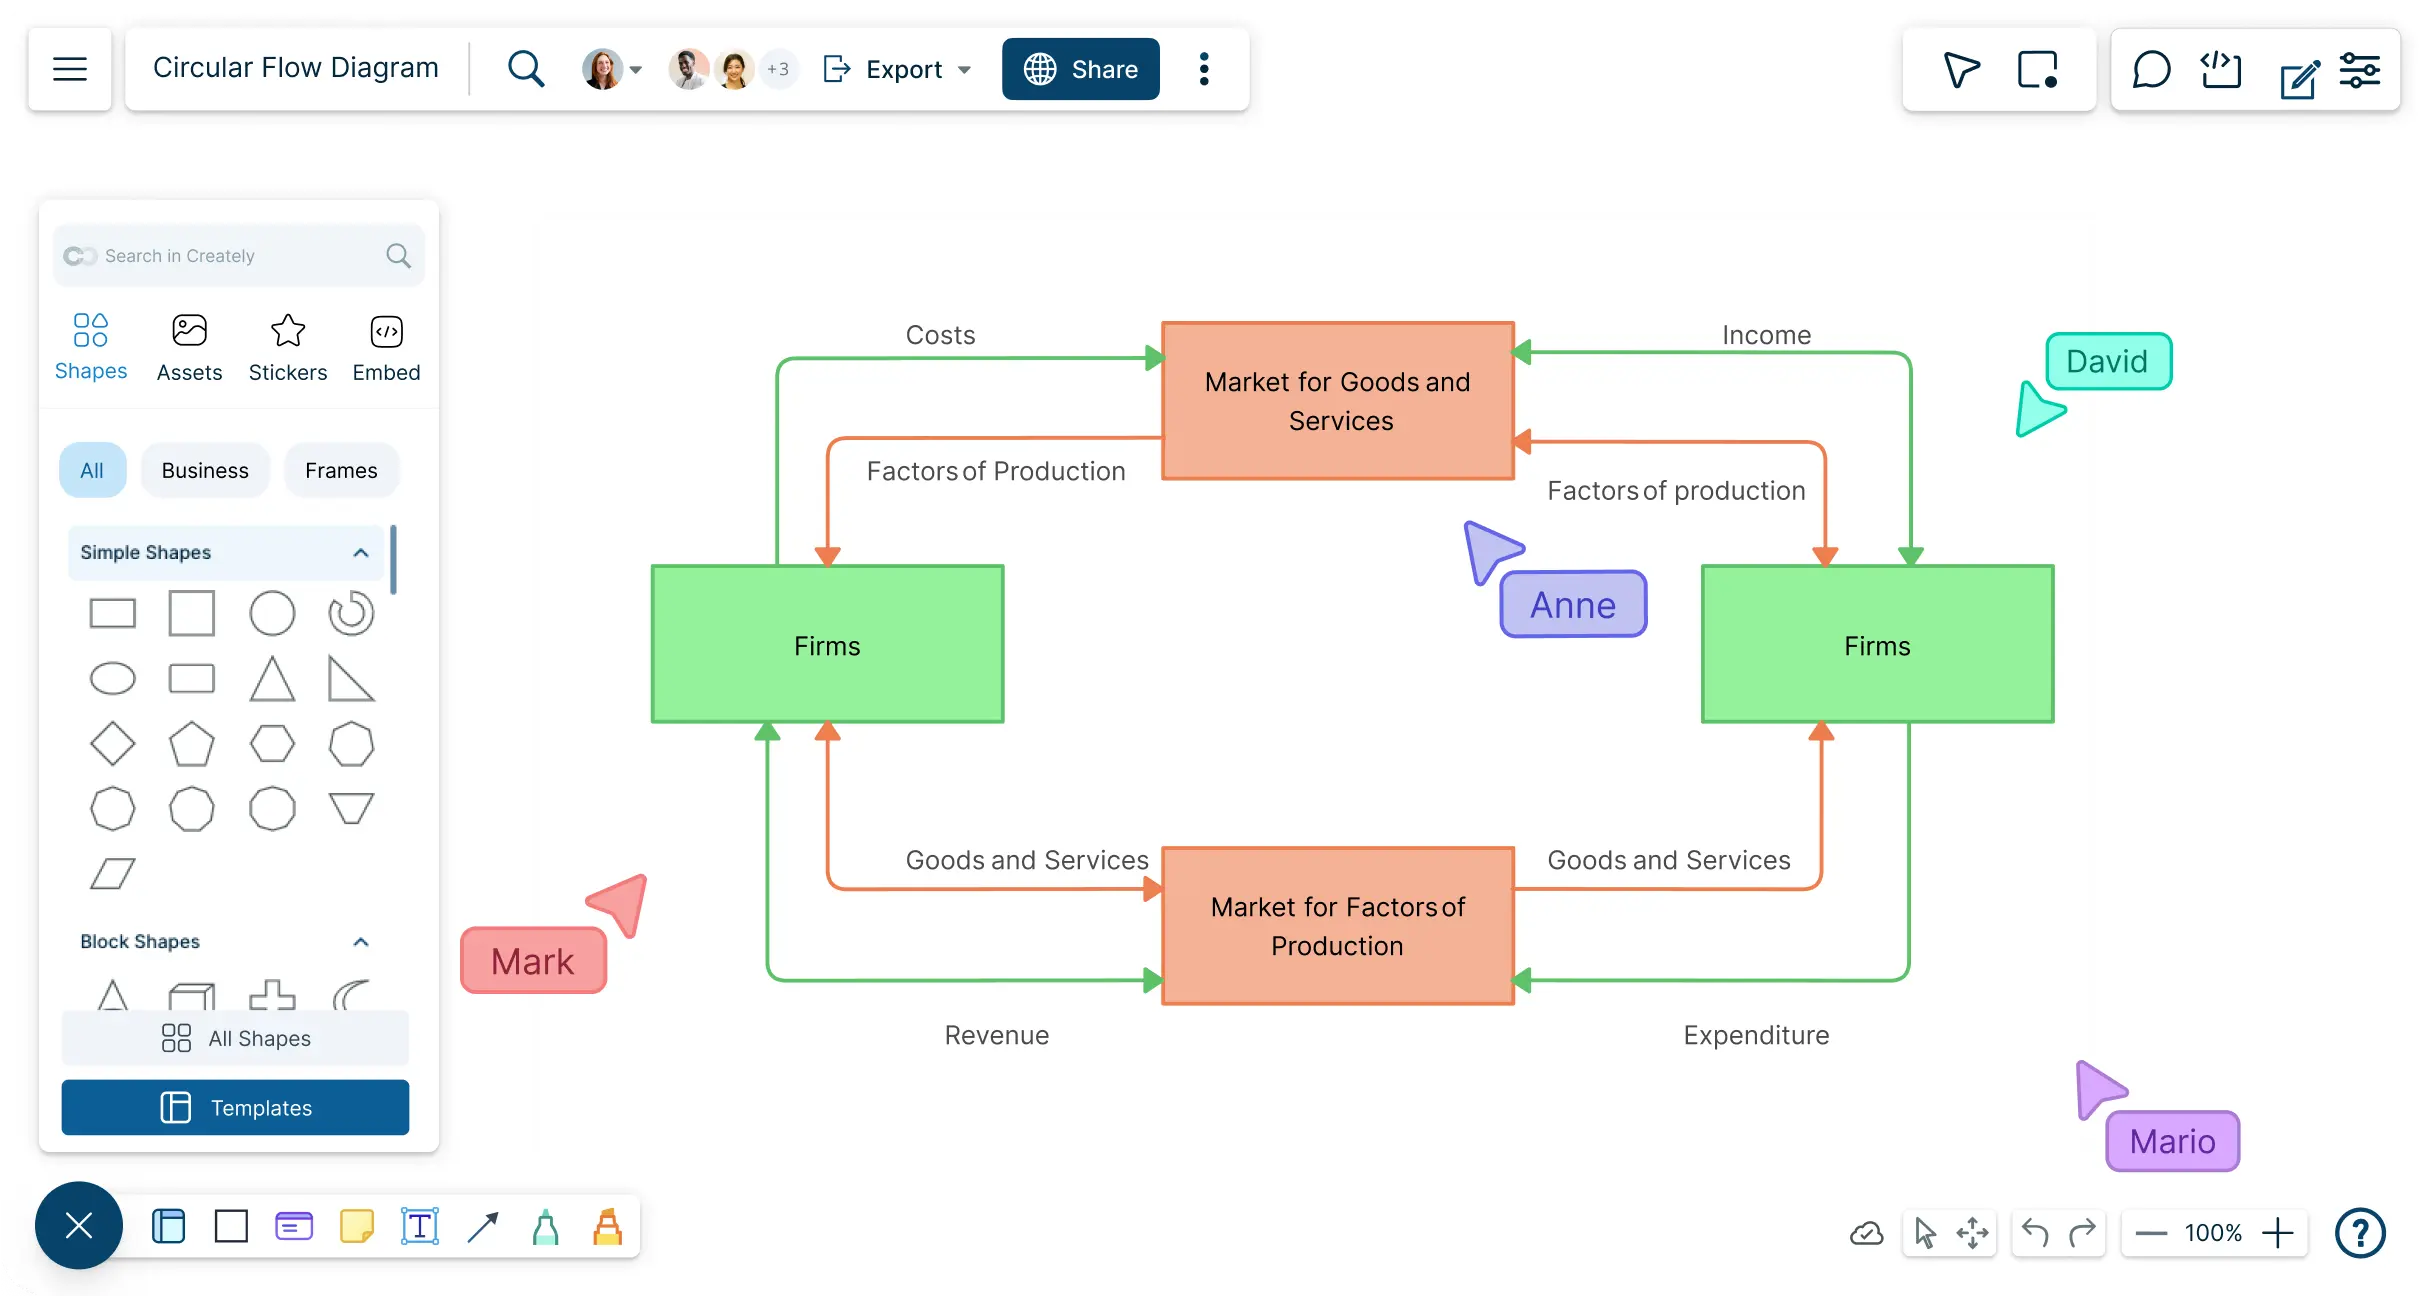
Accurately Visualize Your Circular Flow Model

Professional templates to quickly get started with the circular flow model.
Advanced styling and color options to color-code and customize.
Draw anything you want based on your business and household relationships.
Dynamic connectors to trace the interconnections in the economy.

Work Together on Your Economic Models – Anywhere, Anytime
Workspace, folder, team, and organizational levels to customize and collaborate.
Centralize feedback with in-context comments, @mentions, discussions, and action items directly on your diagram.
Collaborate live or async with real-time cursors and instant updates.
Collaborate live or async with real-time cursors and instant updates.
Share securely via link or embed, with role-based permissions for full control.
Keep Your Circular Flowcharts and Data in One Organized Space

Folder structures to help organize diagrams in folders and provide access as required.
Track every change with full version history; name versions by date, meeting, or collaborator.
Import data with ease from CSV, Excel, or spreadsheets and visualize them as tables, grids, timelines, and more.
Extend to include additional contextual information with data fields and custom properties.
Attach supporting resources such as documents, links, and multimedia directly to your diagram for quick reference.
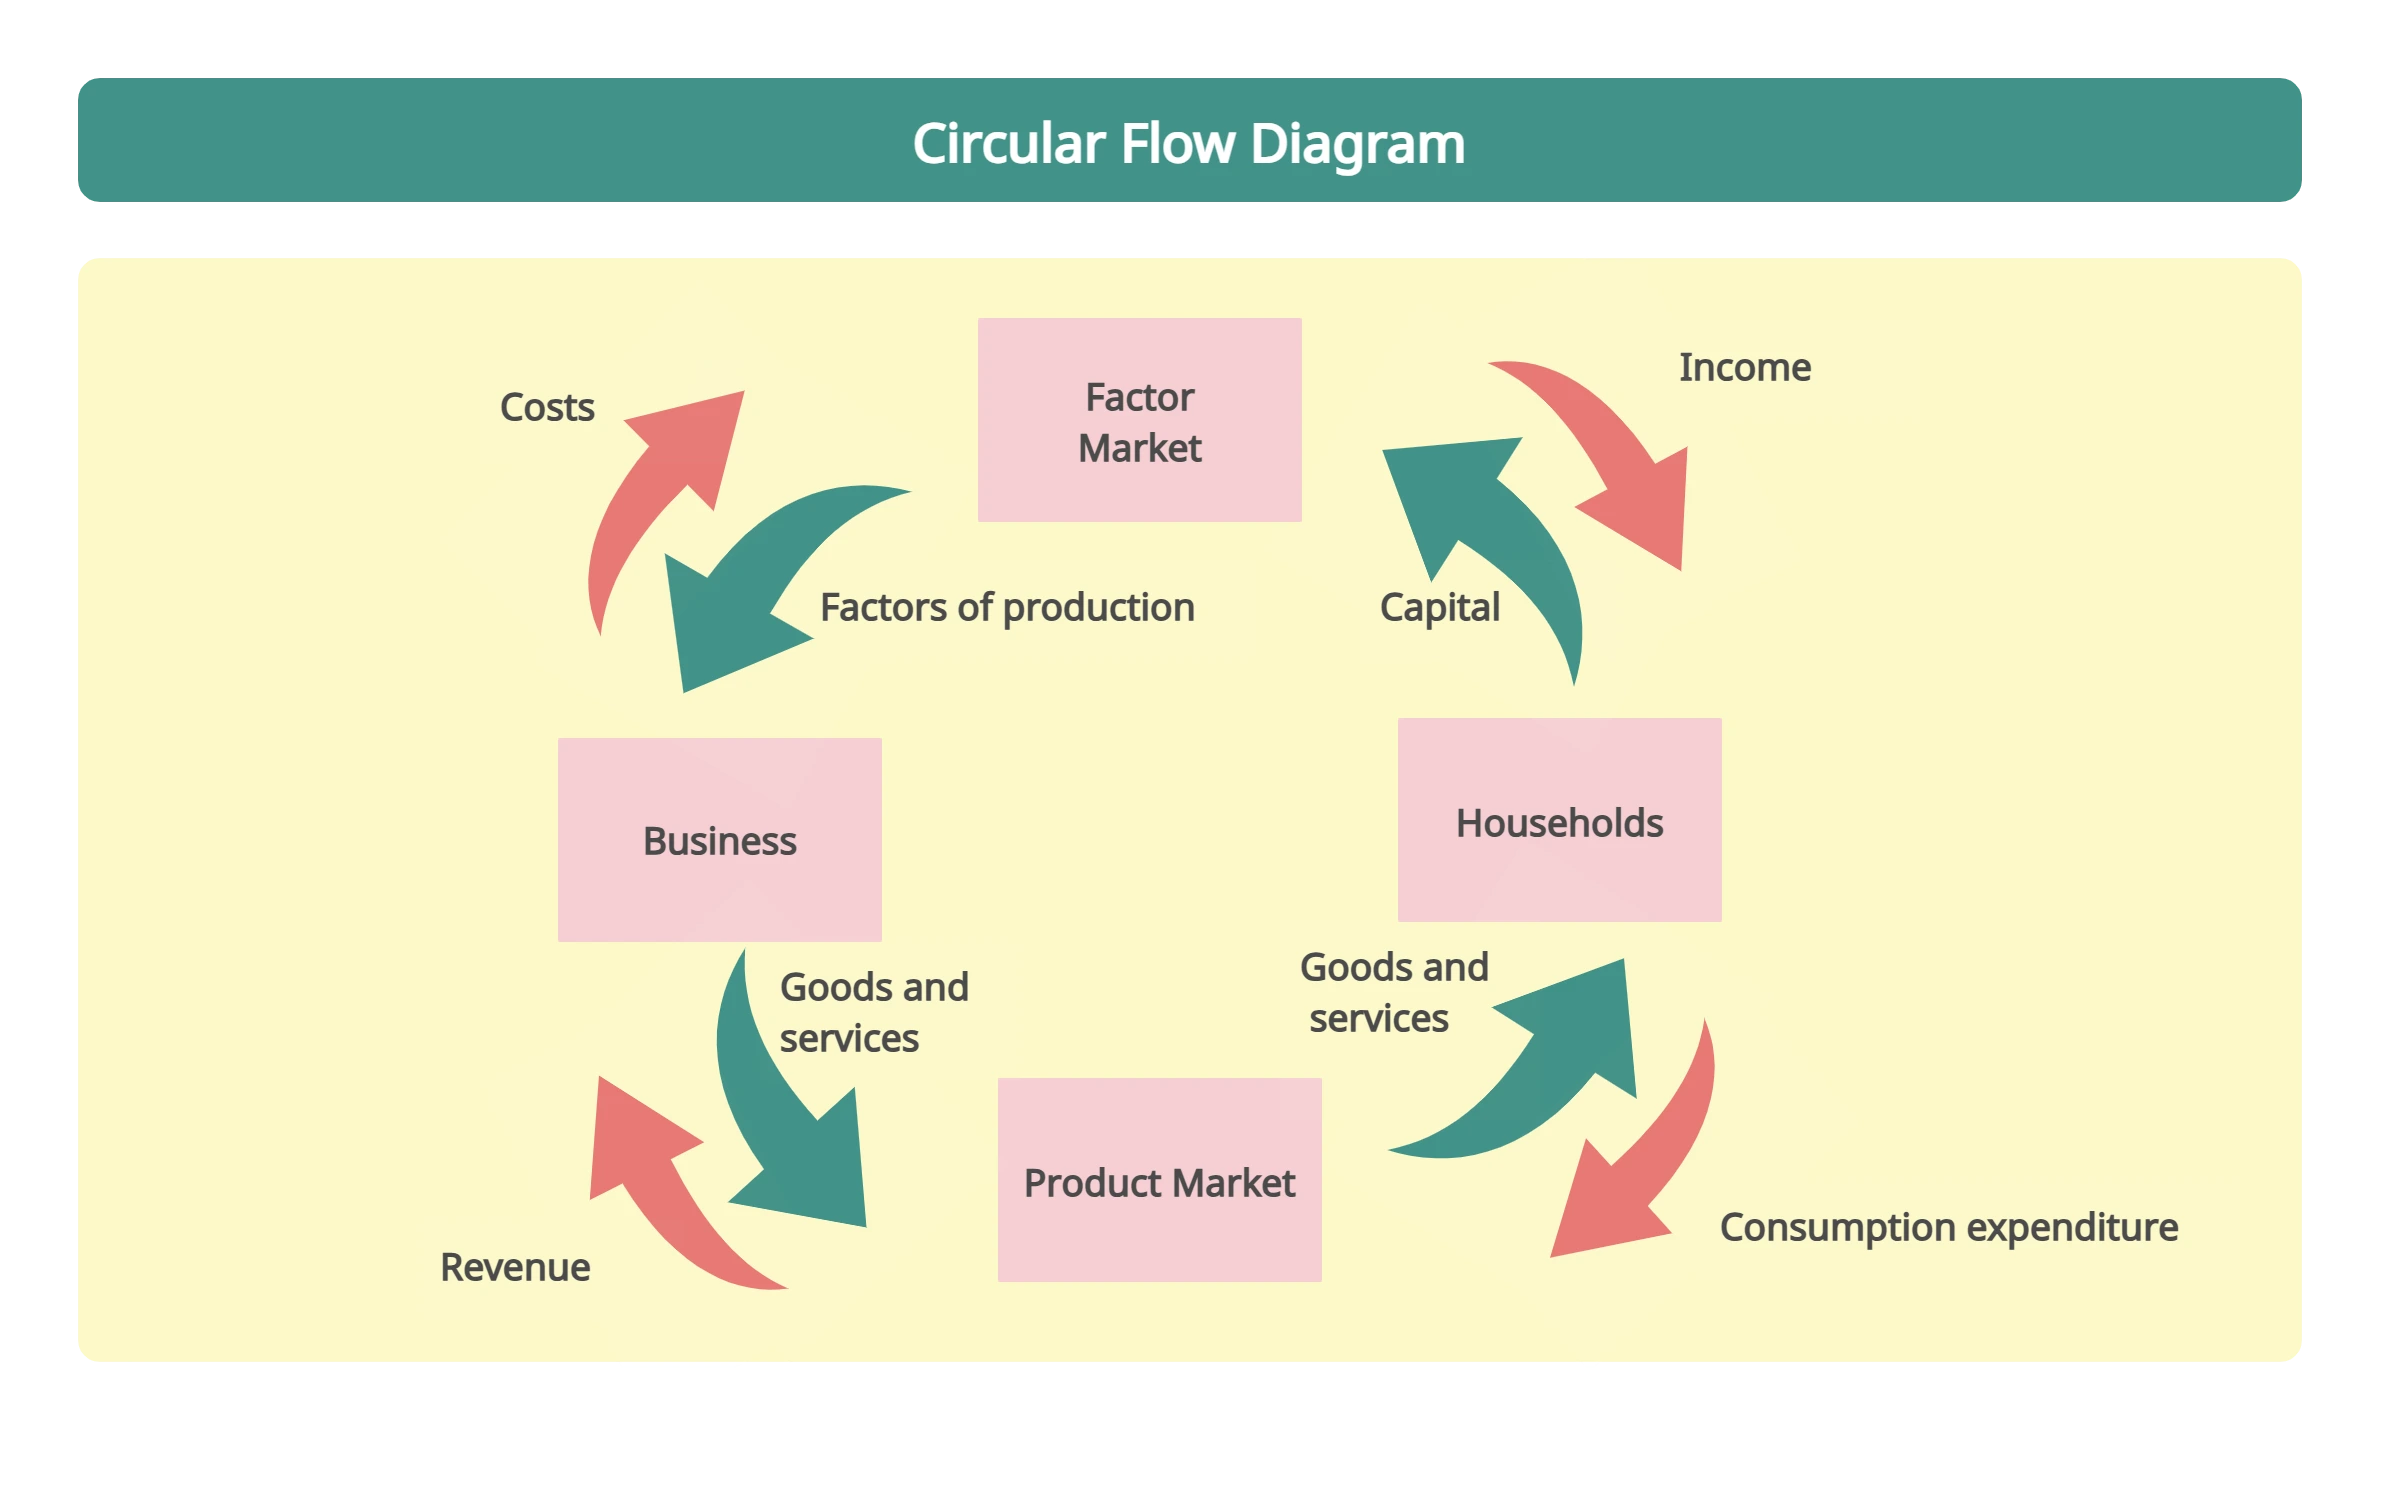
What Is a Circular Flow Diagram?

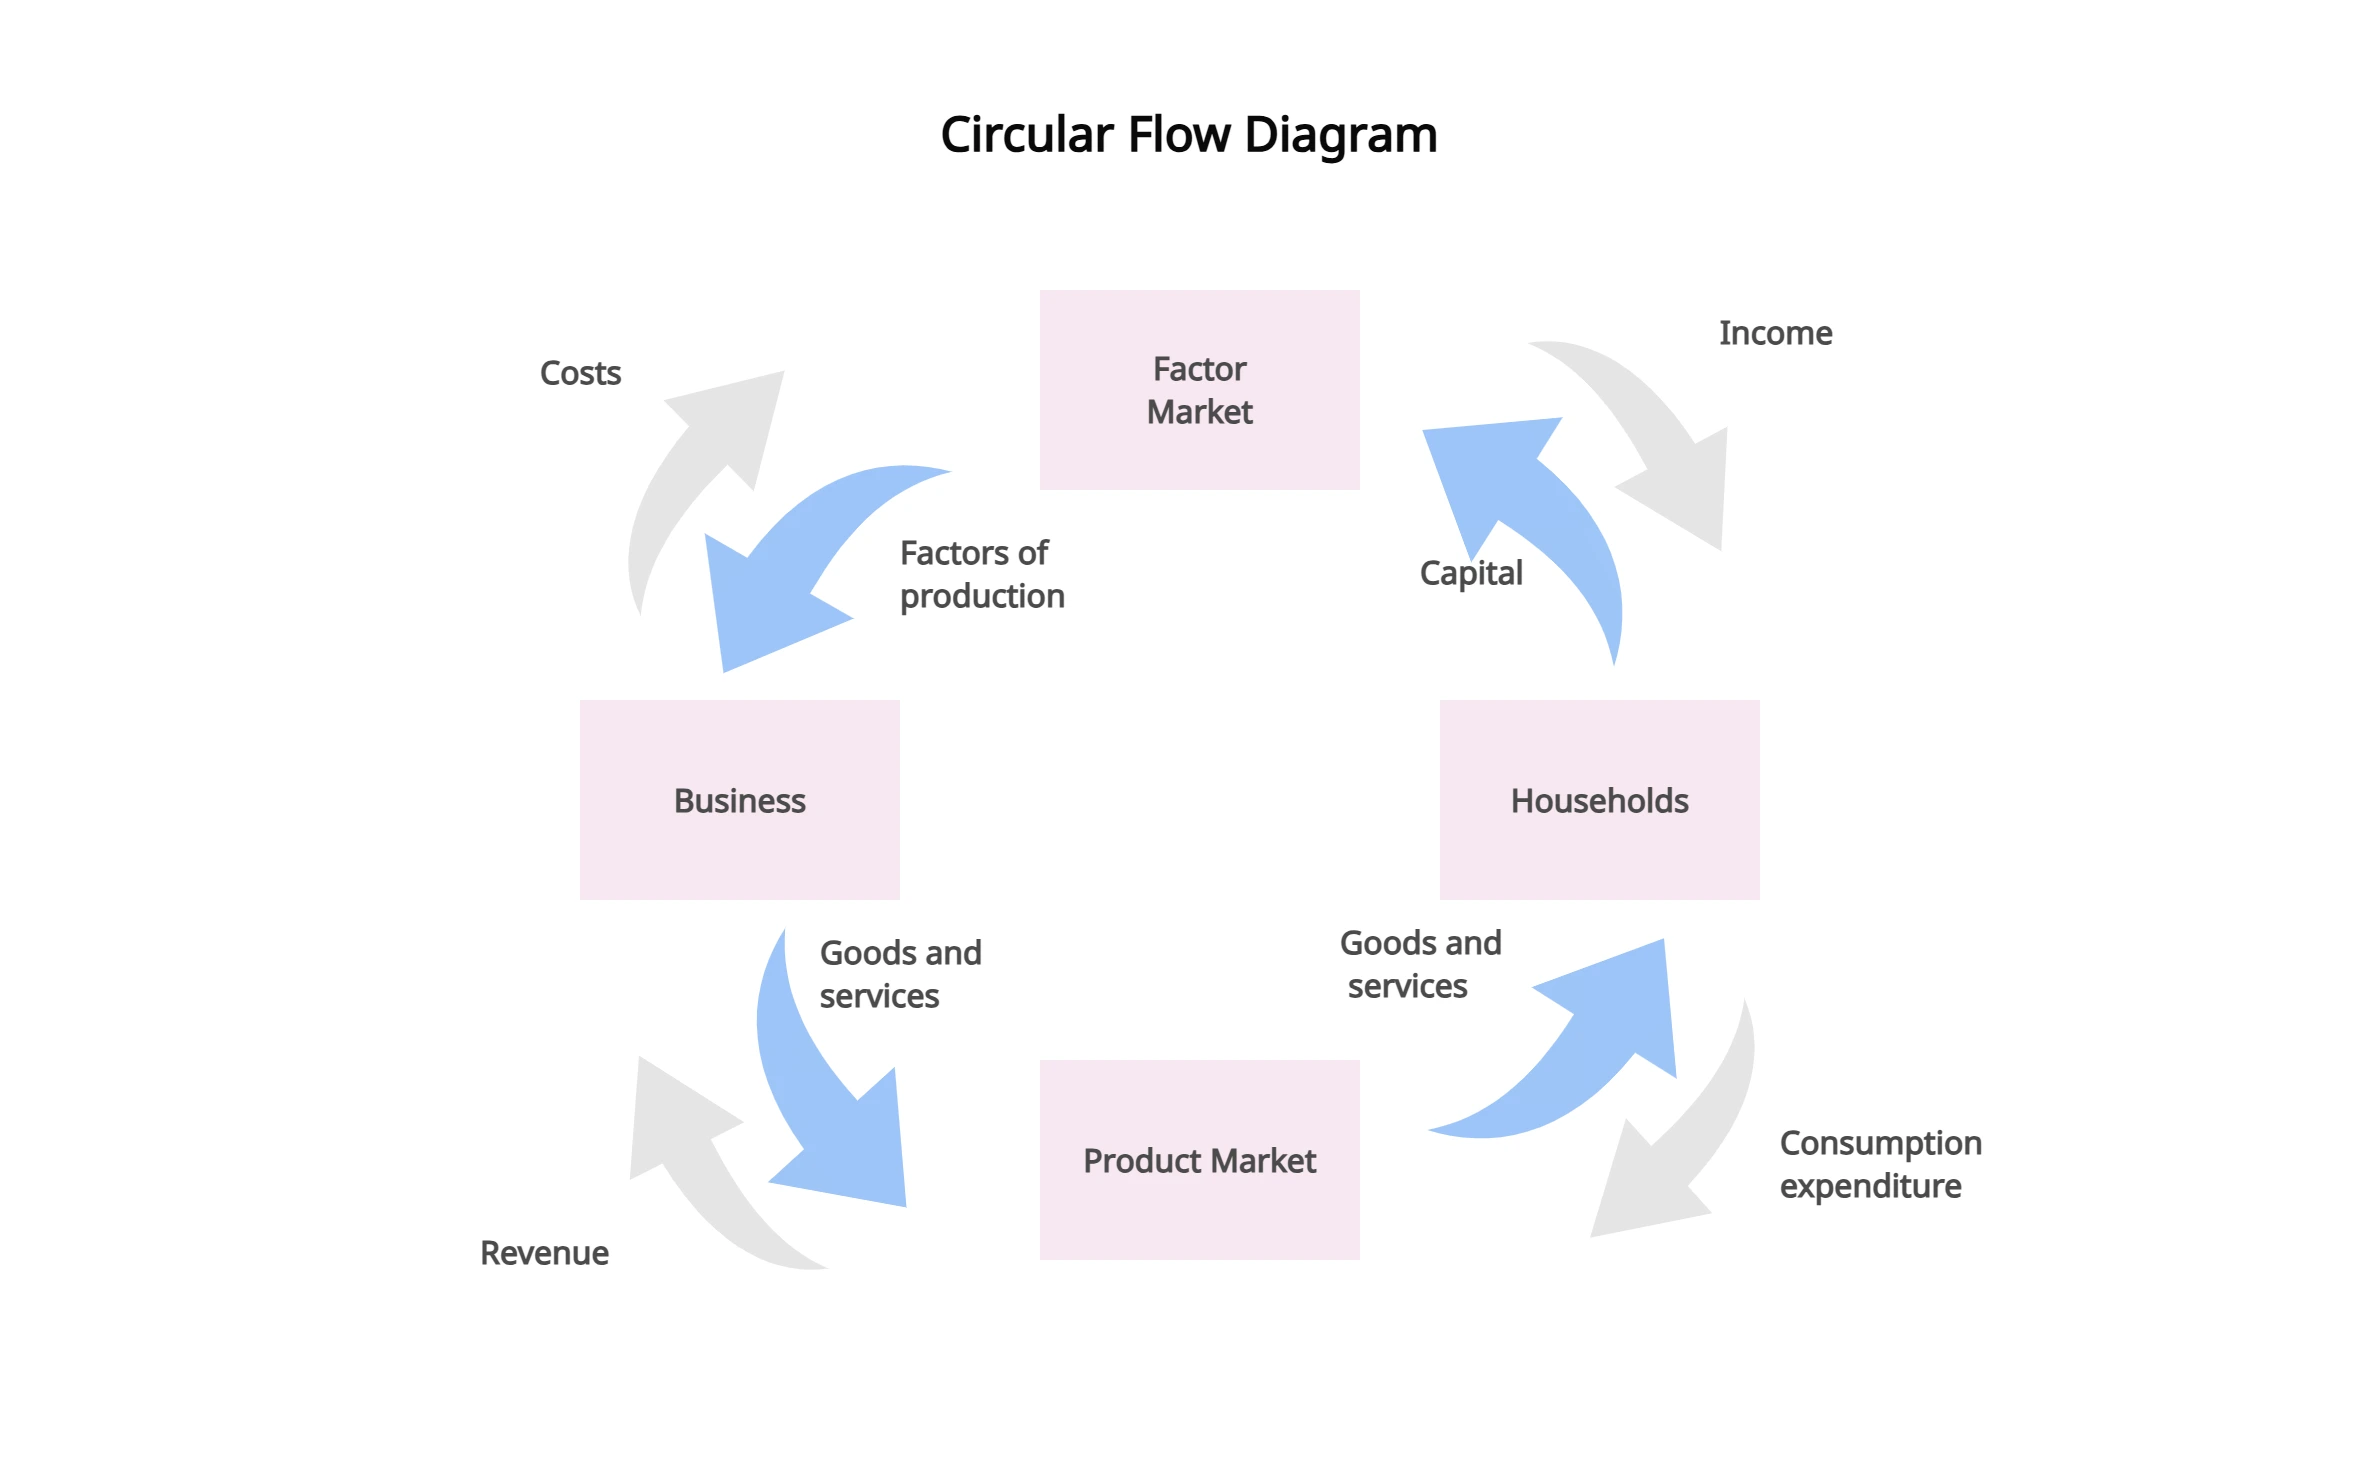
Circular flow diagram, also known as the circular flow of income, is an economic model in which the major exchanges are represented as flows of money, goods, and services. This model helps you determine the condition of the economy for maintaining stability.
A fundamental concept of macroeconomics, the main takeaway or lesson of the circular flow diagram is that it suggests that the economy can reproduce itself.
How to Make a Circular Flow Diagram?
Launch Creately
Sign in to your Creately account and open a new workspace. This is your collaborative canvas where you can create, edit, and share circular flow diagrams online.
Add a Circular Flow Diagram Template
Choose from a wide range of circular flow diagram templates to kickstart your model instantly. Templates give you a professional starting point that you can adapt for businesses, households, governments, or any sector.
Customize and Organize Your Diagram
Style your circular flow diagram with preset color themes, shapes, and icons. Use sticky notes and the notes panel to capture insights, add context, or highlight important details for your team.
Attach Data and Resources
Bring in data from CSV or Excel files, and extend your diagram with custom properties. Attach supporting documents, links, and multimedia so your diagram becomes a complete hub of information.
Review, Collaborate, and Share
Work with your team in real time using live cursors, contextual comments, and discussion threads. Share securely with role-based permissions or export your circular flow diagram as PNG, PDF, or SVG for presentations.
Create a Circular Flow DiagramExplore Circular Flow Diagram Templates to Simplify Complex Economic Flows
FAQs About the Circular Flow Diagram Software
What is the importance of a circular flow diagram?
A circular flow diagram helps visualize how money, goods, and services move through an economy. Its key uses include:
- Measuring national income: Shows components used in calculating GDP.
- Analyzing injections and leakages: Highlights when total injections equal leakages, keeping the economy balanced.
- Understanding interdependence: Demonstrates interactions between households, businesses, government, and other sectors.
- Visualizing continuous economic activity: Illustrates the ongoing cycles of money, goods, and resources.
What are the key sectors of a circular flow diagram?
Circular flow diagrams can model different levels of the economy:
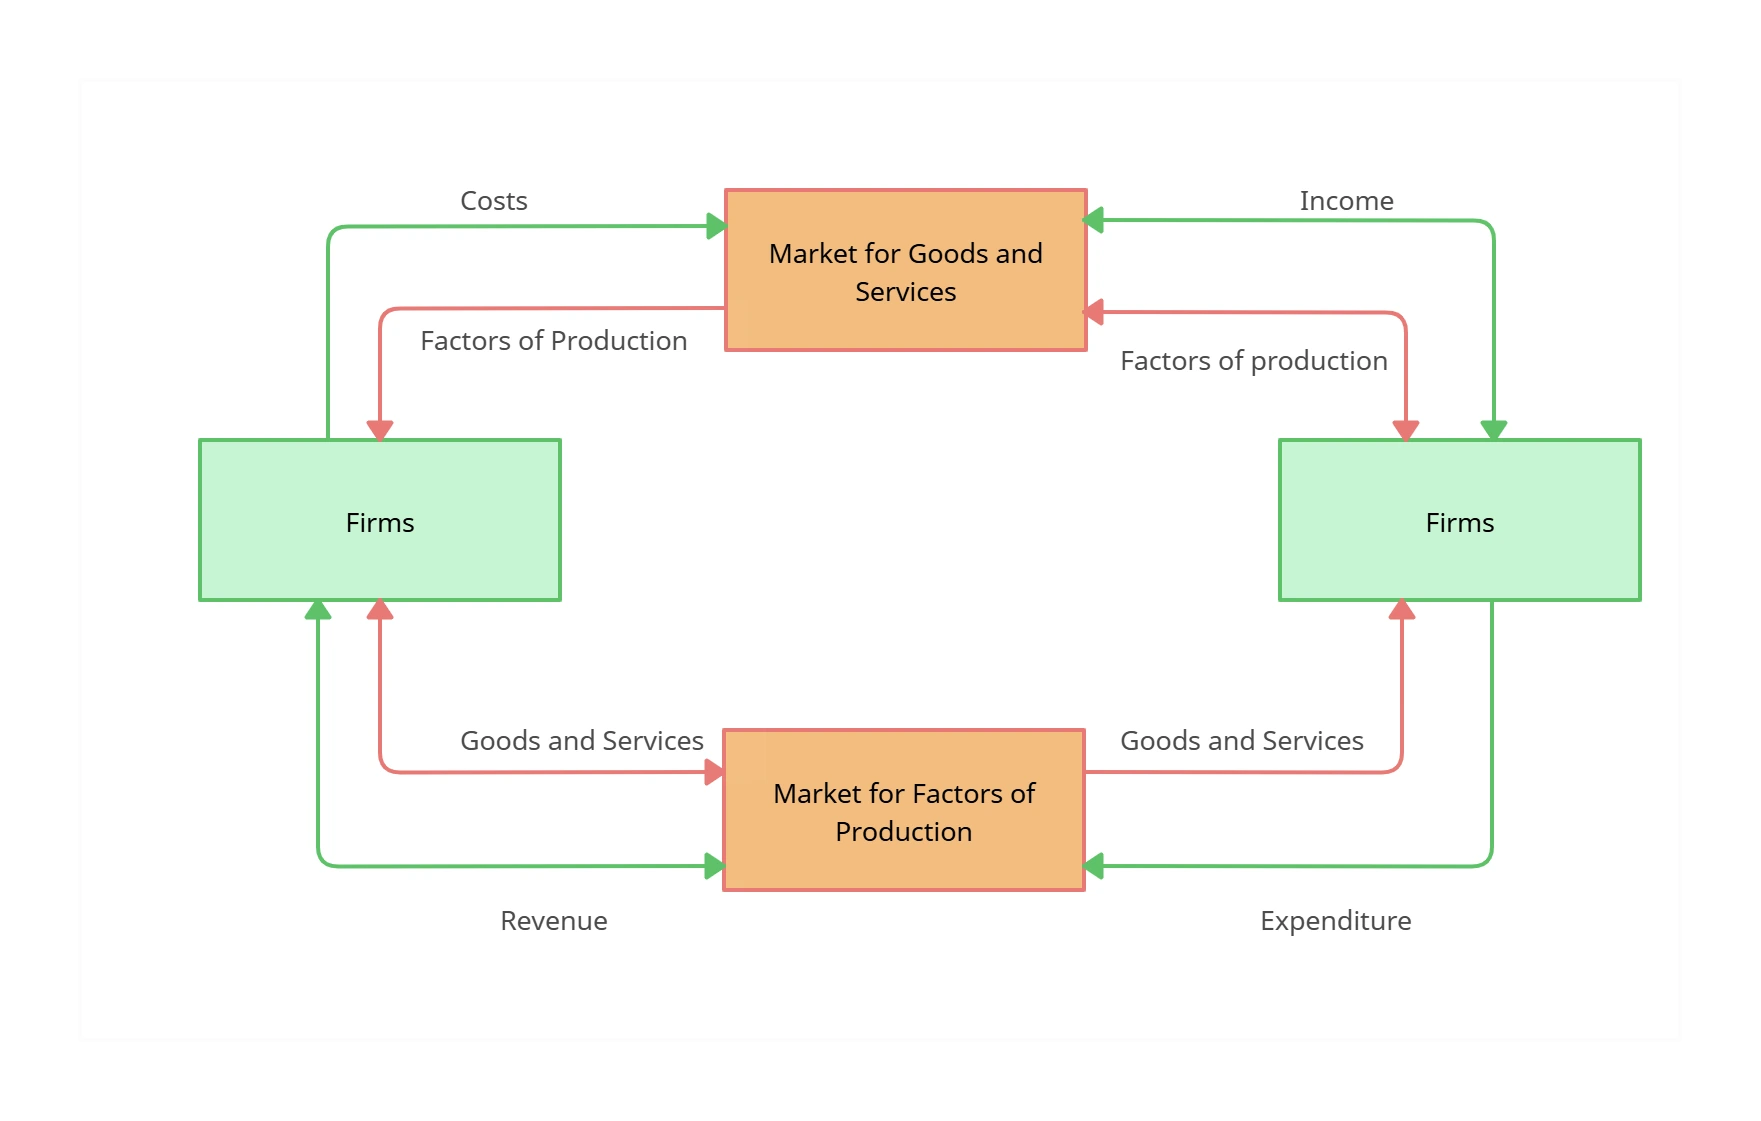
- Two-sector model: Basic model with households and businesses.
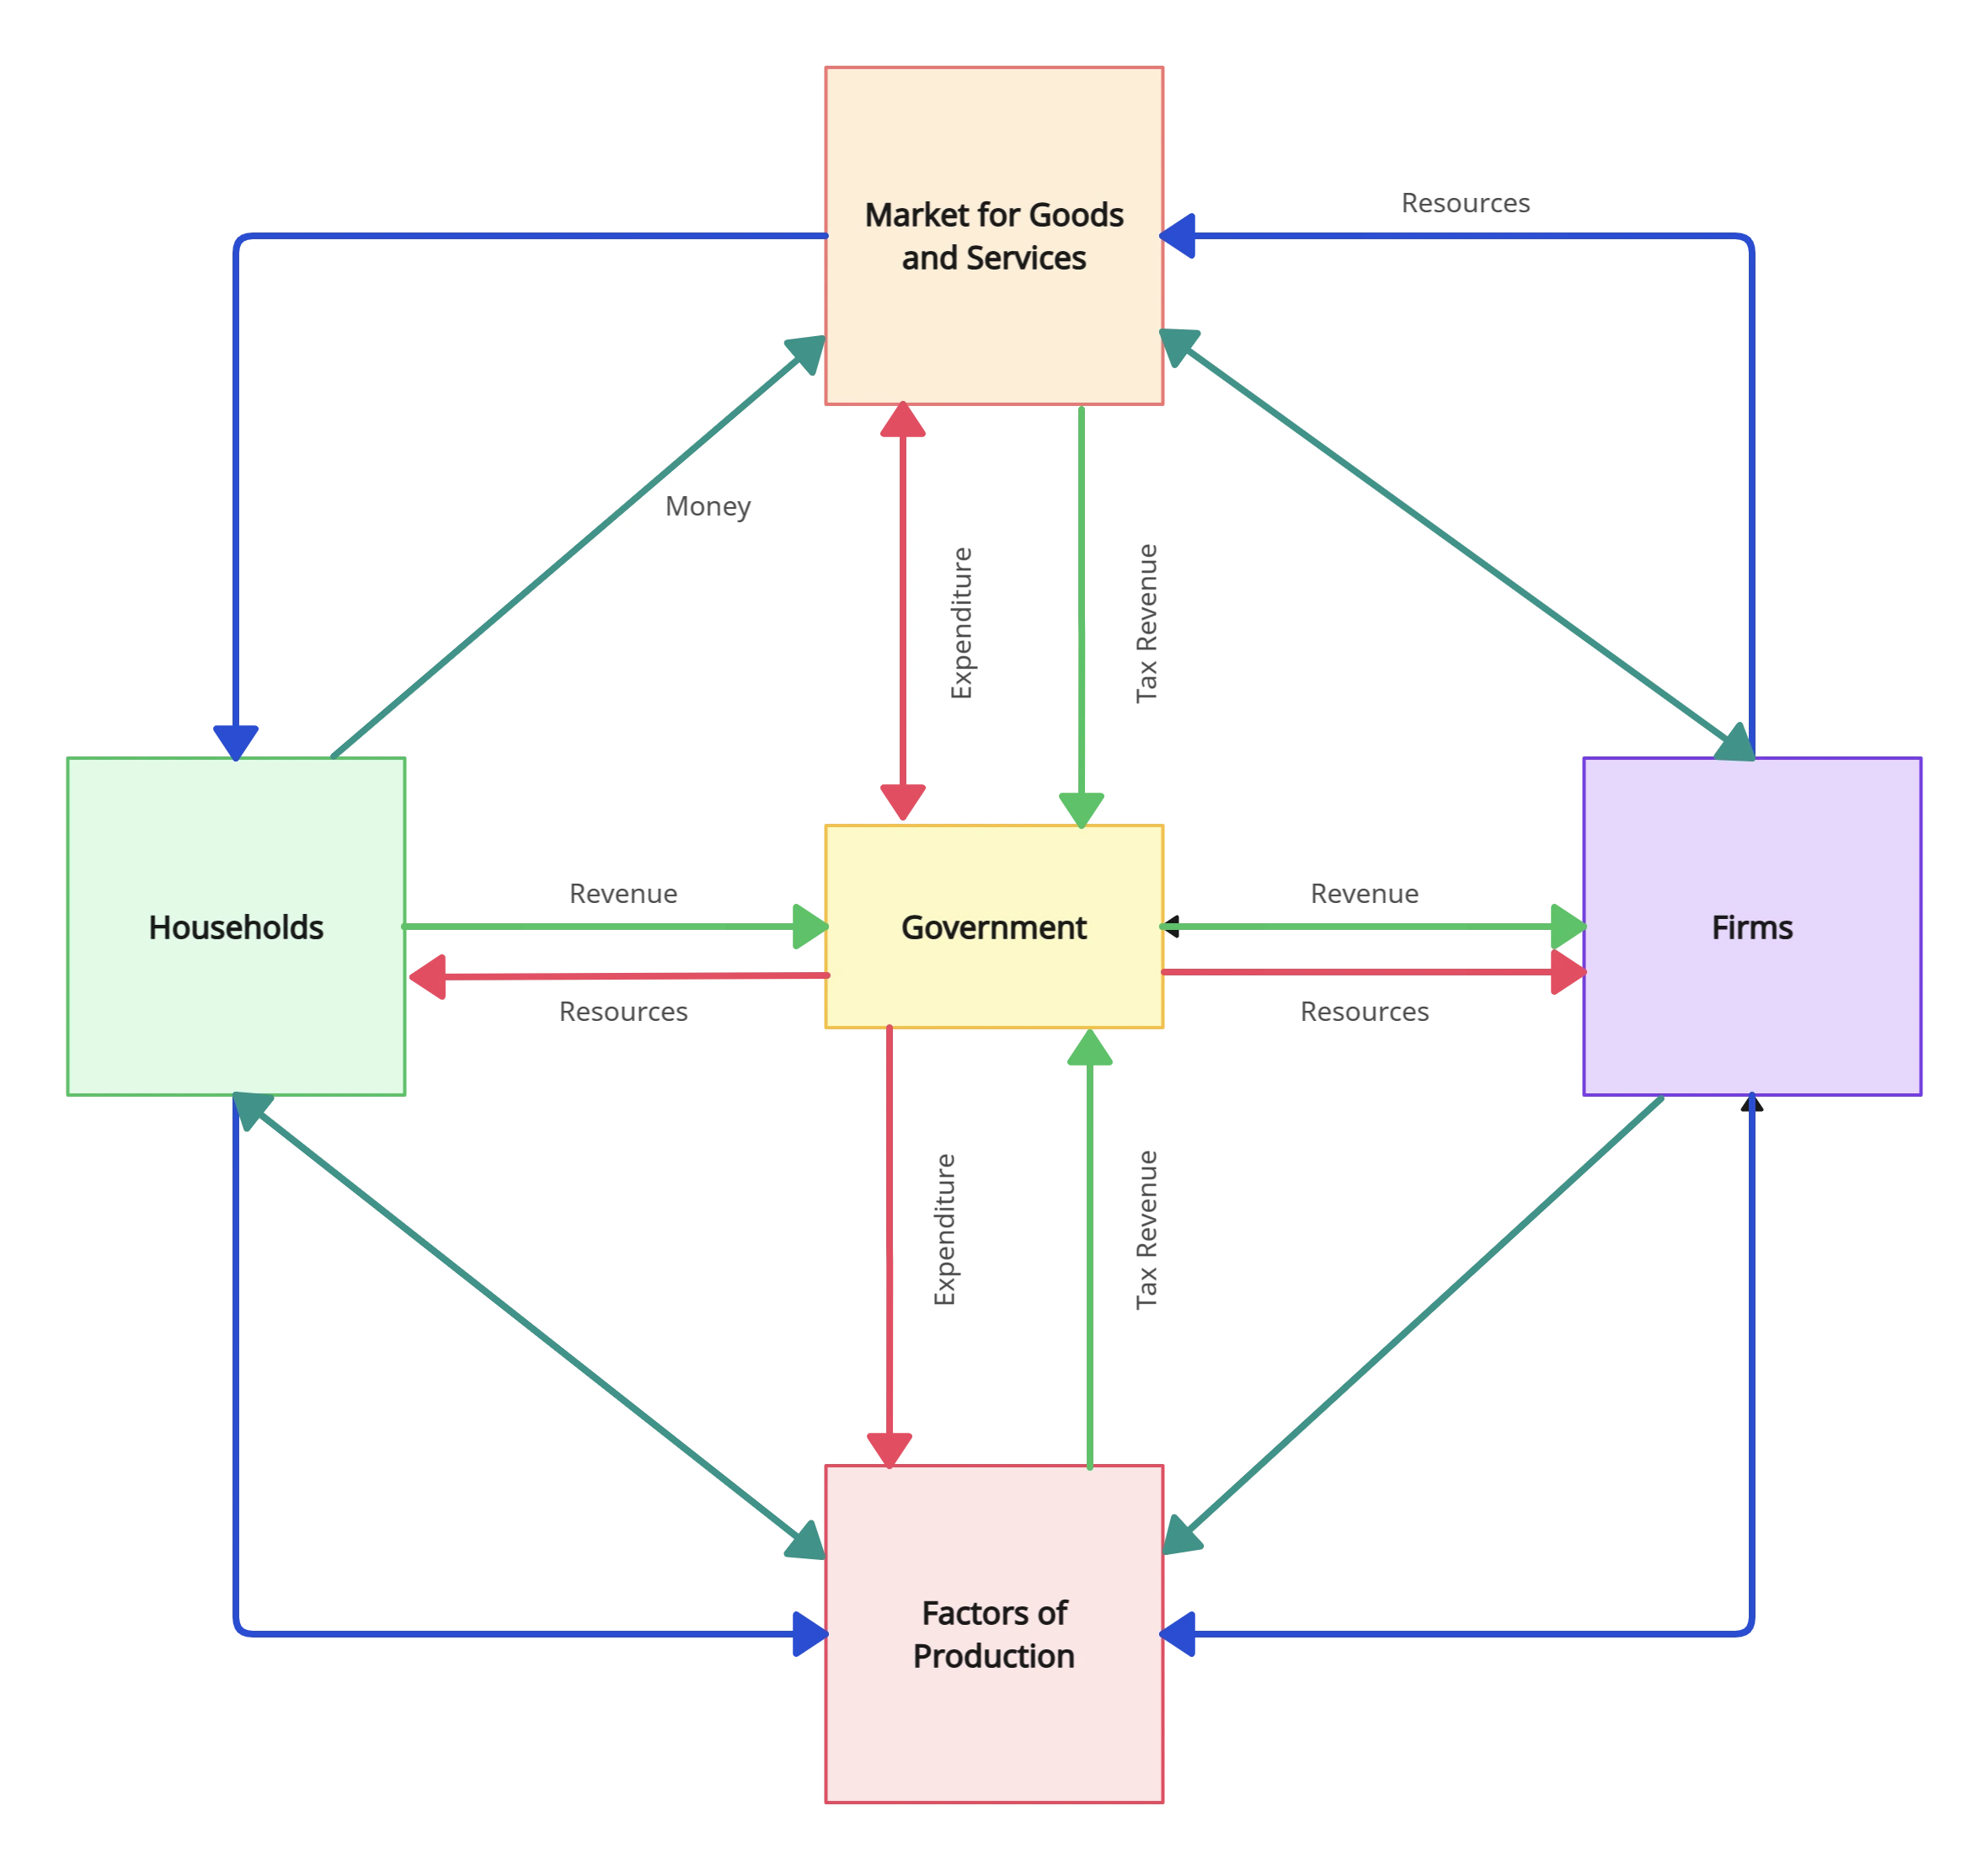
- Three-sector model: Adds the government to the two-sector model.
- Four-sector model: Includes the foreign/external sector, creating an open economy.
- Five-sector model: Incorporates the financial sector, such as banks and institutions.
What are the main objectives of a circular flow diagram?
The diagram illustrates how spending by one group drives production and revenue for others. It shows:
- How the economy operates as a whole.
- How changes in one sector affect others.
- The effects of government policies, consumer behavior, and business cycle shifts.
Can I customize colors and shapes in a circular flow diagram?
Yes! With Creately’s circular flow diagram creator, you can:
- Use an extensive shape library and annotations.
- Apply color themes, styles, and text editing.
- Import images or use the built-in Google search for additional visuals.
How can I share my circular flow diagram with others?
You can collaborate and share easily:
- Invite team members via email or link in the workspace.
- Export diagrams as SVG, PNG, or PDF for offline sharing.
- Use the notes panel or attach documents, links, and multimedia to provide full context.
Can I import data into a circular flow diagram?
Is it possible to collaborate on circular flow diagrams in real-time?