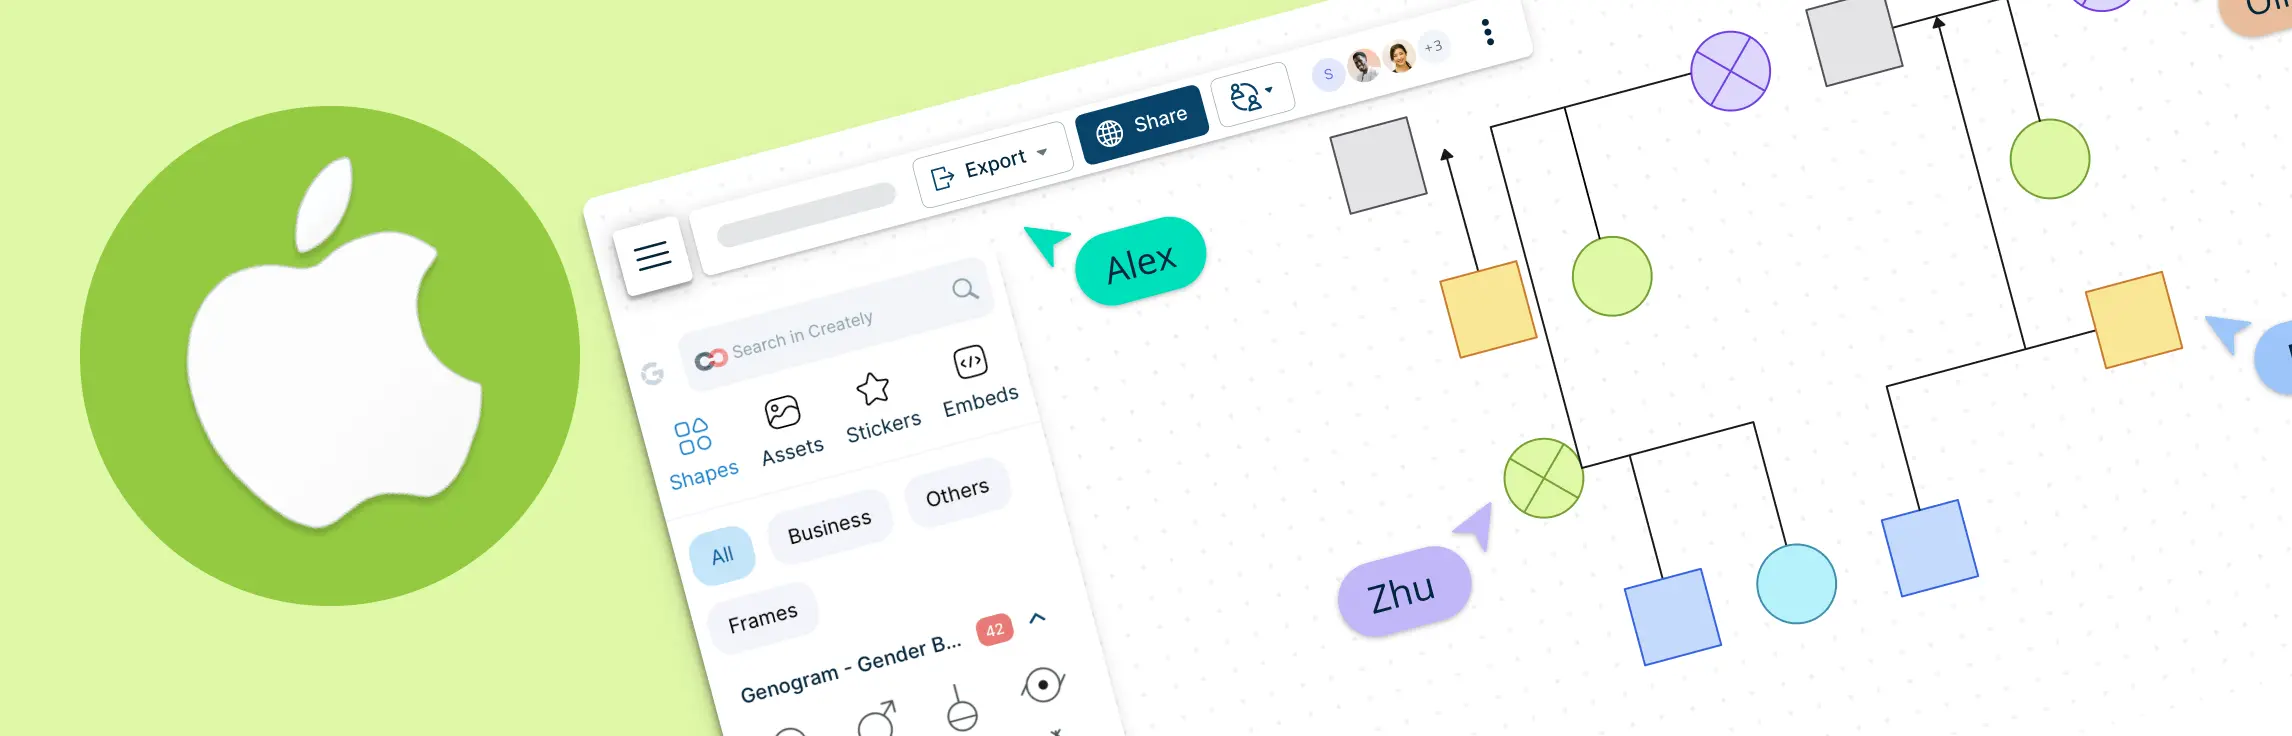
If you want to make a genogram on a Mac, you do not need to install a separate desktop app. Creately works in your browser, so you can start from Safari, Chrome, or another modern browser and build your genogram in an online workspace.
This guide shows how to create a genogram on Mac with Creately, including how to start from a template or blank canvas, add family members, connect relationships, add notes or structured details, collaborate with others, and export the finished diagram.
Step-by-Step: Make a Genogram on Mac
In the steps below, you’ll learn how to make a genogram on your Mac with Creately. We’ll cover how to add relatives quickly, document family details more accurately, organize larger trees, and share or export your work without downloading anything.
Step 1. Open Creately on your Mac
Whether you’re using an Intel Mac or an Apple Silicon Mac, you can create a genogram in Creately directly from Safari or Chrome. There is nothing to install, and Mac users can work faster with keyboard shortcuts, dark mode, and automatic saving while they build.
Open Safari or any modern browser on your Mac and go to Creately.
If you already have an account, just click Log In and enter your details. If you are new to Creately, you can create an account for free by signing-up with your email or Google account.
Step 2. Start from a template, or text-to-genogram with AI
- You can start in three ways: choose a ready-made genogram template, open a blank canvas, or use Creately’s AI genogram generator to create a first draft from a written family description or notes.
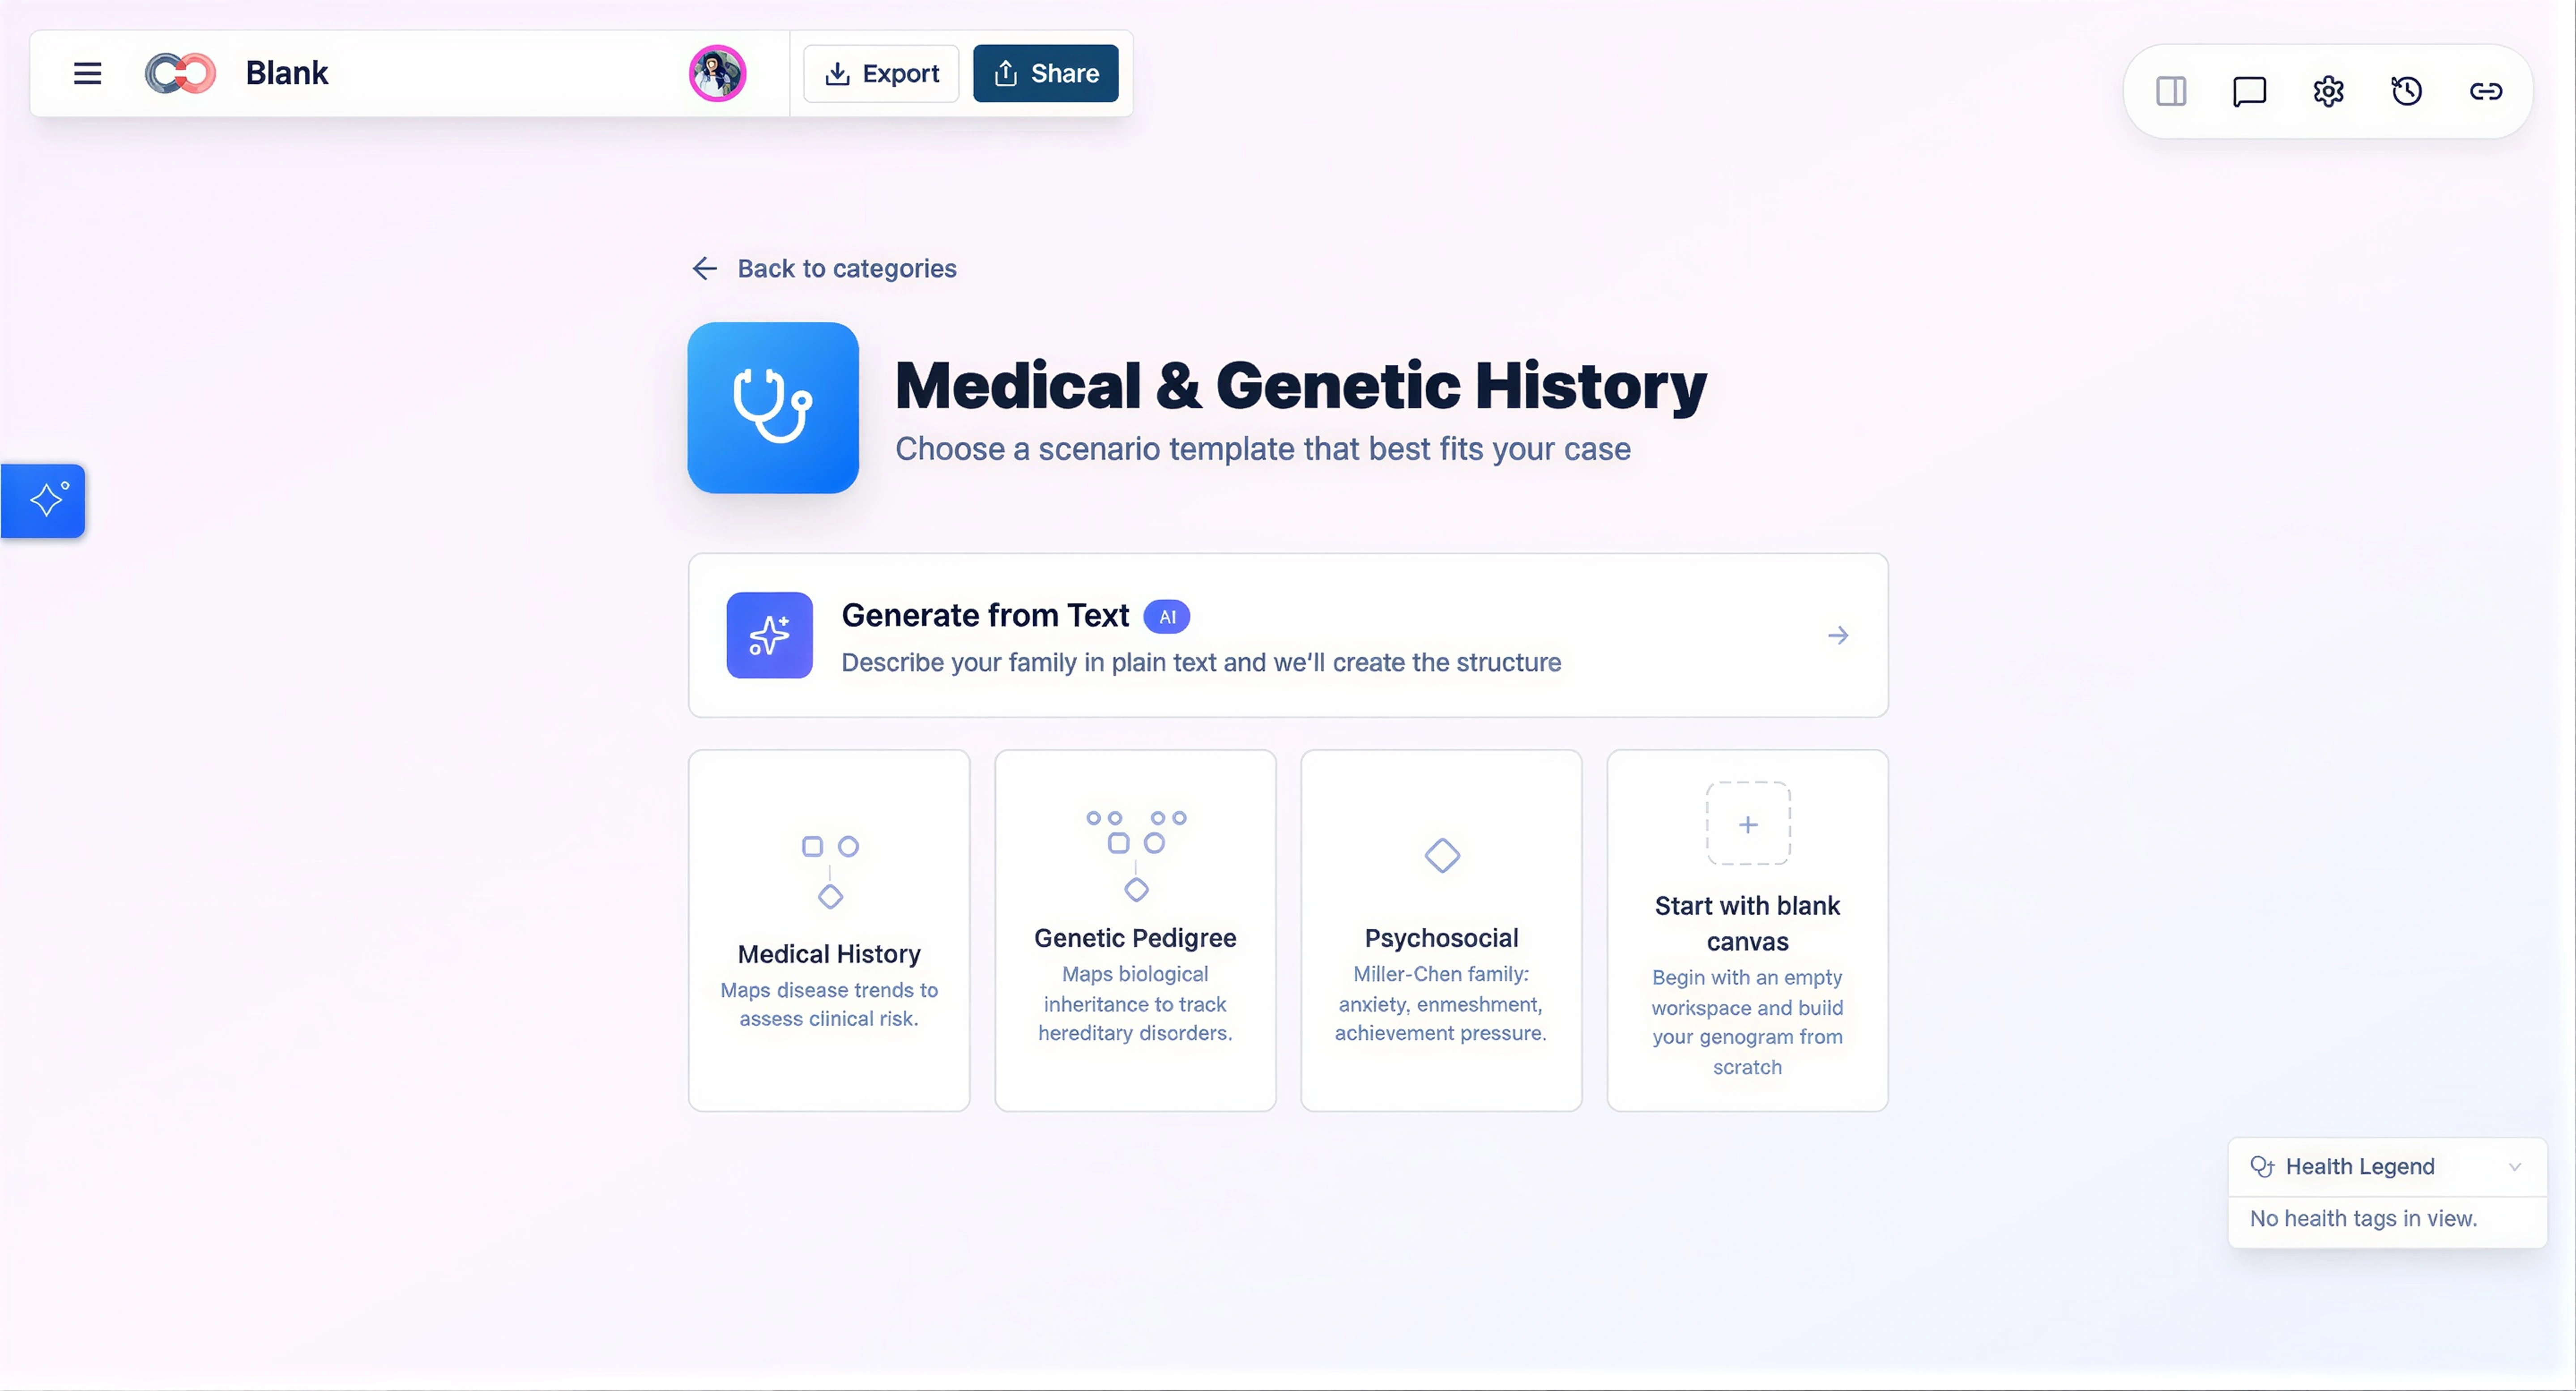
- If you use AI, treat the generated genogram as a starting point. Review names, relationships, generations, and any missing details before using it as your final diagram.
Step 3. Add people to your genogram
Use Creately’s genogram shape library to add family members with standard symbols. You can drag shapes onto the canvas, or use quick-add controls and keyboard shortcuts to add connected relatives such as partners, children, parents, and siblings faster.
- Click the Plus button in the lower-left corner to open the genogram shape library to access the notation you need. Here you’ll find standard person symbols along with more detailed notation for clinical and relationship-focused genograms. If you want a quick refresher, see Creately’s guide to genogram symbols
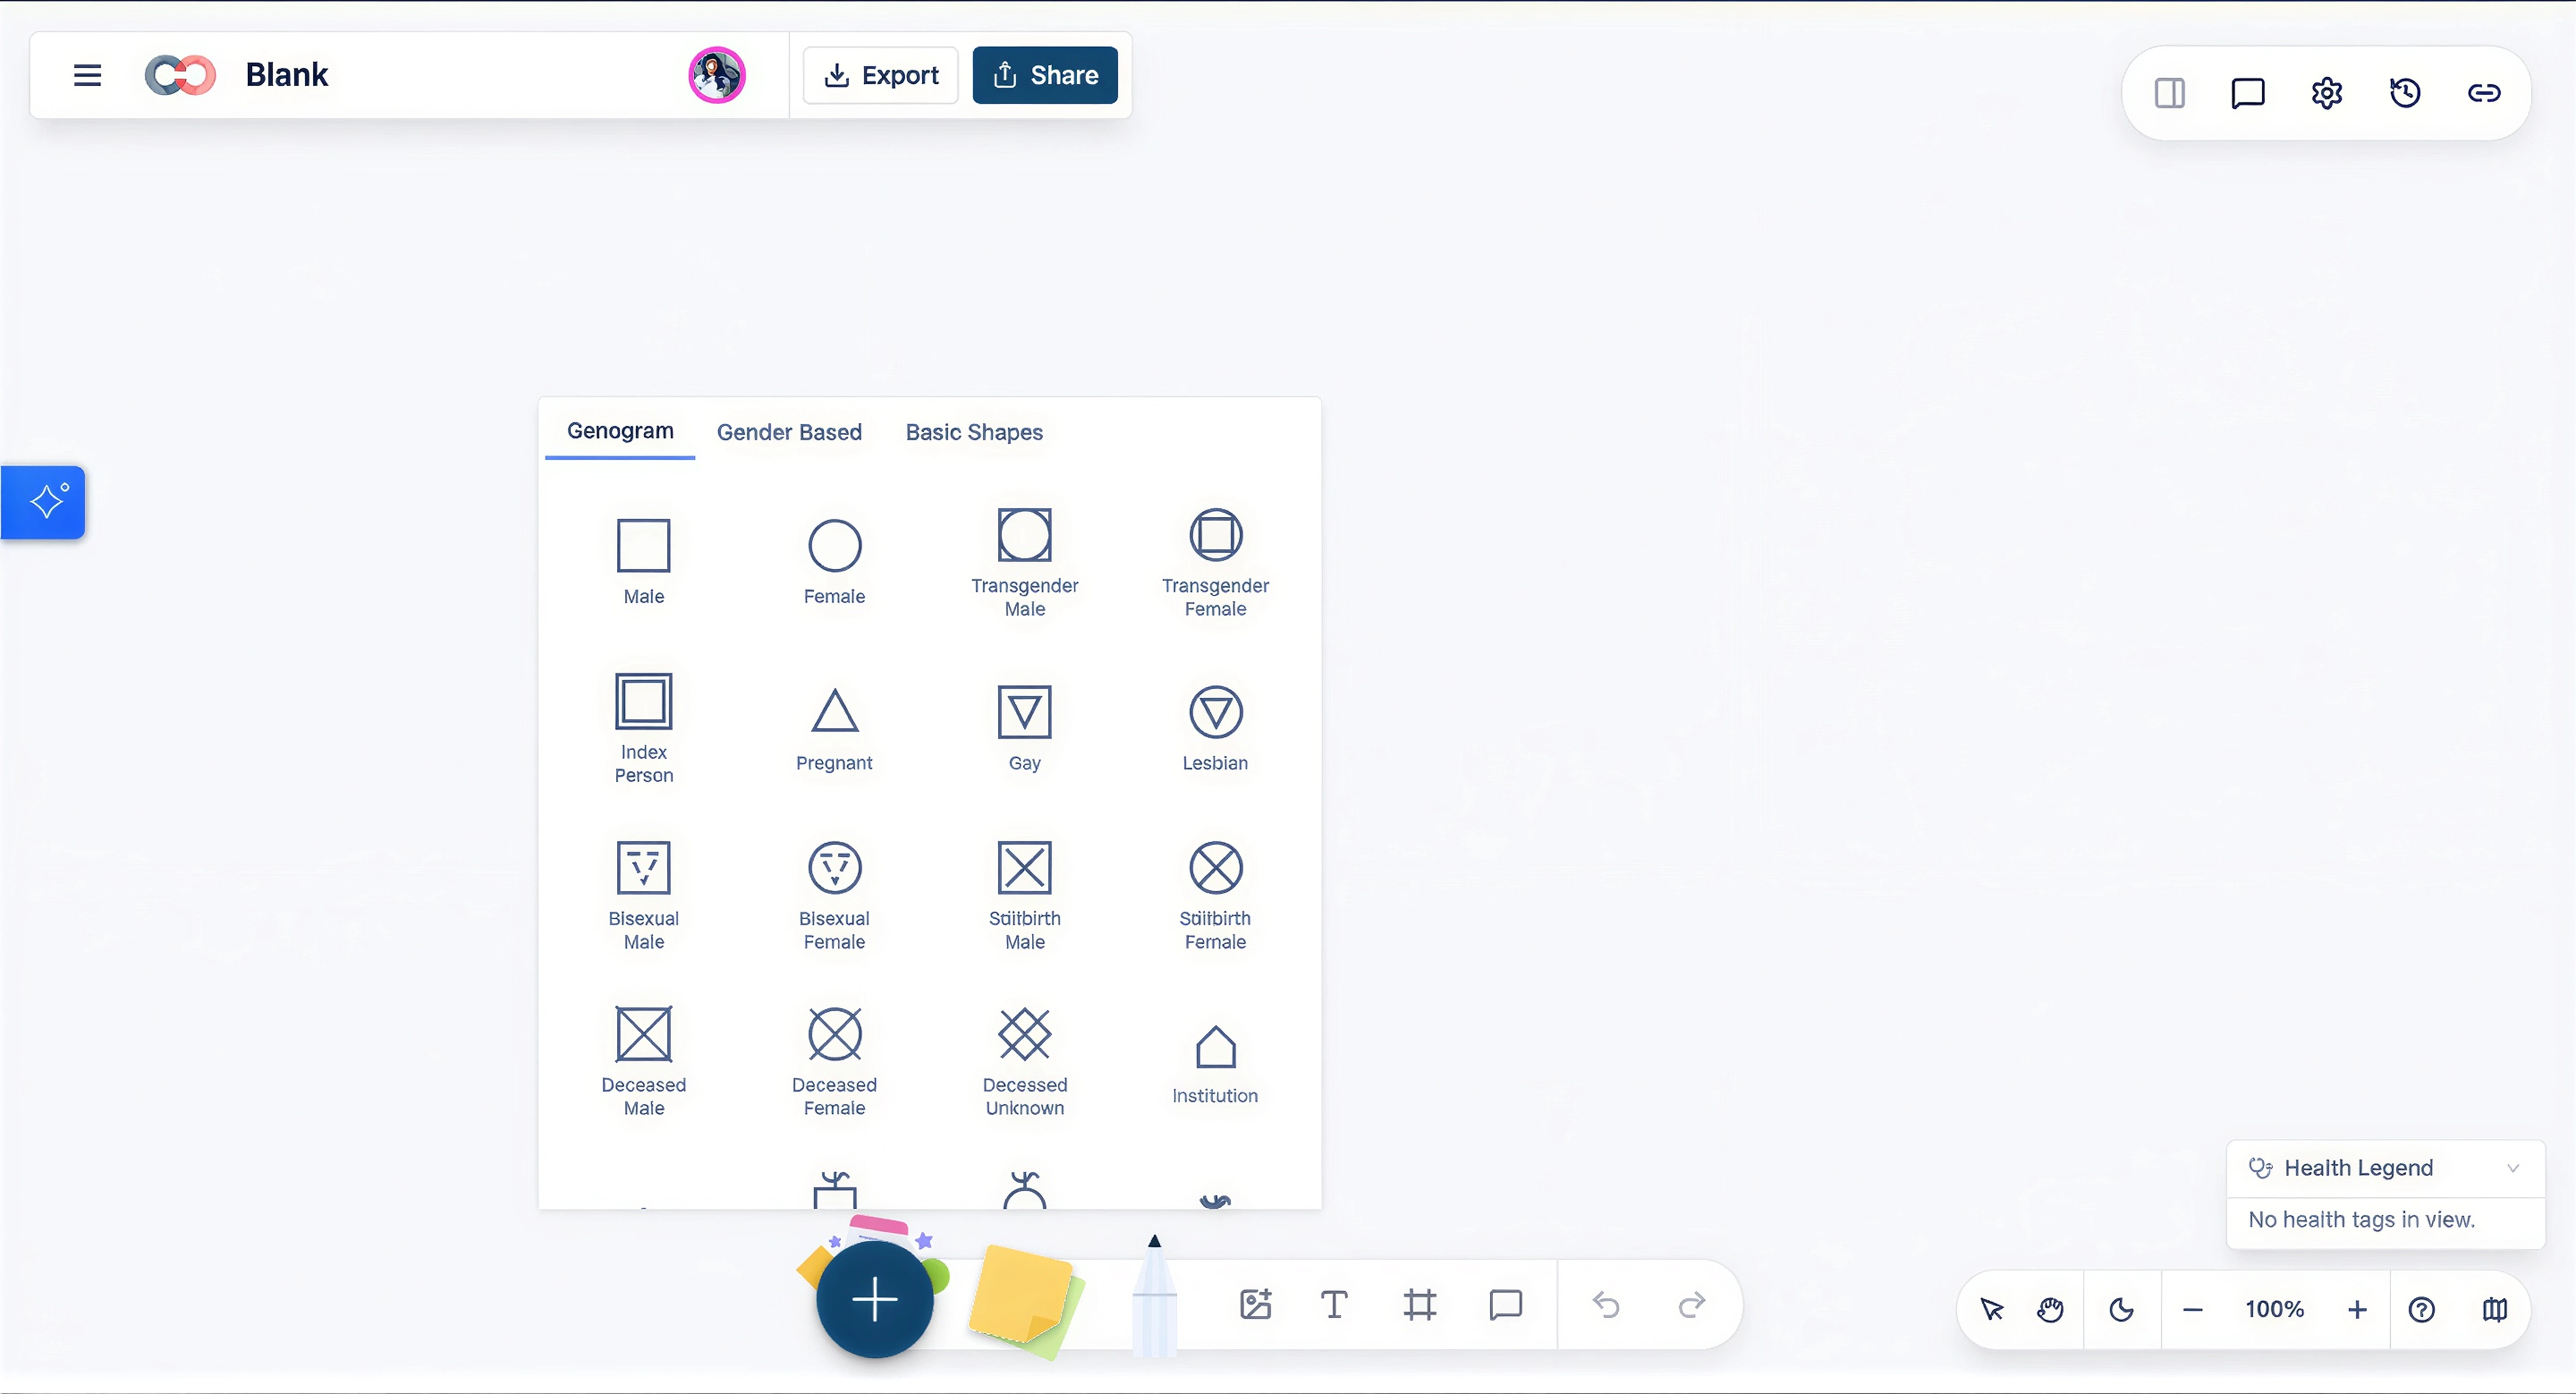
Click and drag a shape onto the canvas for each family member, then double-click to add a name, date of birth, or other basic details.
To move faster on a Mac, select a person and use the quick-add shortcuts: press 1 for partner, 2 for child, 3 for parent, 4 for both parents, and 5 for sibling. This is especially helpful when you’re building a genogram during an interview or working from handwritten notes.
If someone is deceased or has an important status you want reflected visually, update the person’s properties so the symbol changes automatically instead of manually redrawing it.
Step 4. Connect family members with relationship lines
Now it’s time to show how everyone is connected.
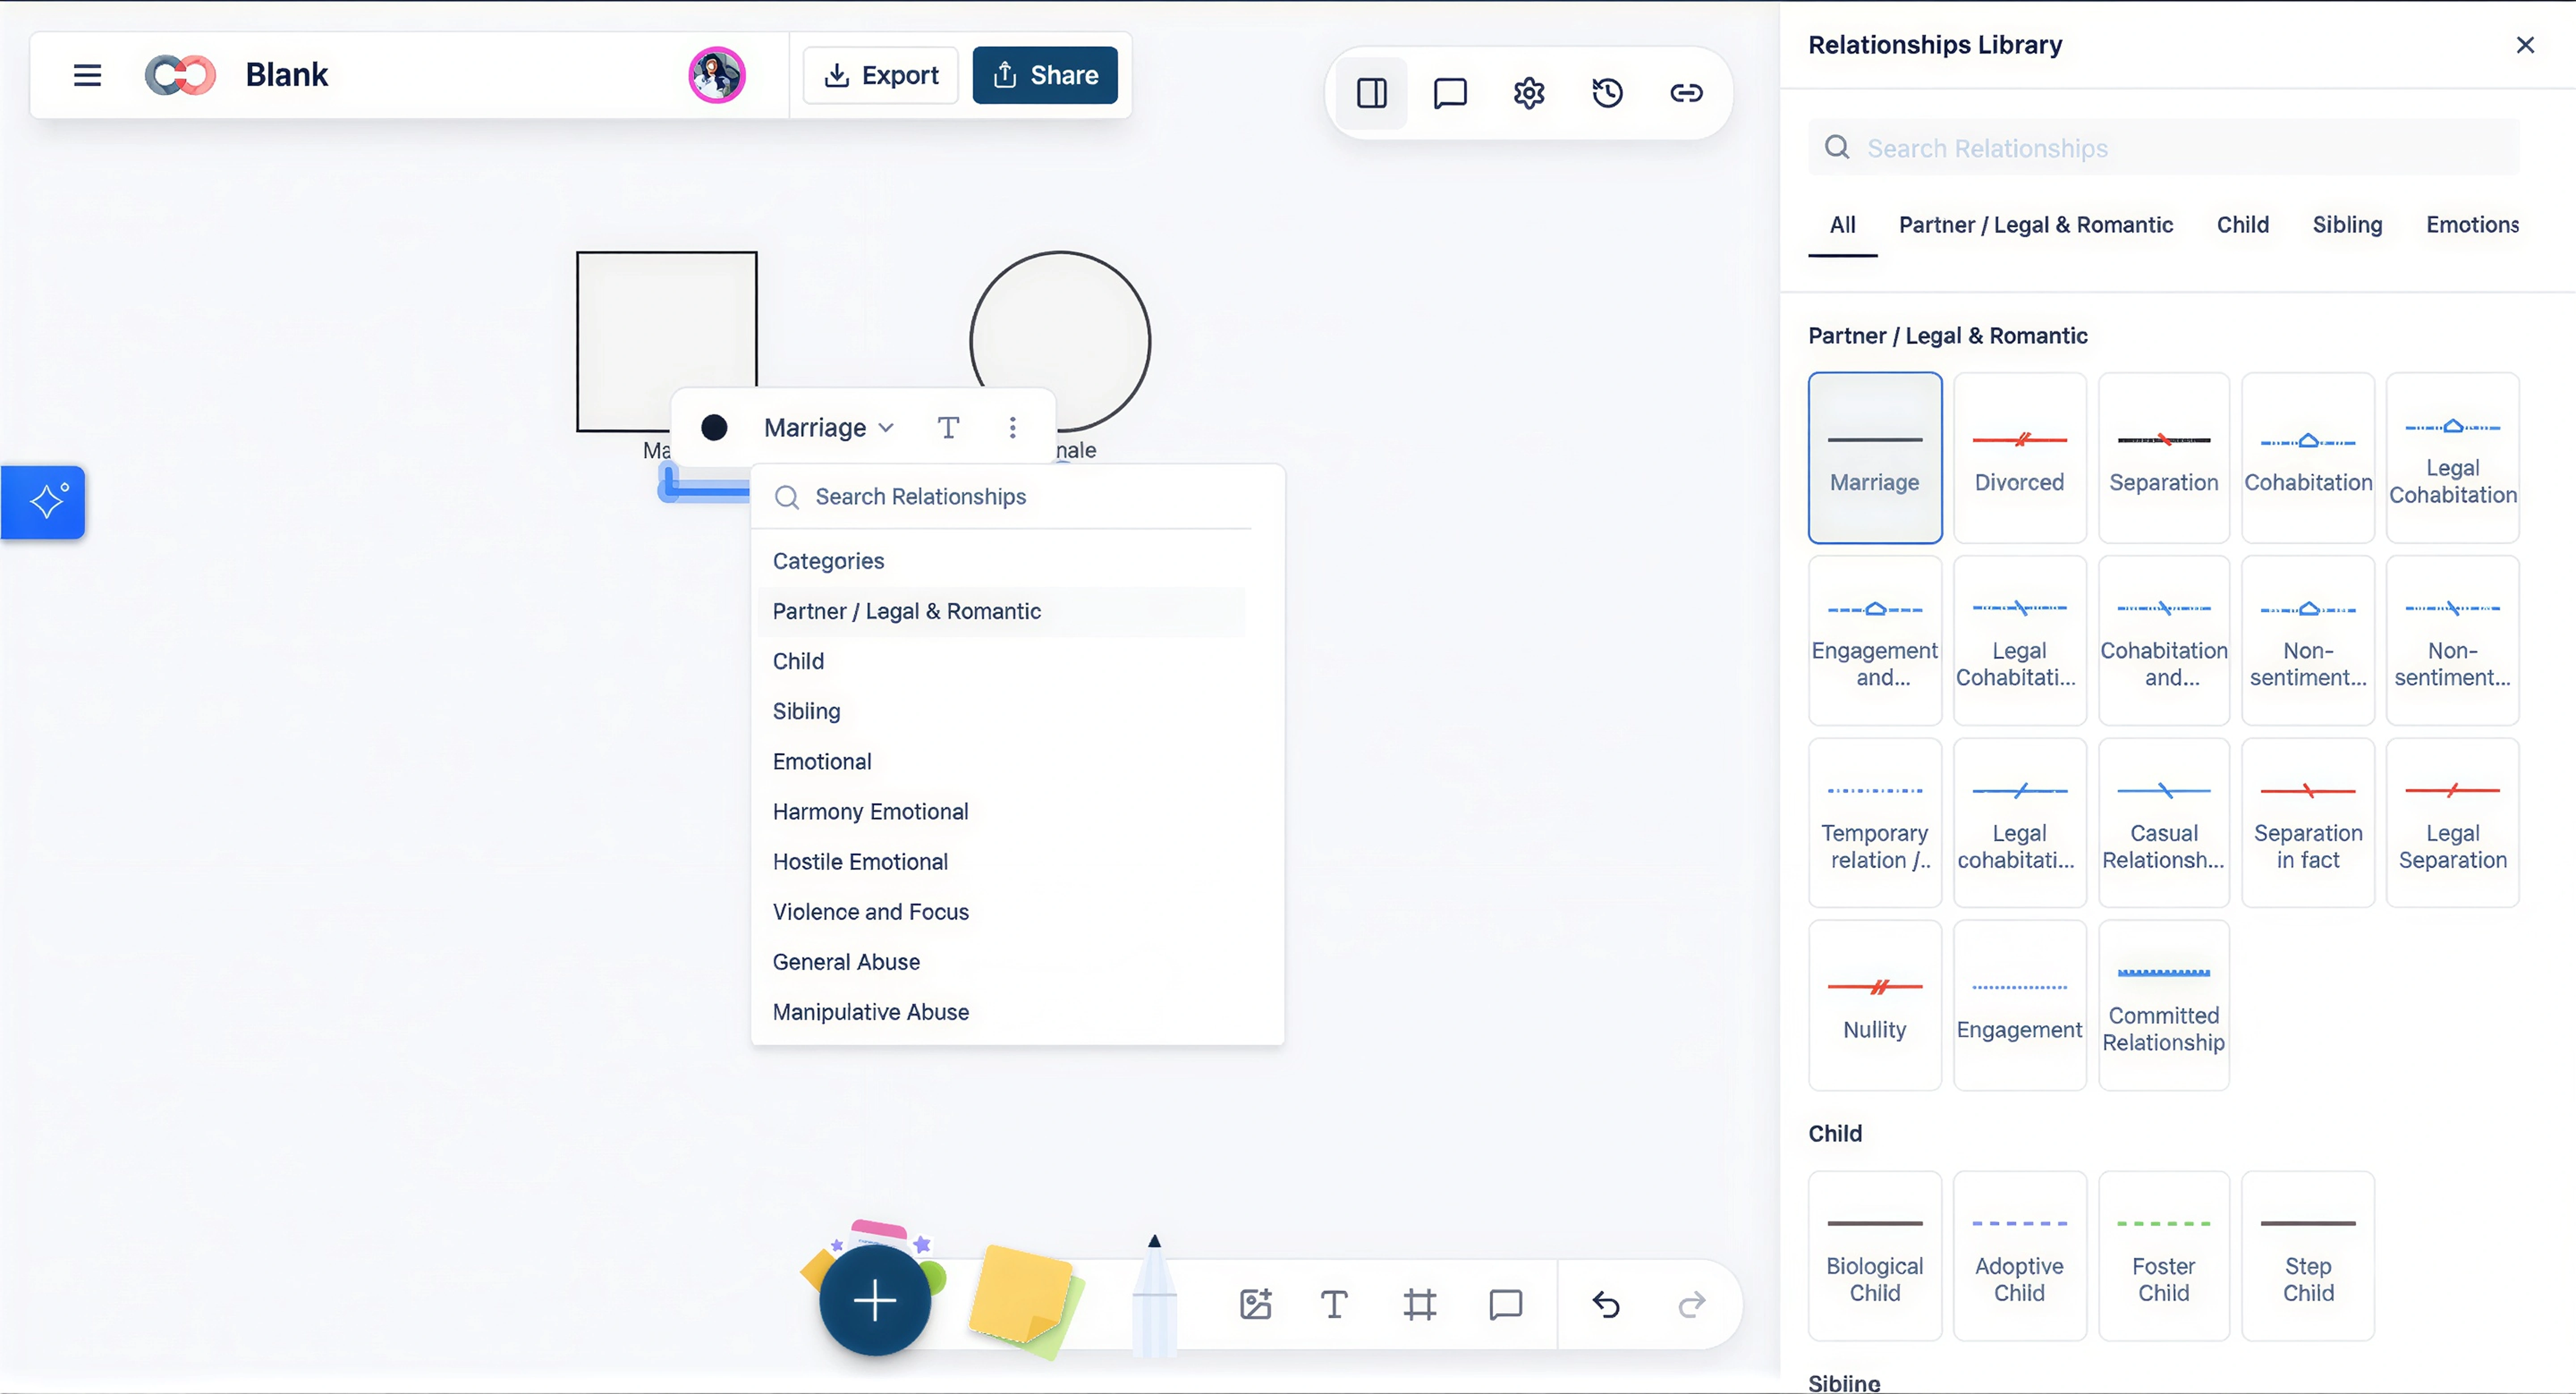
To connect two people, select a shape and use the connector handles or the contextual toolbar. You can also select two shapes at a time, and use the keyboard shortcuts to add relationships (1 for adding relationship and 2 for adding a child).
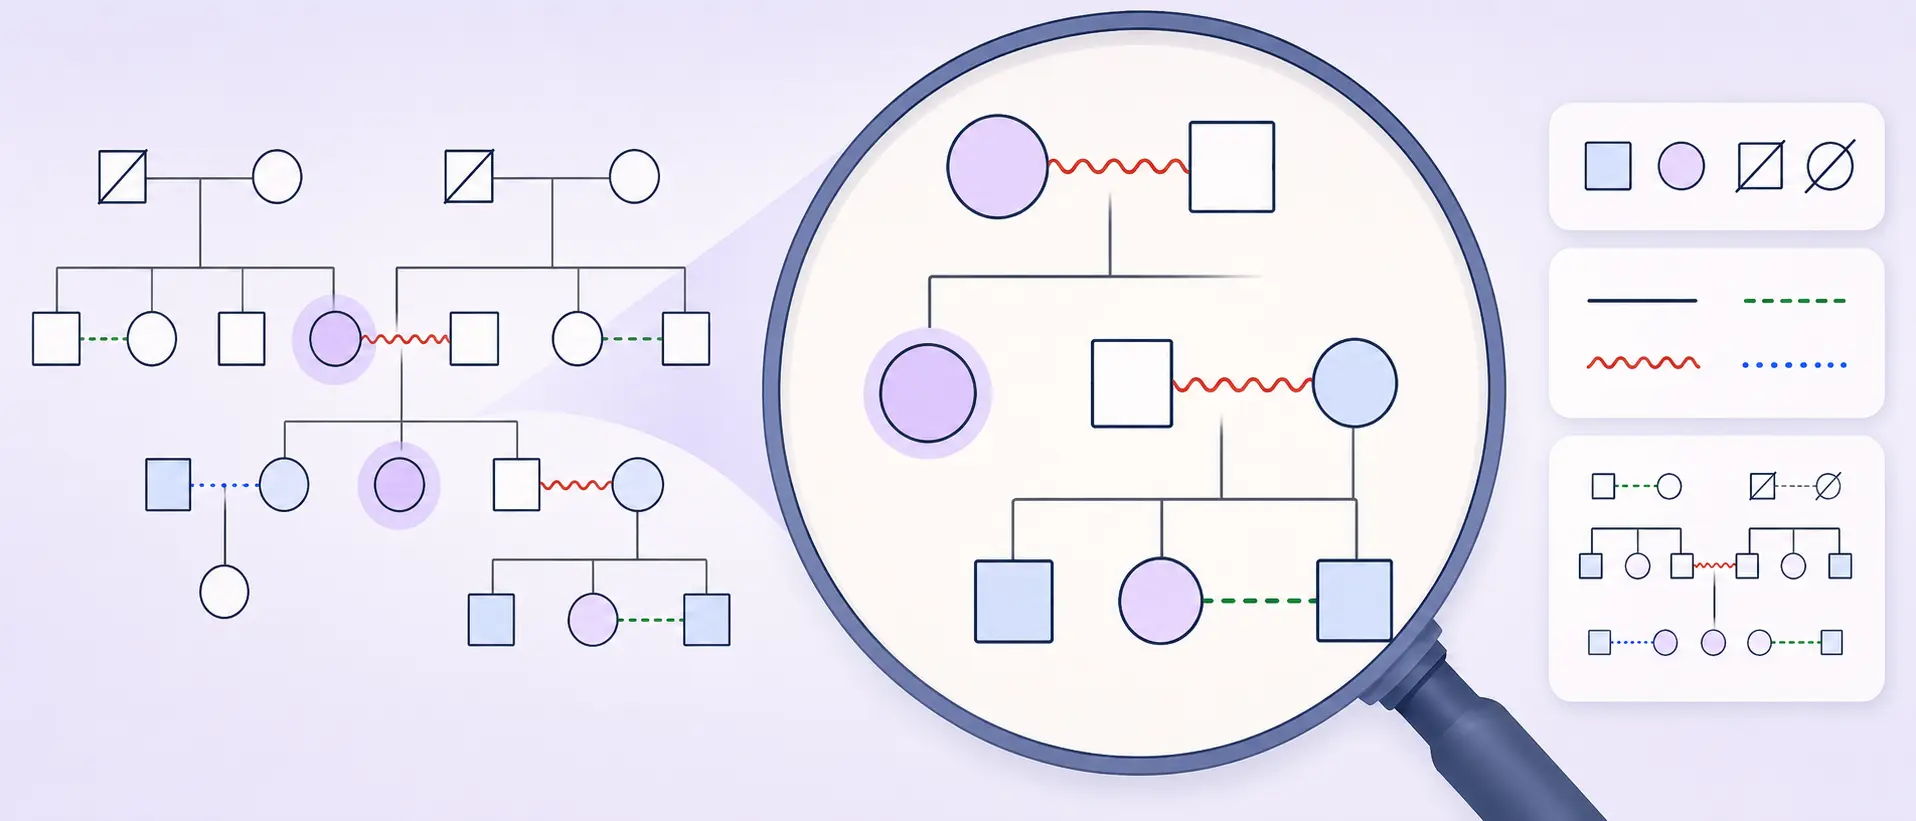
Creately supports a much wider range of genogram relationships than a basic family tree, including marriage, divorce, separation, cohabitation, biological, adoptive, foster, and step relationships, plus emotional relationship markers such as closeness, conflict, and cut-off.
This makes it easier for Mac users to build a genogram that reflects real family structures instead of forcing everything into a simple parent-child chart.
Step 5. Add extra details and emotional relationships
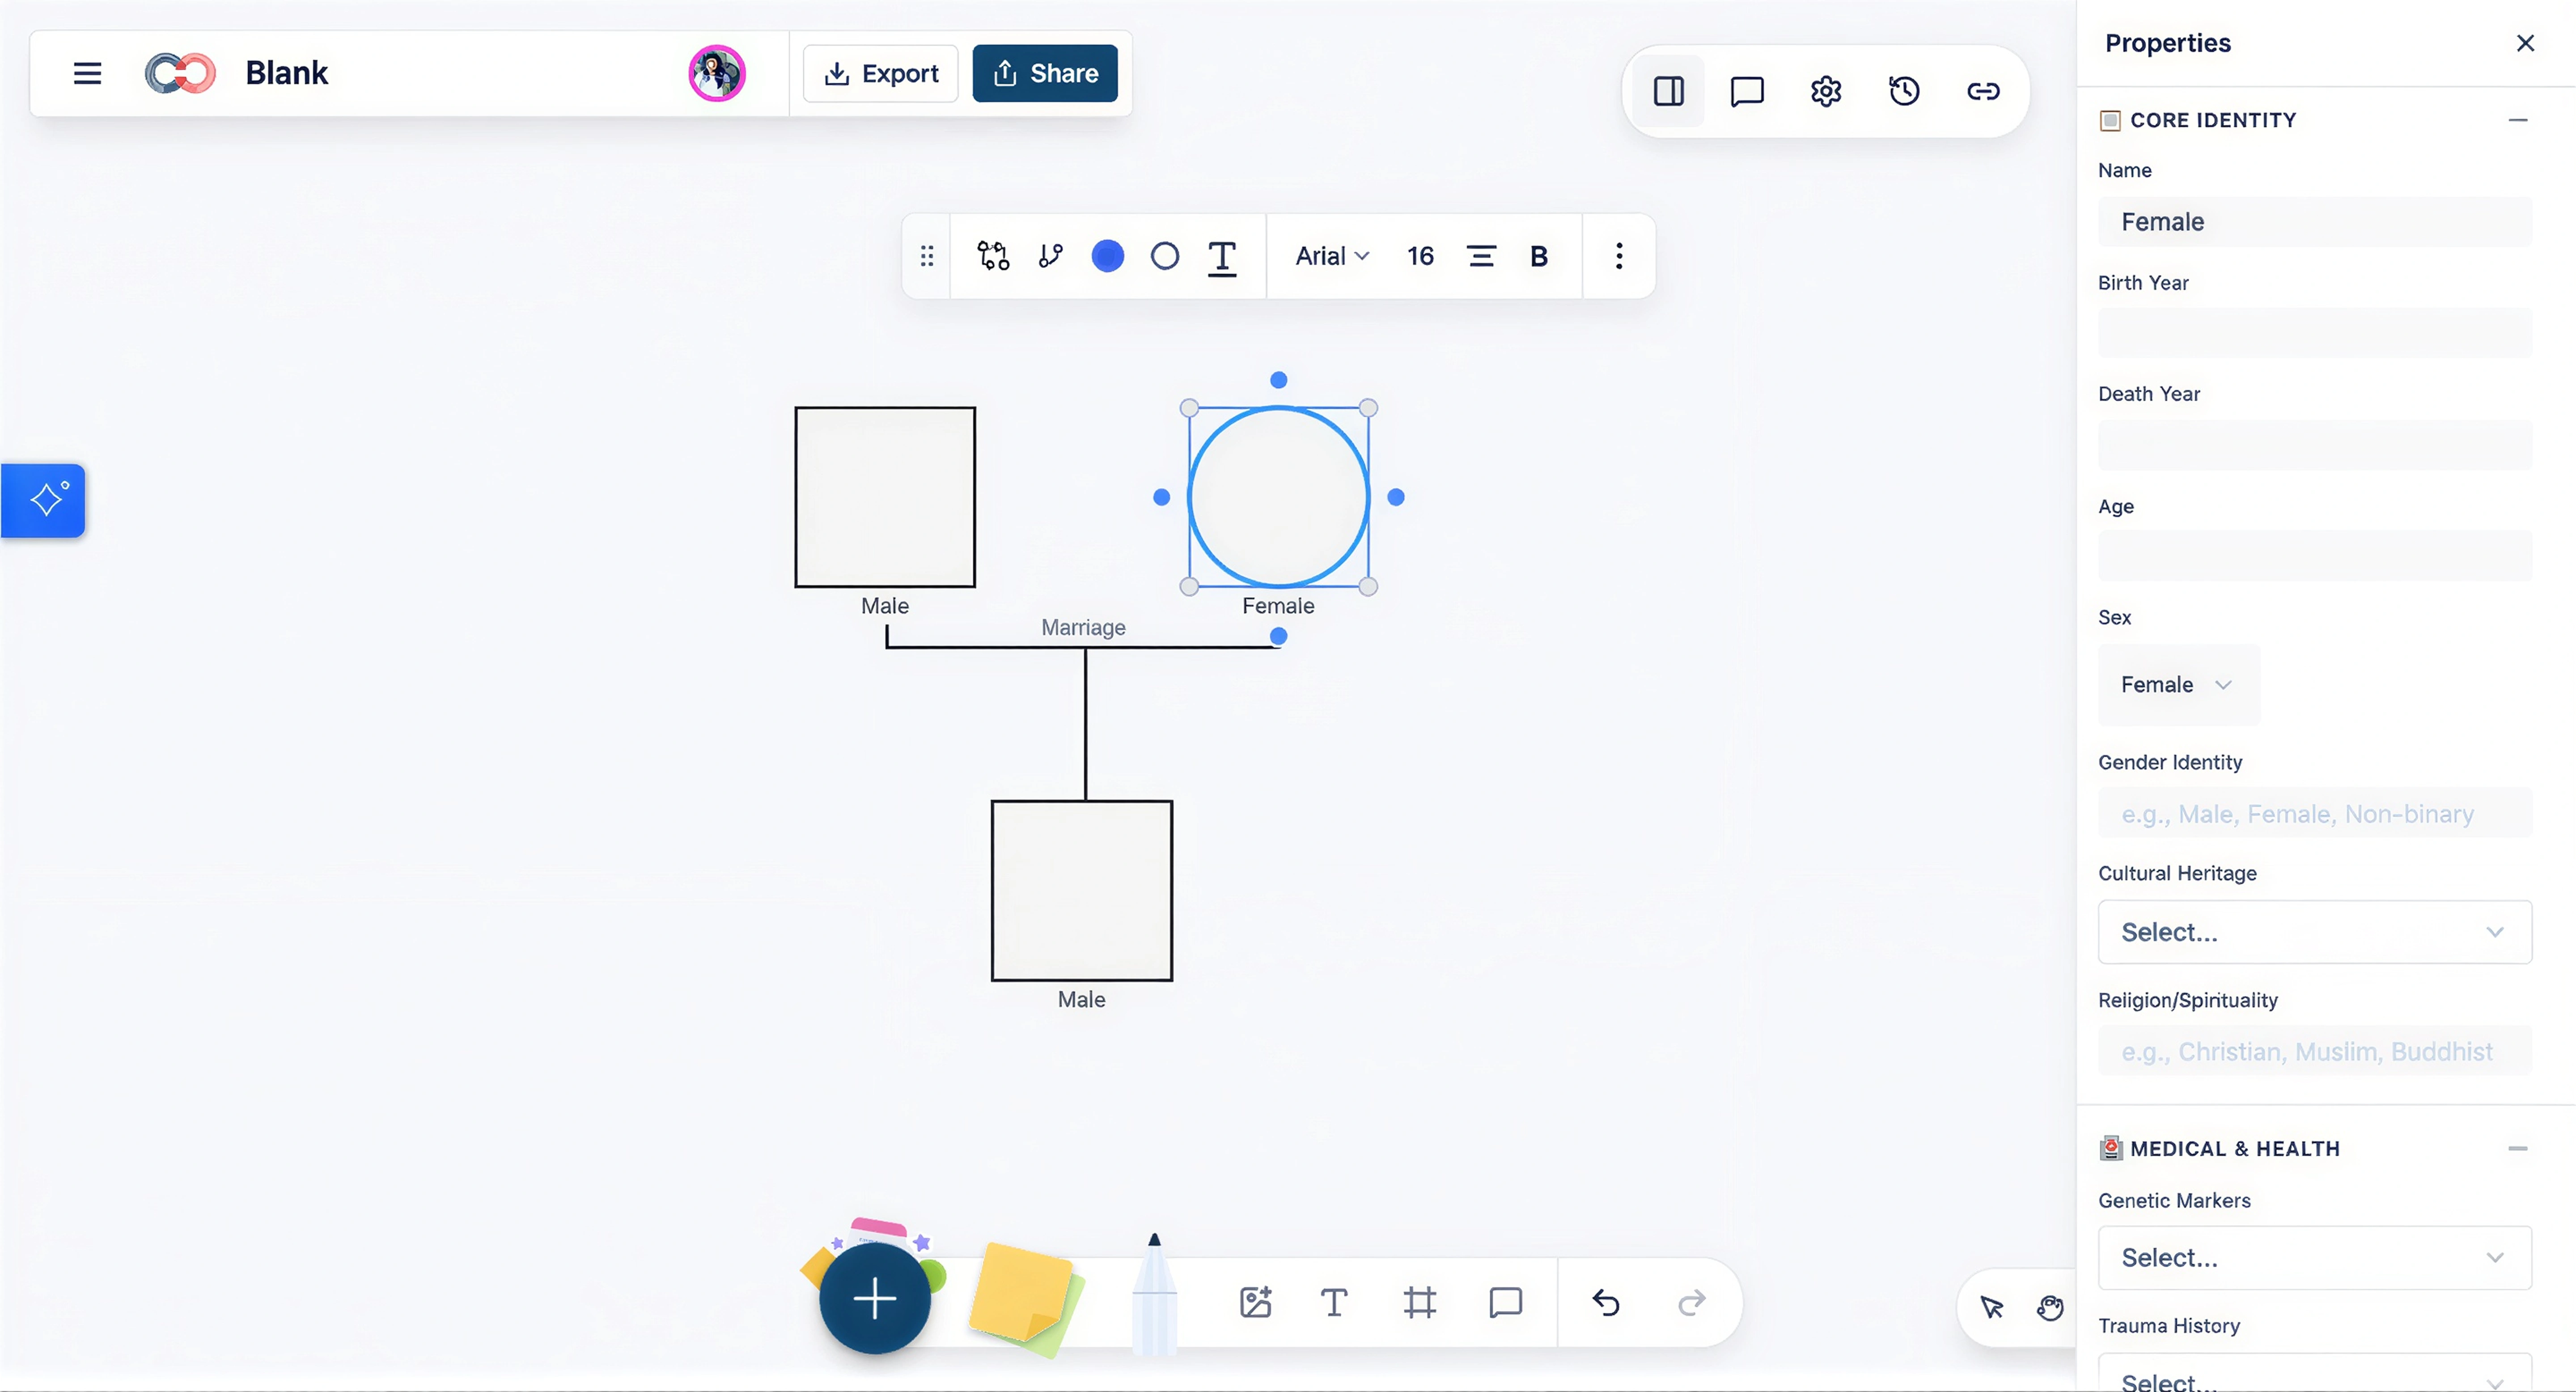
Click on a person or relationship to add details such as birth dates, health history, emotional dynamics, life events, or case notes. You can use notes for supporting context and structured fields when you need to capture medical, therapy, social work, legal, or research information consistently.
If you’re creating a medical or clinical genogram, add health conditions, genetic markers, medications, allergies, or behavioral details so the diagram becomes more useful than a visual family list.
If you want to highlight patterns visually, use colors, relationship lines, and viewpoint changes to make health, emotional, or cultural patterns easier to spot at a glance.
If you are reviewing specific patterns, use focused views such as Health View to look at medical information without overcrowding the main genogram.
Step 6. Organize the layout
As your genogram grows, it can start to feel a bit messy. Here’s how to tidy things up:
Arrange people by generation—grandparents at the top, then parents, and children at the bottom.
Use Creately’s grid lines and alignment tools to keep everything neat. These tools appear when you move shapes around.
If it helps, zoom in or out using the slider at the bottom right of the screen, so you can see the whole family clearly.
Step 7. Save, share, or export your genogram as a PDF, PNG, or SVG
Once you’re finished, or even halfway through, your work is already being saved as you go.
Creately automatically saves changes in real time, which is useful if you’re switching between windows, taking notes, or collaborating from your Mac during a session.
To share your genogram with someone else (like a teacher, counselor, or family member), click the Share button. You can collaborate live with teammates, and add feedback with comments.
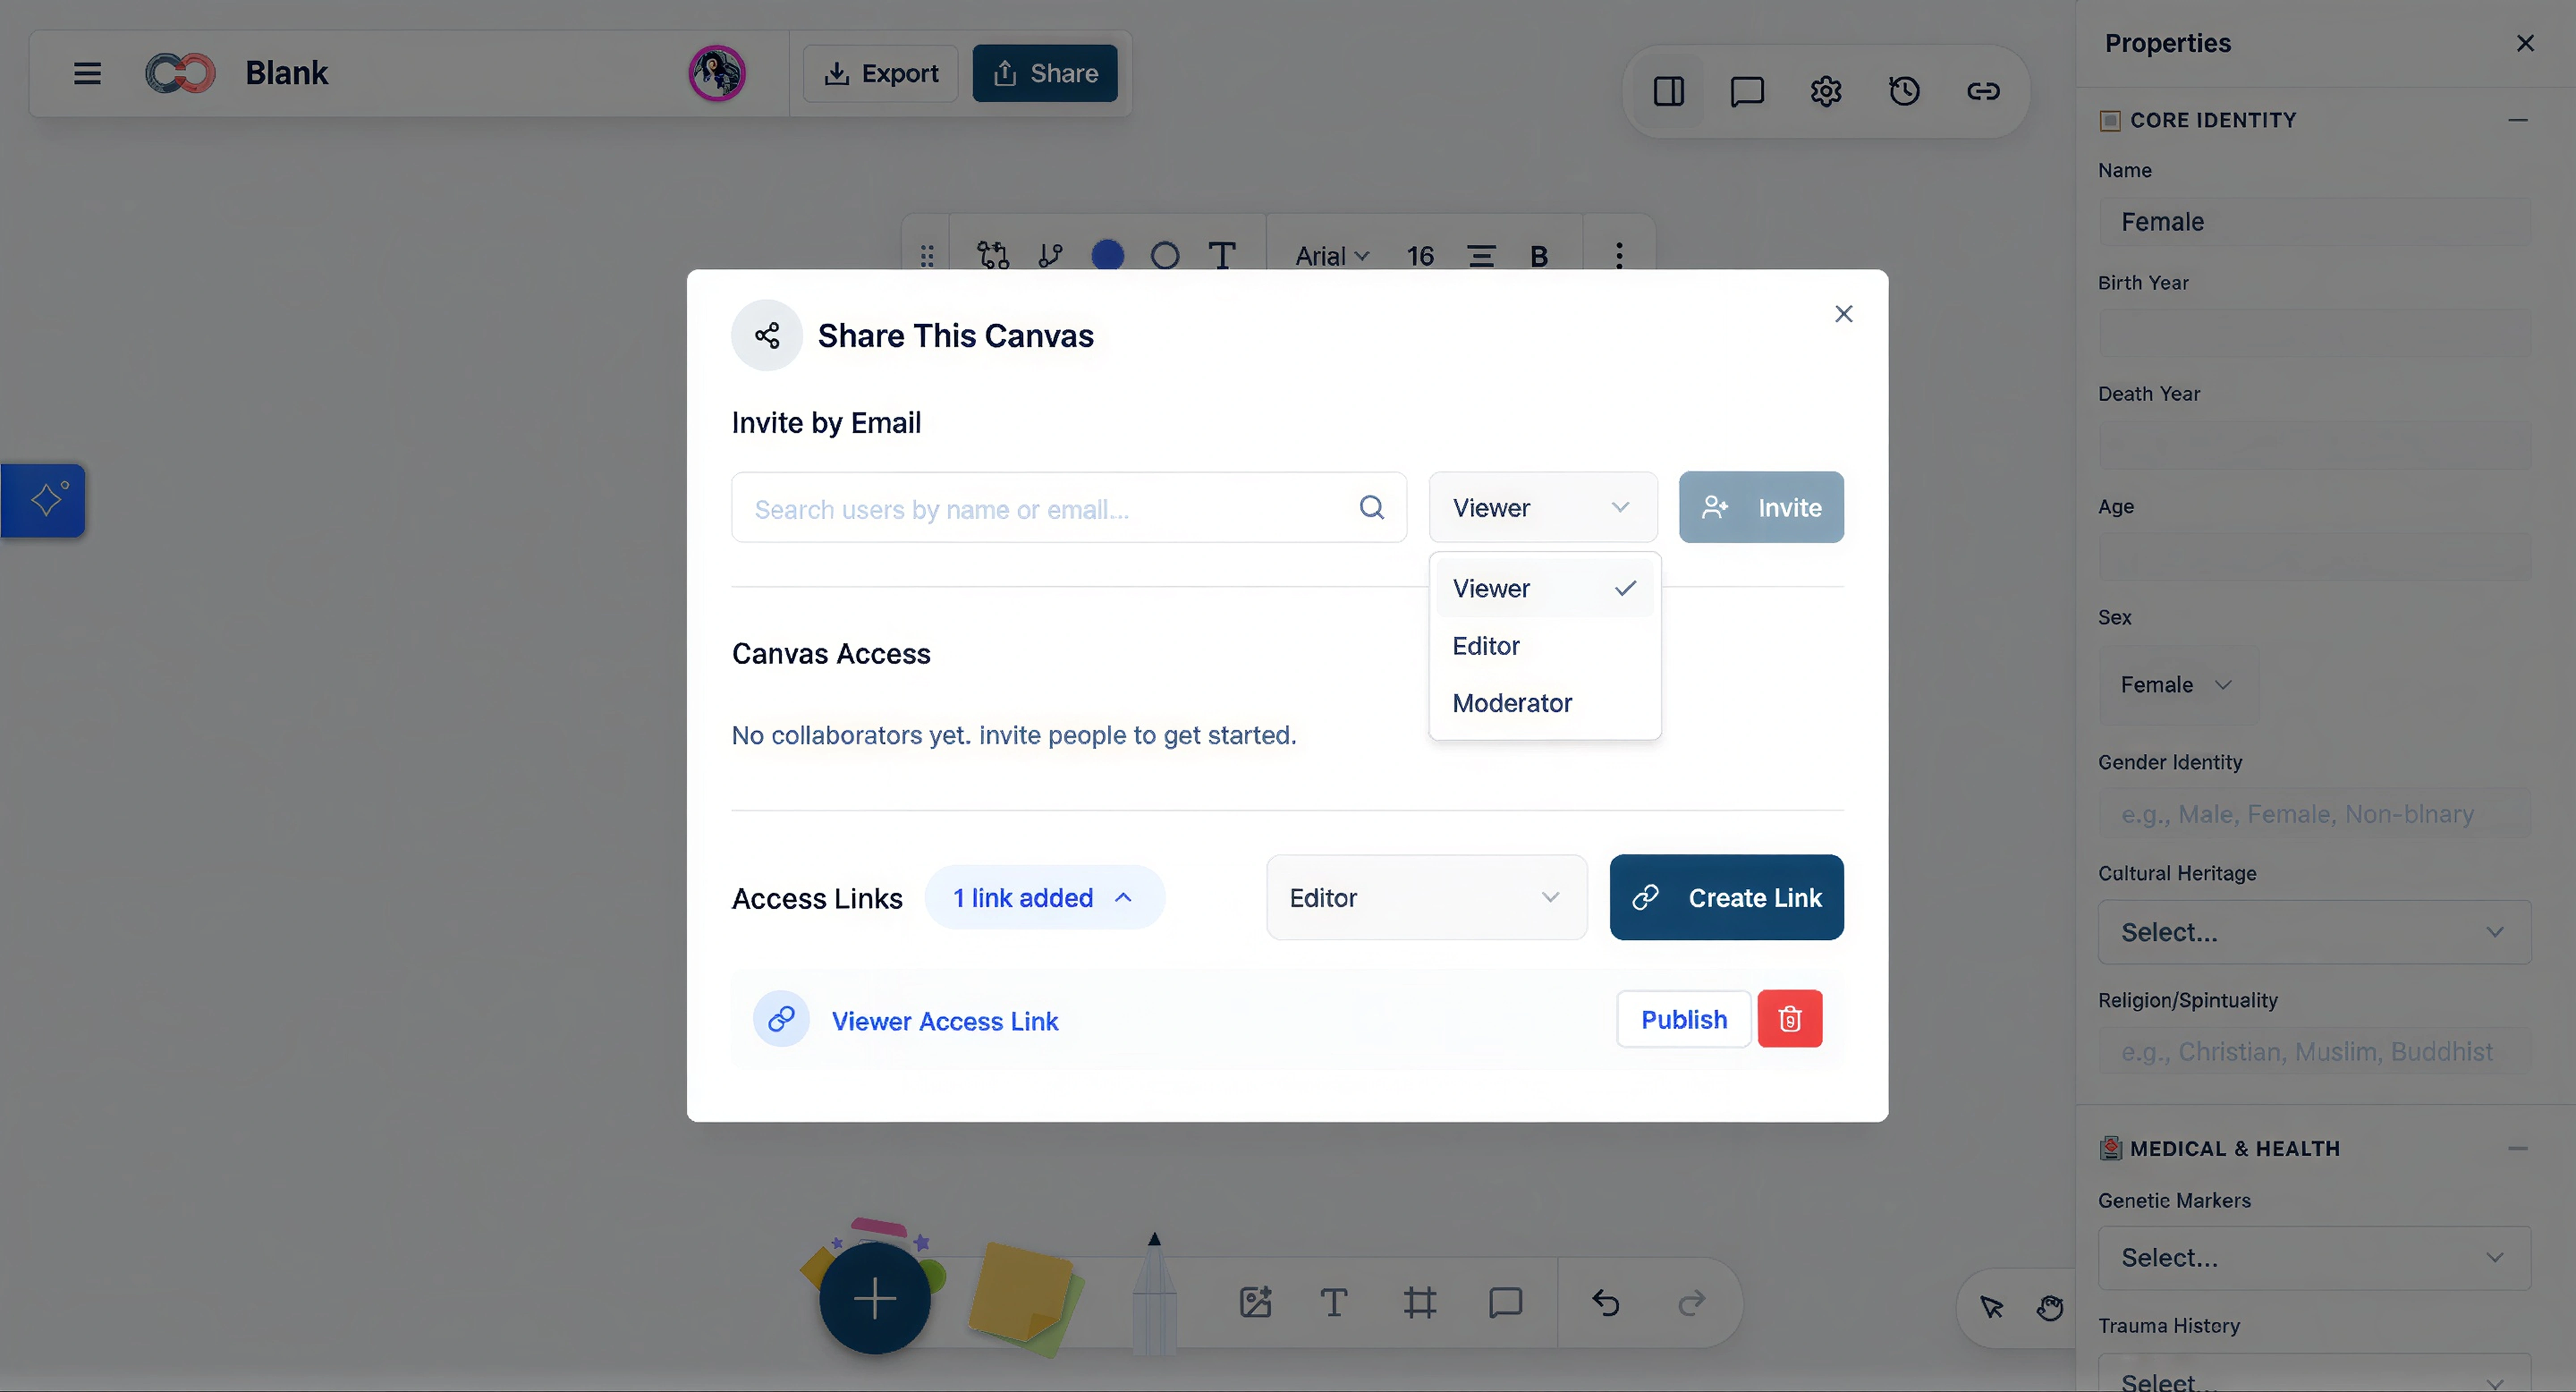
You can copy a private link, or invite someone by email. You can choose whether they can just view or also edit.
To download a copy, click Export, then choose a format like PDF, PNG, or SVG. This is great if you want to print it or include it in a report.
Ready-made Genogram Templates to Get Started
Now that you know how to make a genogram on Mac with Creately, here are a few templates to help you get started on your genograms.


Tips for Creating Genograms on Mac With Creately
Using Creately on your Mac gives you more than a blank canvas. You can work from templates, generate a first draft with AI, use clinical genogram notation, add structured details, and collaborate with others from the browser.
1. Start with AI or a template when you have existing notes
If you already have a family description, intake notes, or case summary, use Creately’s AI text-to-genogram feature to generate a first draft. Review the output carefully, then adjust names, relationships, dates, and missing details before using it as your final genogram.
If you prefer a visual starting point, begin with a blank, couple, 2-generation, 3-generation, or clinical framework template.
2. Use quick-add shortcuts to build faster
Instead of dragging every person and relationship manually, select a person and use quick-add controls or keyboard shortcuts to add close relatives such as a partner, child, parent, parents, or sibling. This is especially useful when you are building a genogram during a session or working through family details quickly.
3. Keep the genogram shape library open
Use Creately’s genogram shape library for standard person shapes and relationship notation. Person shapes can represent details such as male, female, unknown, deceased, pregnancy, and other markers, so you do not have to manually recreate these symbols each time.
4. Use the right relationship type, not just a line
Genograms rely on relationship meaning, not just visual connections. Use Creately’s relationship types to show marriage, divorce, separation, cohabitation, biological parent-child ties, adoption, foster relationships, step relationships, emotional closeness, conflict, cutoff, hostility, or abuse where relevant.
Add a legend if the genogram will be shared with others, especially in clinical, social work, education, legal, or research settings.
5. Add details with field packs instead of crowding the diagram
Keep the visual map readable by storing extra information in structured fields, notes, or attachments. Depending on the purpose of the genogram, you can use field packs for medical and genetic details, family therapy, social work, legal and estate planning, or research data.
This helps you capture important context without filling the diagram with too much text.
6. Use focused views to review patterns
When the genogram becomes detailed, use view modes to focus on specific information. For example, Health View can help highlight medical conditions across generations, while Culture View can help visualize cultural heritage, migration, or cross-cultural family patterns.
This lets you review the same genogram from different angles without creating separate copies.
7. Share with the right permission level
When you collaborate with others, choose the right access level. Use view-only access when someone only needs to review the genogram, and editor access when they need to make changes. This is useful when working with supervisors, clinicians, educators, researchers, or family members.
8. Let auto-save protect your work
Creately auto-saves your genogram as you work, so you do not need to manually save after every change. This is helpful when you are building a large family map or making updates during a conversation.
9. Export based on how the genogram will be used
Choose the export format based on the final purpose. Use PNG or JPEG for quick visuals, SVG for high-quality diagrams or large-format printing, PDF for sharing or filing, DOCX for editable documentation, and JSON when structured data is needed for research or analysis.
For professional workflows, you can also generate a PDF or DOCX case file that includes the diagram, individual profiles, relationship details, and a symbol legend.