Restructuring is easier to plan when you can see the organization clearly. An org chart gives you a practical way to map the current structure, spot issues, test new reporting lines, and communicate changes in a way people can actually understand. Instead of treating the organizational chart as something you update after decisions are made, use it as a working tool throughout the restructuring process. This guide explains how to use org charts to assess your current structure, compare future-state options, plan transitions, and communicate restructuring changes more clearly.
What an Org Chart Helps You See During Restructuring
When organizations begin restructuring, many of the problems are already visible in the structure. The challenge is that they are often spread across departments, teams, and reporting lines, making them hard to see clearly without a visual view.
Reporting line issues: You can see who reports to whom, where the structure is too layered, and where managers may have too many or too few direct reports.
Role overlap and duplication: It becomes easier to spot teams doing similar work, overlapping leadership roles, or responsibilities that are divided in unclear ways.
Accountability gaps: A restructuring organizational chart can reveal where ownership is missing, where decision-making is unclear, or where important functions do not have a clear home.
Team imbalances: You can compare team sizes, leadership distribution, and how resources are spread across departments or business units.
Cross-functional complexity: If your organization relies on collaboration across teams, an org chart can show where handoffs, dependencies, or matrix relationships may be creating friction.
Future planning needs: It also helps you visualize open roles, planned leadership changes, and future-state structures before changes are rolled out.
When to Use an Org Chart in a Restructuring Process
Org charts are useful in many types of restructuring, not just large-scale reorganizations. They can support both major change initiatives and smaller structural adjustments.
Growth has outpaced the current structure
As companies grow, reporting lines often become uneven and teams expand without a clear structure. An org chart helps you redesign around the way the organization works now, not how it worked a year ago.
Teams or departments need realignment
If responsibilities have shifted over time, restructuring the organizational chart can help you redraw team boundaries and clarify ownership.
You need to improve efficiency
When reducing duplication, improving coordination, or simplifying leadership layers, org charts help you see where structural inefficiencies are happening.
Leadership changes are happening
A restructuring organizational chart can support succession planning, role transitions, and changes in executive or department leadership.
A merger, acquisition, or integration is underway
Org charts help compare structures, identify overlaps, and design how teams will fit together after integration.
Employees need more clarity during change
When people are unsure who they report to, how teams are changing, or what the new structure looks like, a clear org chart becomes one of the most useful communication tools you can provide.
Steps to Create an Org Chart for Restructuring
Step 1. Start with the business goal behind the restructure
Before changing reporting lines or moving teams, get clear on what the restructure is supposed to achieve. The org chart should support the business goal, not drive it.
This could include:
- reducing costs
- speeding up decision-making
- supporting growth
- improving customer alignment
- combining overlapping functions
- preparing for expansion or leadership change
Ask:
- What is not working in the current structure?
- What should the new structure make easier?
- What outcomes should this restructuring support over the next 12 to 24 months?
How to do it in Creately
Use Creately as your planning workspace.
You can:
- start with your existing organizational data from a spreadsheet or HRIS export
- use custom fields and field packs to add the business context behind roles, departments, workforce data, and planning needs
- ask natural-language questions about the org to connect structural decisions to real team data
- keep restructuring discussions tied to actual reporting lines, roles, and workforce realities instead of assumptions
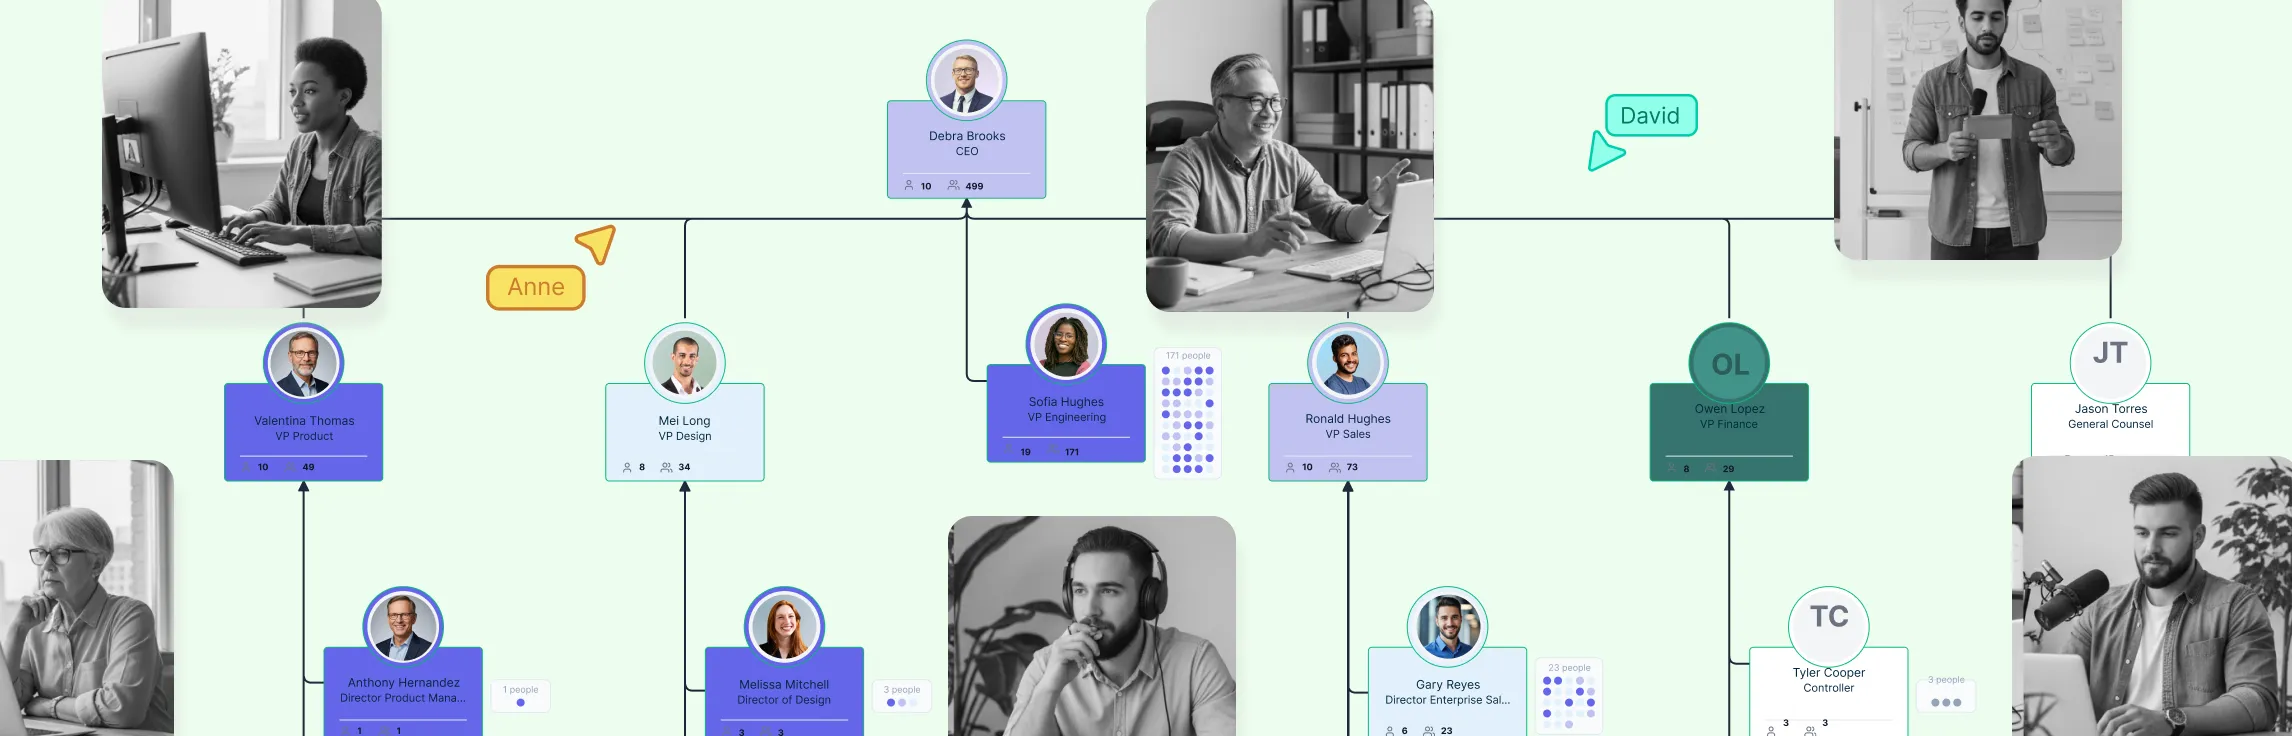
Step 2. Build a clear current-state org chart
Map the organization as it exists today so everyone is working from the same view of the current structure.
Your current-state org chart should include:
- employees or positions
- reporting relationships
- departments or functions
- team leads and managers
- important cross-functional roles
- open positions, if relevant
The chart should reflect how the organization actually works, not just the formal structure on paper.
How to do it in Creately
Creately makes it easy to build the current-state chart quickly and accurately.
You can:
- import your org chart from CSV using the auto-mapping wizard
- bring in fields like Name, Title, Manager, Department, Employee ID, Hire Date, and Position Title automatically
- validate missing employee IDs, unknown managers, reporting cycles, and empty rows before import
- use auto-layout to generate a clean hierarchy instantly
- edit names and titles directly on the cards
- add new roles using blue connection dots instead of manually redrawing the chart
- model positions separately from people, which is especially useful when roles are vacant or part of future workforce planning
Step 3. Mark the structural problems on the chart
Once the current-state organizational chart is in place, use it to identify what is making the structure hard to manage.
You might look for:
- duplicated roles across teams
- managers with too many direct reports
- unclear team ownership
- disconnected functions
- conflicting responsibilities
- missing leadership layers
- uneven team growth
- decision bottlenecks
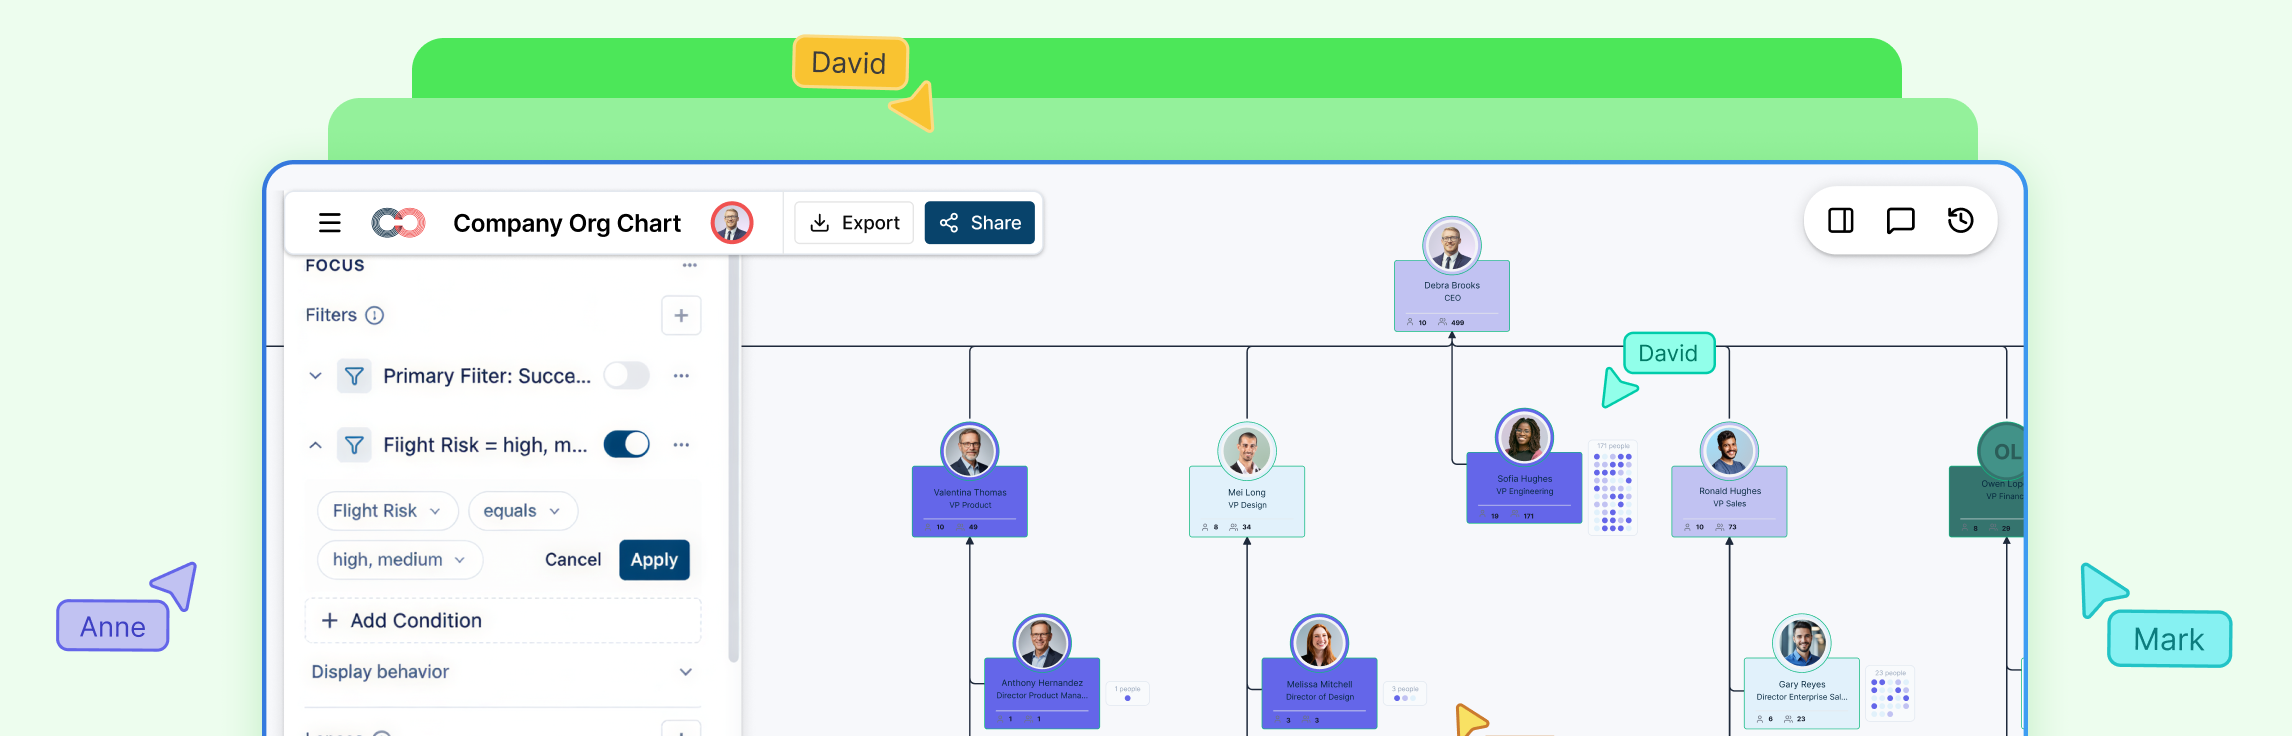
How to do it in Creately
Creately helps turn the organizational chart into a working analysis tool.
You can:
- apply filters to isolate specific groups or issues
- color the chart by department, location, worker type, 9-box placement, or other categorical fields
- use heatmaps for numeric patterns such as tenure, salary, engagement, or compa-ratio
- use AI-powered insights to surface structural issues such as overly wide spans of control
- ask natural-language questions to identify patterns and problem areas faster
Step 4. Gather input from the right stakeholders
A restructuring org chart should not be designed in isolation. Structural change affects how people work, who they report to, and how decisions get made.
Input may come from:
- HR or people operations
- executive leadership
- department heads
- team managers
- finance or operations leaders
- employees who understand workflow issues on the ground
How to do it in Creately
Creately supports collaborative restructuring discussions directly on the canvas.
You can:
- invite stakeholders to review the org chart in real time
- use comments and @mentions to collect feedback in context
- let multiple collaborators view and edit the chart simultaneously
- control access with viewer, editor, moderator, and owner permissions
- keep sensitive information protected with field-level visibility and sensitivity controls so the right people see the right data only
Step 5. Create more than one future-state org chart
Instead of jumping straight to one answer, create multiple future-state options and compare them.
For example, you may want to compare:
- a function-based structure
- a business-unit structure
- a regional structure
- a flatter management structure
- a structure that consolidates overlapping teams
This makes trade-offs easier to see and discuss.
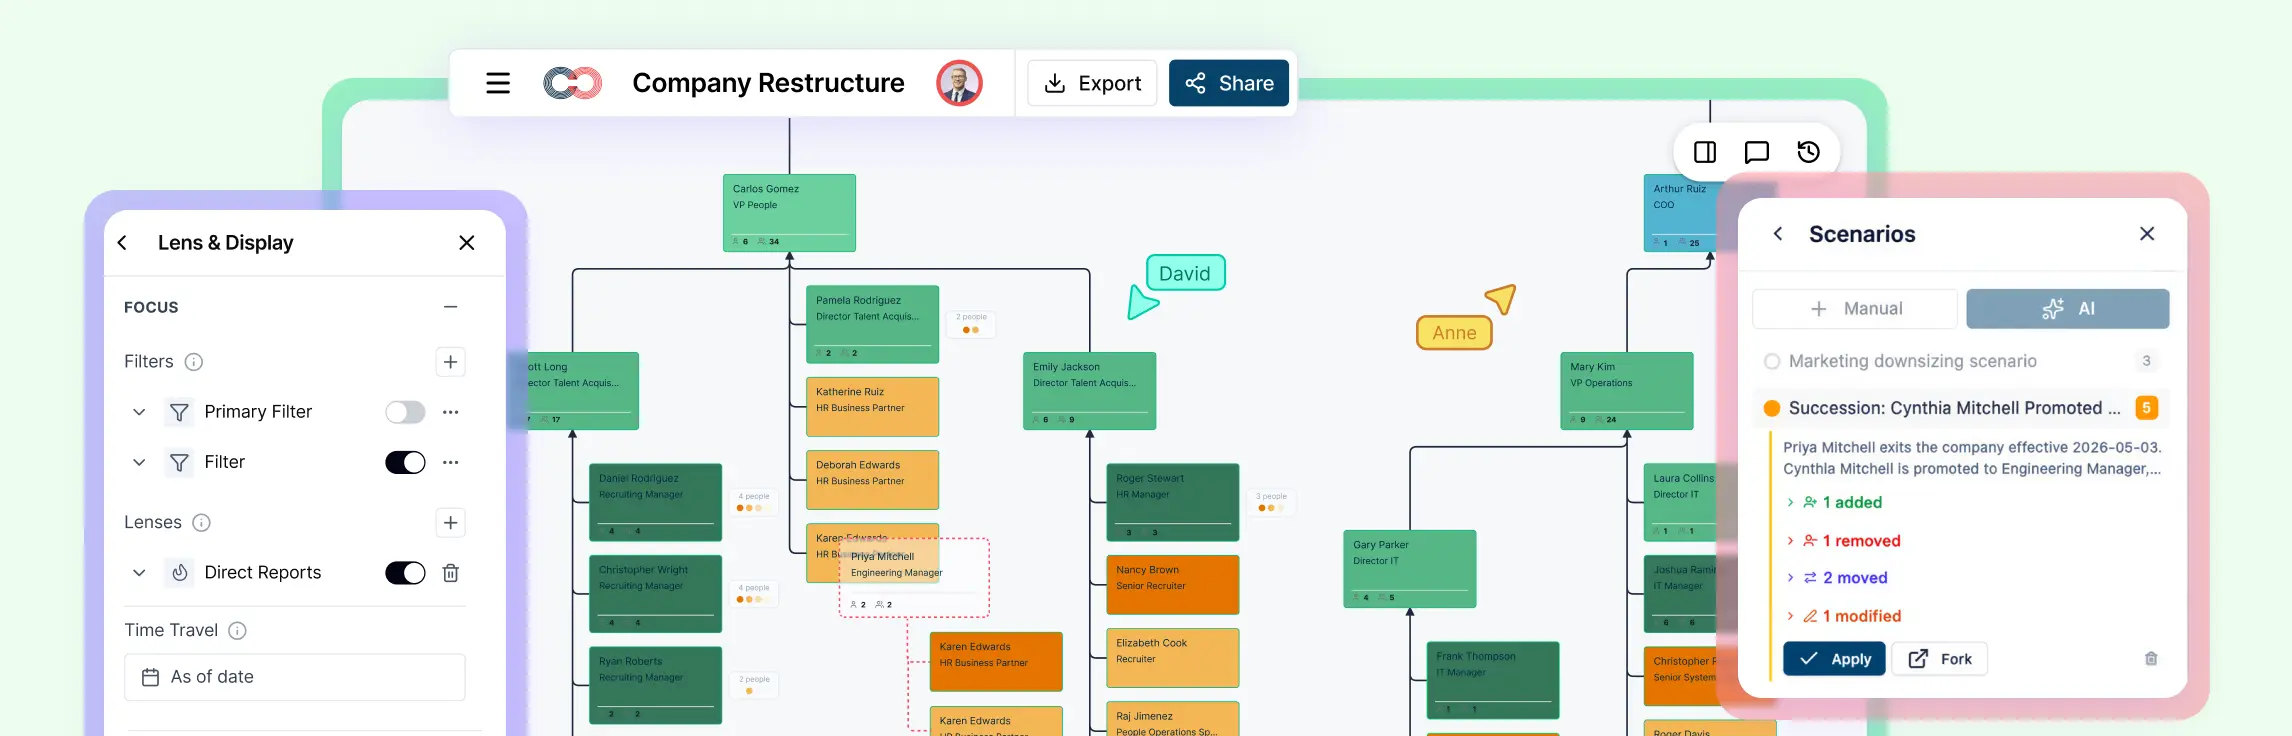
How to do it in Creately
This is one of Creately’s strongest use cases for restructuring.
You can:
- create named scenario overlays instead of editing the live org chart directly
- model several restructuring options at the same time
- test reporting-line changes, team moves, new roles, removals, and department merges safely
- compare options before deciding which structure to apply
- keep the live org untouched until the team is aligned on the best direction
Step 6. Compare each option against clear decision criteria
Once you have a few future-state org charts, compare them using the same criteria so you can choose the structure that best supports the business.
Review each option based on:
- clarity of accountability
- span of control
- speed of decision-making
- team coordination
- cost and headcount impact
- scalability
- leadership capacity
- employee experience
How to do it in Creately
Creately helps make scenario comparison more structured and evidence-based.
You can:
- compare scenarios using delta-based tracking that records the original and proposed state
- review moves, additions, removals, and updates clearly
- use workforce, department, compensation, and succession field packs to assess structural impact
- evaluate headcount, vacancy rate, cost per headcount, worker type, bench strength, and readiness
- use AI queries and filters to explore how each option affects different parts of the organization
Step 7. Create a transition-state and a future-state org chart
Many restructures fail because teams focus only on the end state and not on how to get there.
It helps to create:
- a transition-state org chart showing the structure during rollout
- a future-state org chart showing the intended long-term structure
The transition view can include interim reporting lines, phased team moves, temporary leadership coverage, or open roles that will be filled later.
How to do it in Creately
Creately is well suited for phased restructuring planning.
You can:
- use separate scenarios to model interim and final structures
- keep vacant positions visible while the seats are still unfilled
- model reporting relationships over time with valid-from and valid-to intervals
- use time travel to view the org at different stages of the rollout
- show how the structure evolves without losing sight of the final plan
Step 8. Use the org chart to communicate the restructure clearly
Once the structure is finalized, the org chart becomes one of the clearest ways to explain the change.
It can help communicate:
- new reporting lines
- team moves
- leadership changes
- renamed departments
- new management layers
- role ownership
- open or planned positions
How to do it in Creately
Creately helps turn the org chart into a communication tool that is easy to share and present.
You can:
- share read-only views with executives, managers, or employees
- use comments and notes to explain what changed and why
- switch between full and compact card views depending on the audience
- collapse branches to focus attention on the teams being discussed
- export the final org chart as PNG, SVG, PDF, or CSV for meetings, documentation, or follow-up analysis
Step 9. Keep the org chart updated during rollout
A restructuring org chart should stay current as reporting lines shift, vacancies are filled, and interim structures change.
Keeping the chart updated helps teams:
- stay aligned during change
- track implementation progress
- avoid confusion around reporting lines
- support onboarding into the new structure
- maintain a reliable view of the organization
How to do it in Creately
Creately is built for ongoing org chart maintenance, not one-time diagram creation.
You can:
- update roles, reporting lines, and fields in real time
- collaborate with multiple stakeholders on the same chart
- rely on auto-save so changes are never lost
- use undo/redo to quickly fix mistakes
- keep the org chart as a living workspace throughout the restructuring rollout
Free Restructuring Org Chart Templates
Now that you know how to create an org chart for restructuring, here are some ready-to-use templates to get started. Each organizational restructuring plan template is editable online.