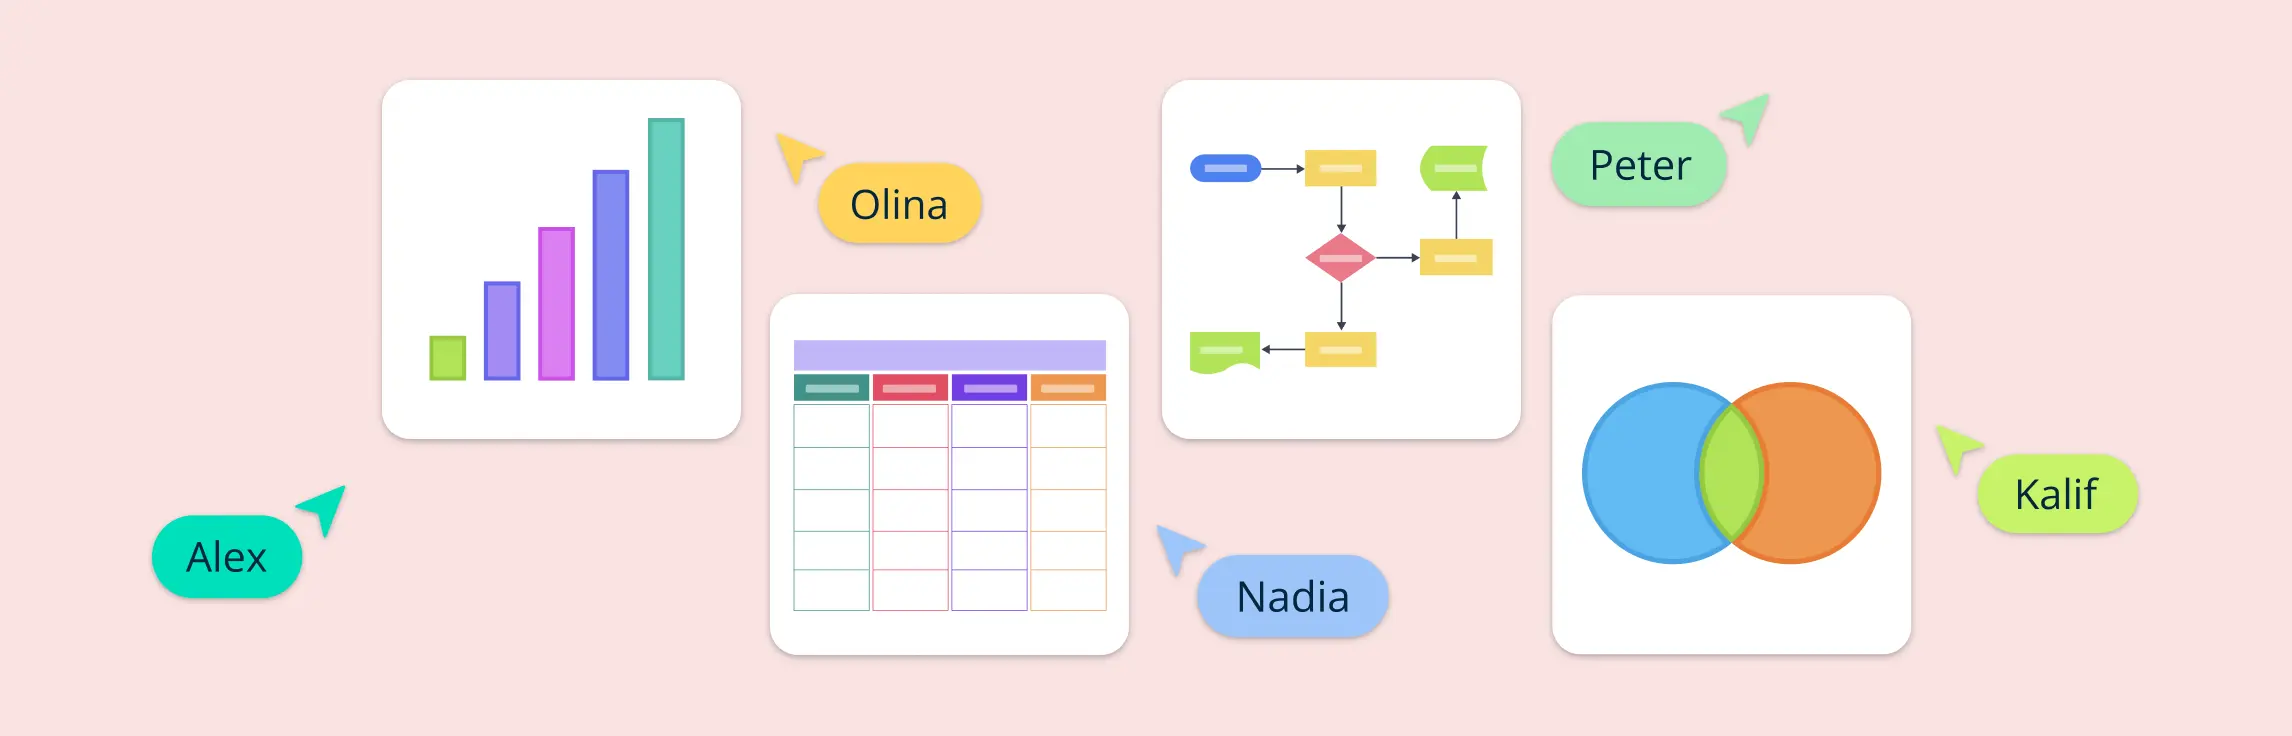
Mathematics can be a challenging subject for many students, and understanding complex concepts often requires a visual approach. Math graphic organizers are powerful tools that help simplify difficult topics, improve understanding, and make problem-solving more efficient. These organizers not only aid in organizing information but also provide a way for students to visualize mathematical relationships, patterns, and solutions. In this article, we will explore 8 essential math graphic organizers that can boost learning, comprehension, and problem-solving skills in mathematics.
A flowchart loop is a fundamental concept in process automation and programming, allowing tasks to repeat based on a defined condition. Whether used in software development, workflow optimization, or decision-making processes, flowchart loops help visualize repetitive actions clearly and efficiently.
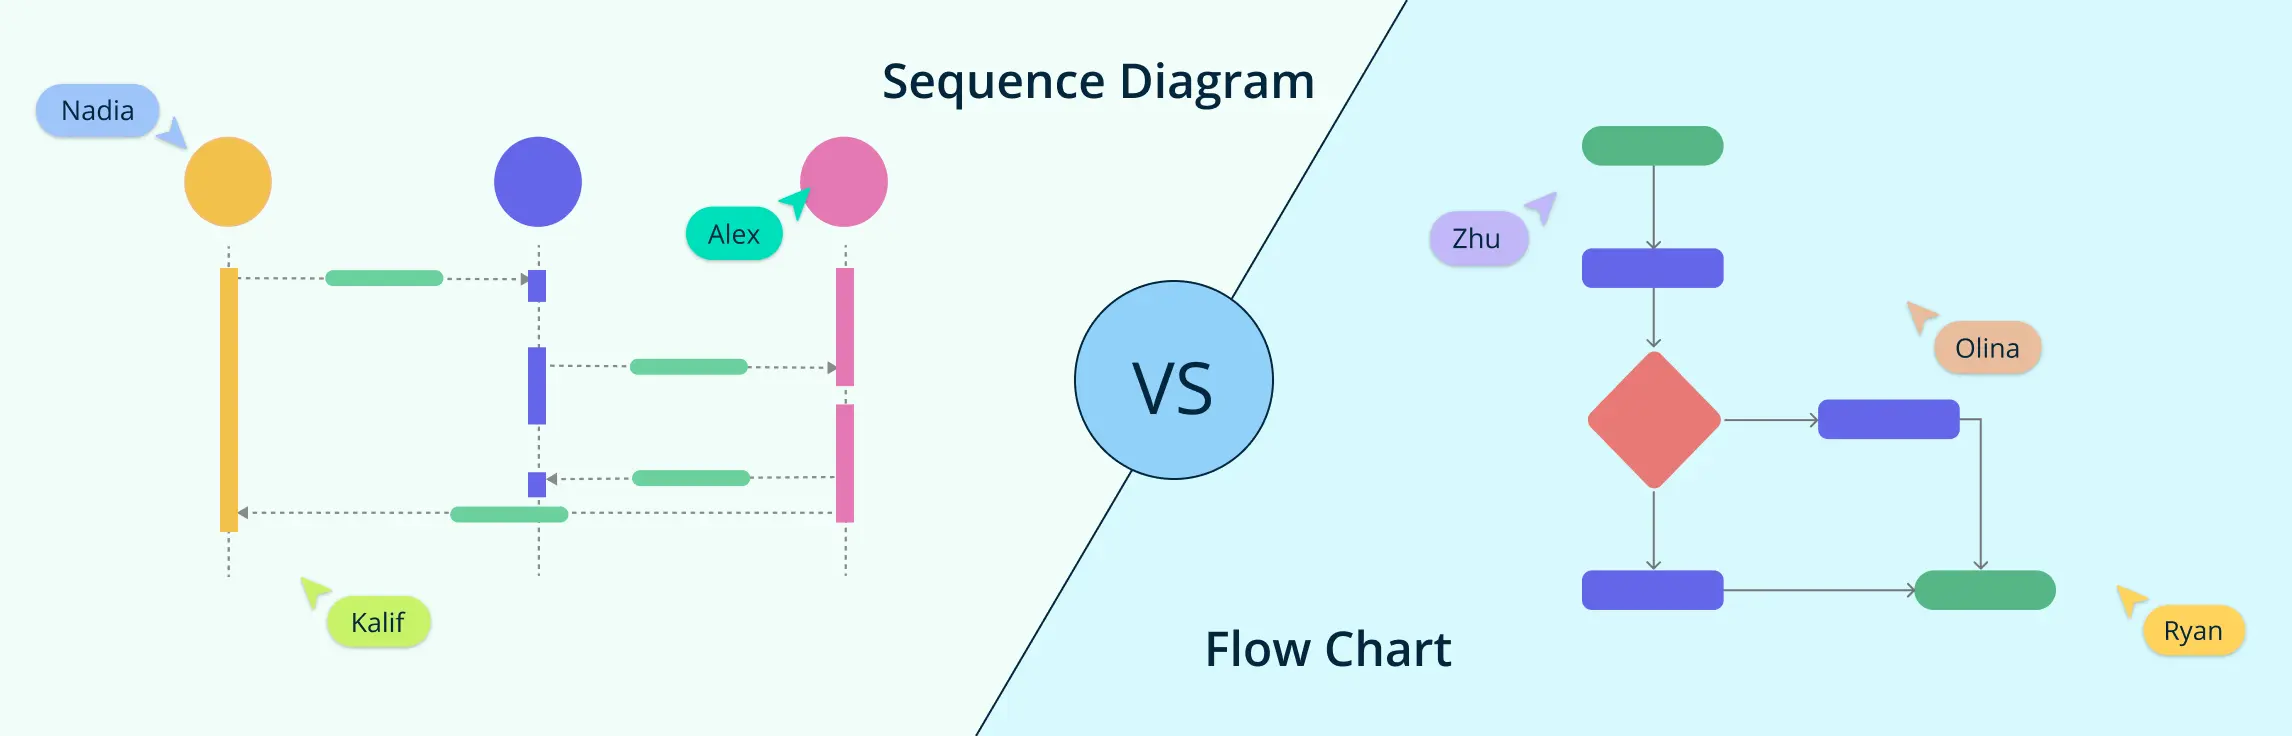
When it comes to visualizing processes and system interactions, two of the most commonly used diagramming methods are flowcharts and sequence diagrams. While both are powerful tools for representing workflows and system behaviors, they serve distinct purposes and follow different structures.
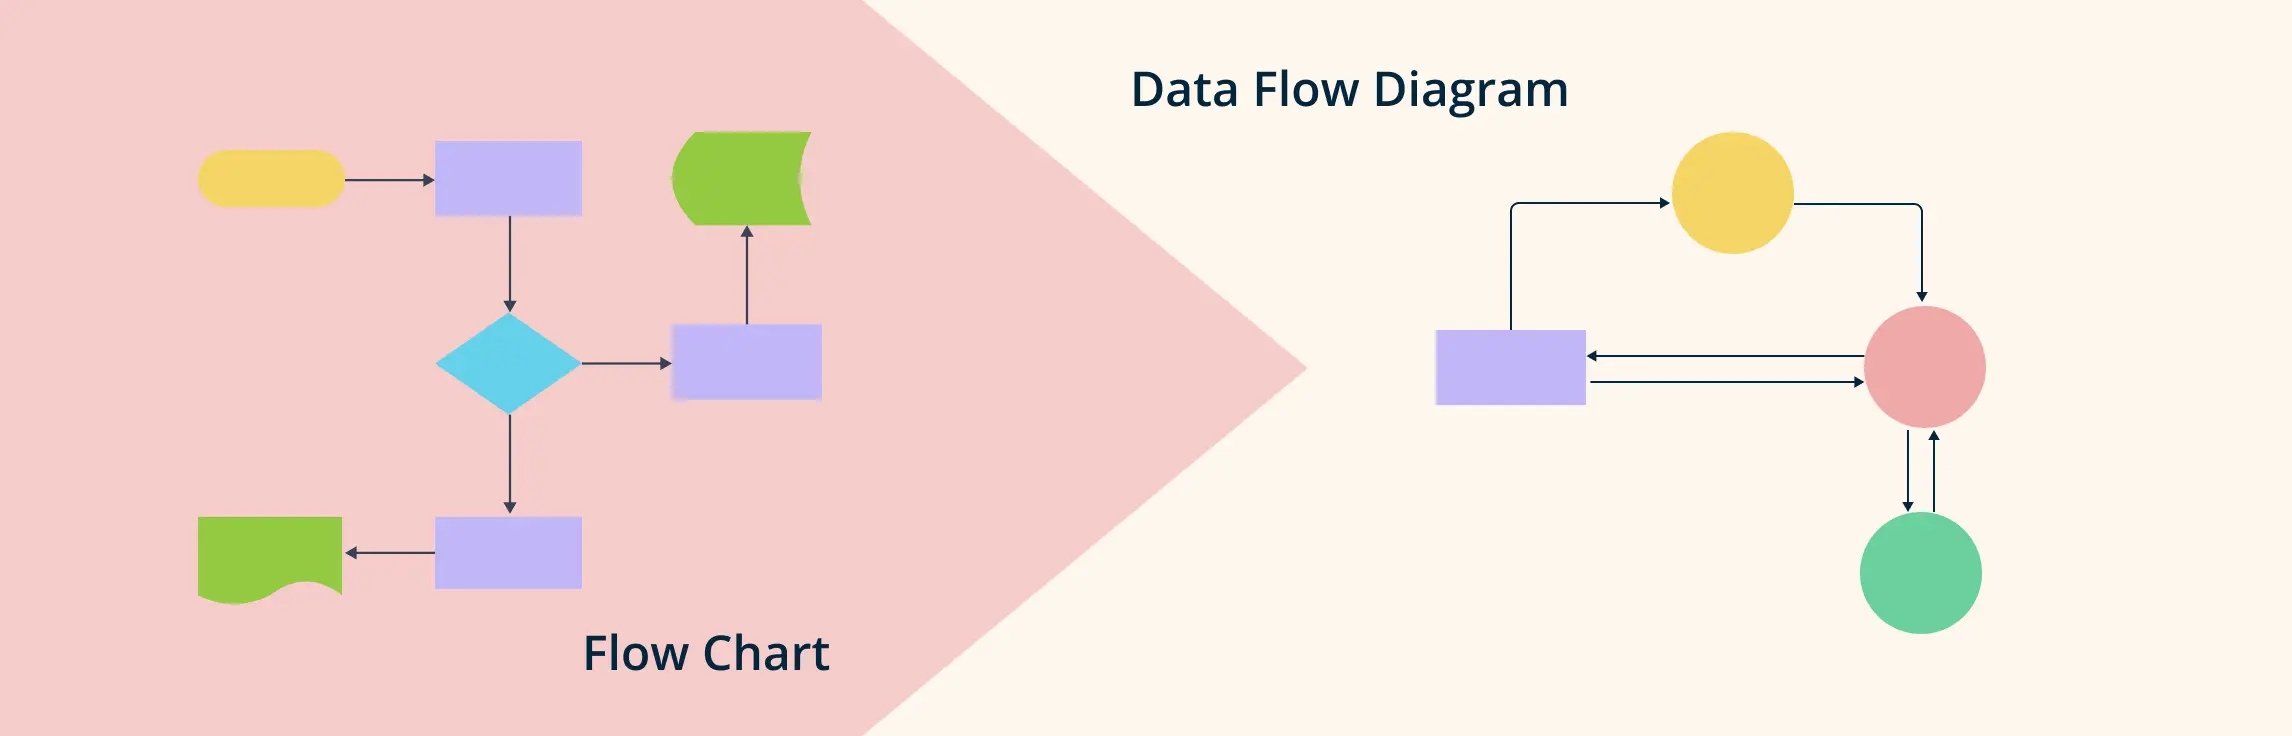
In today’s fast-paced world, visualizing data and processes is essential for clear communication and effective decision-making. Flowcharts and Data Flow Diagrams (DFDs) are powerful tools that help break down complex workflows, making them easier to understand and analyze. Whether you’re looking to map out a business process, analyze a data system, or improve communication within your team, flowcharts and DFDs can simplify the process and enhance collaboration.
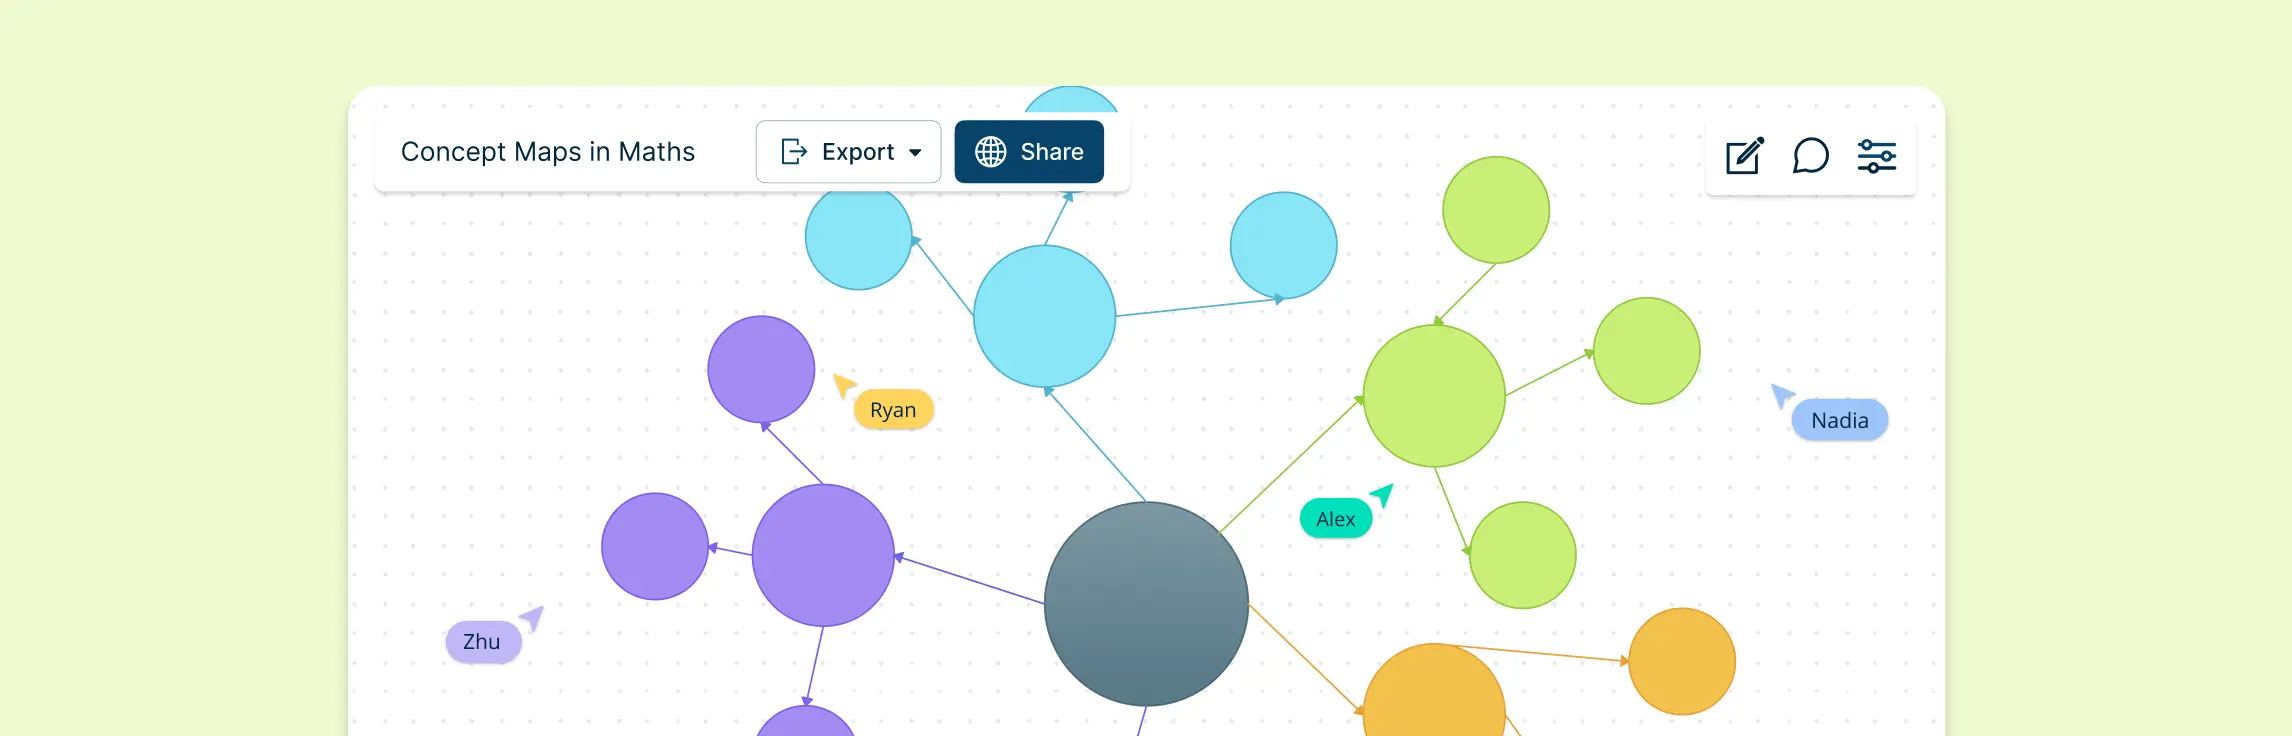
Mathematics can often feel overwhelming due to its abstract concepts, complex formulas, and intricate relationships between ideas. However, one powerful tool can simplify these challenges: concept maps.In this guide, we’ll explore how concept mapping maths can transform the way you learn and teach mathematics, offering step-by-step guidance and real-world examples to help you get started.
Using a concept map for research helps researchers organize and represent ideas, concepts, and their relationships within a research project. In this guide, we will explore how concept mapping in research can simplify the process of visualizing your ideas, enhance your critical thinking, and improve your research outcomes.
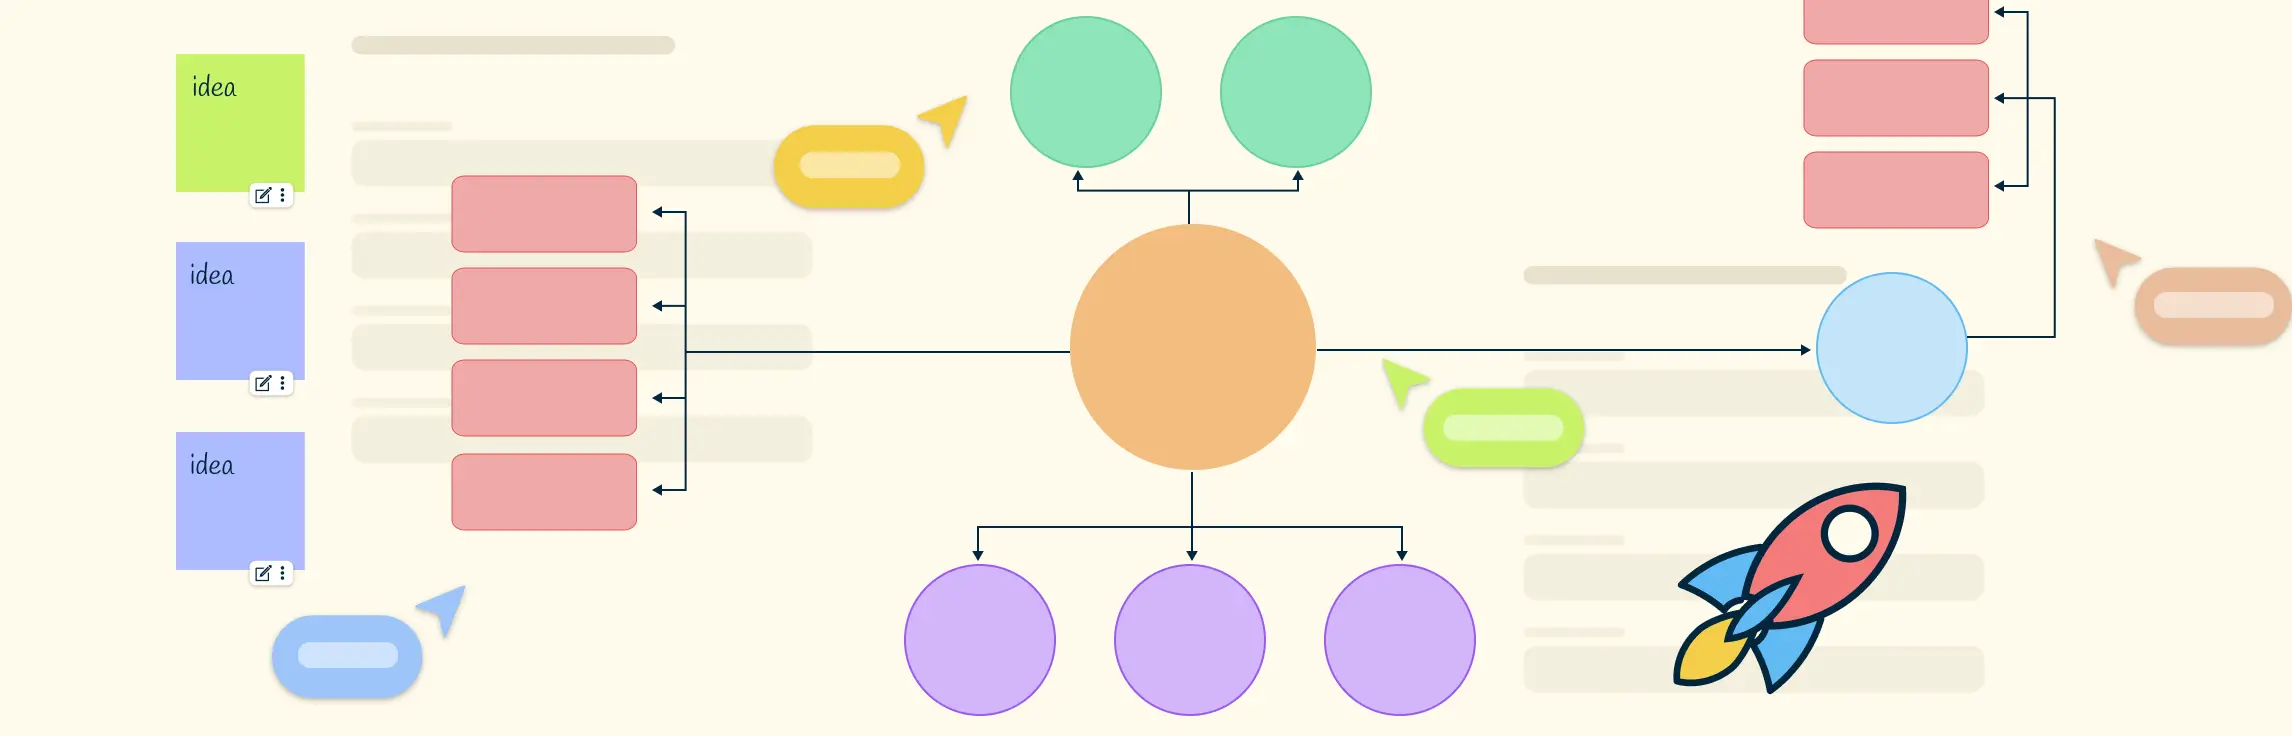
Definition of a Concept Map Concept map is a visual tool used to represent relationships between different concepts. They help organize and structure knowledge in a way that makes connections and hierarchies clear. They contain,
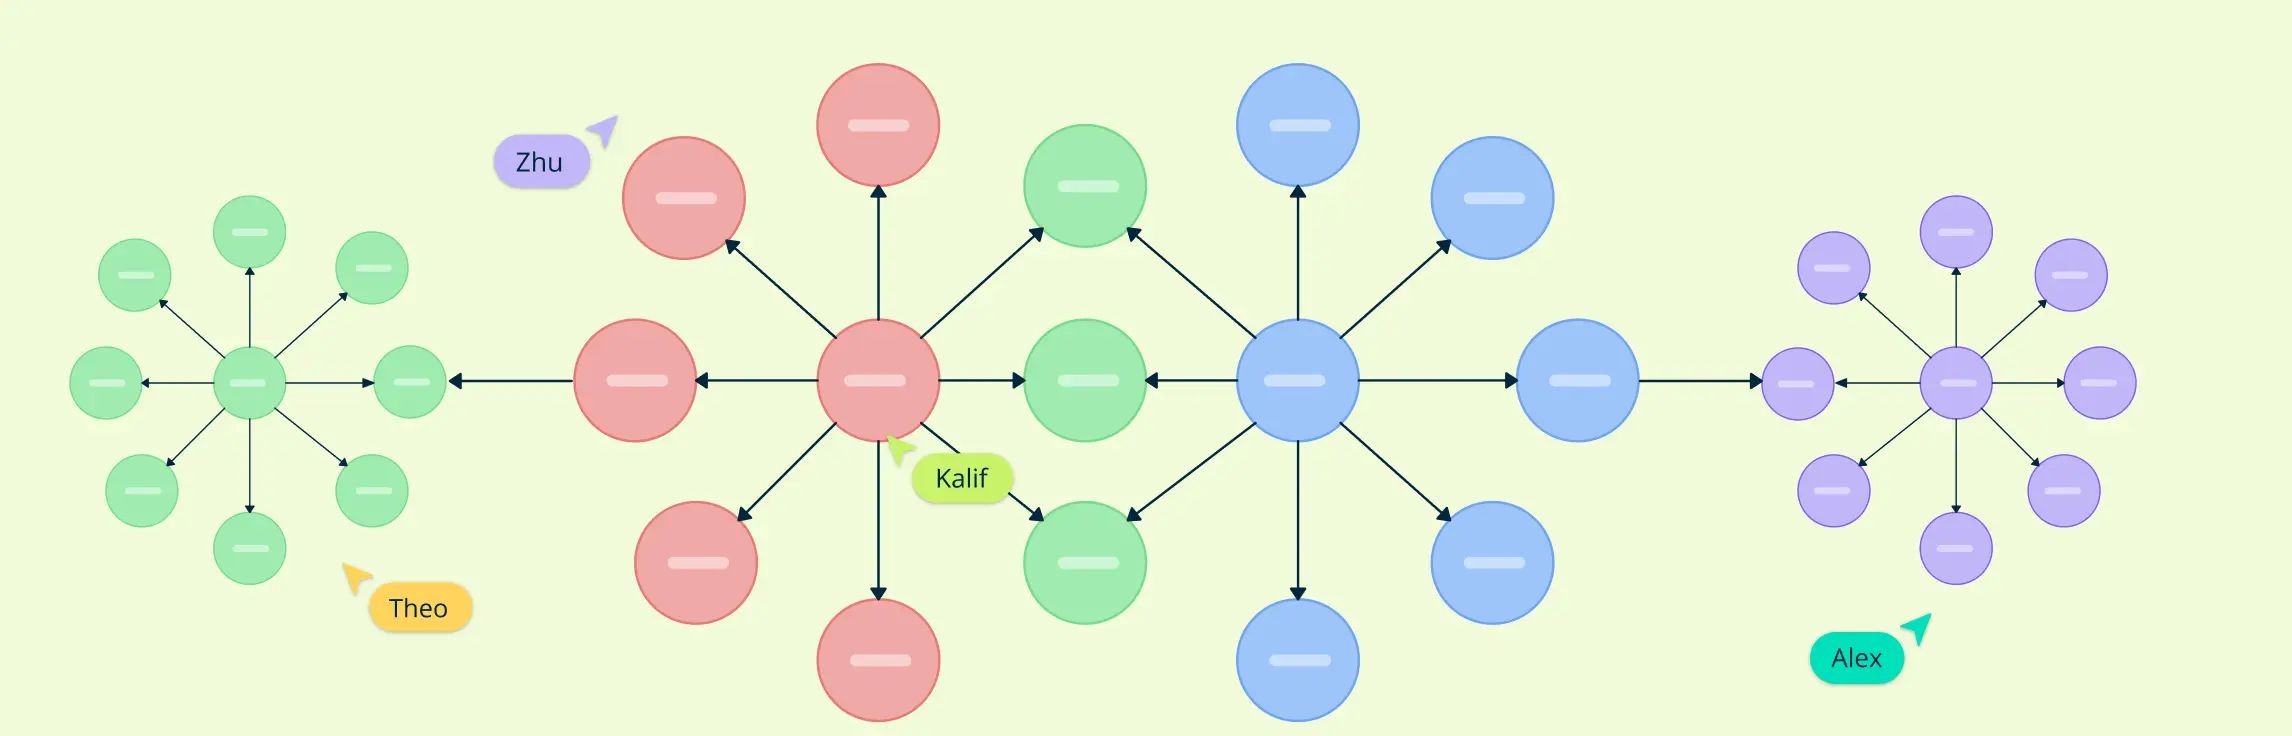
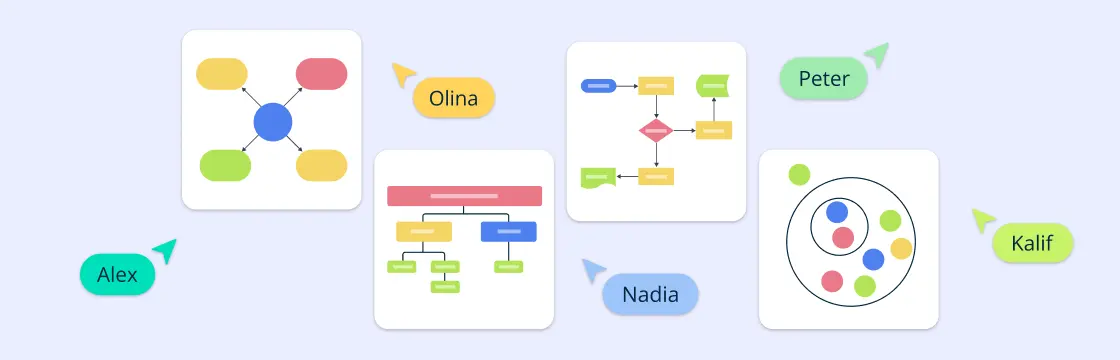
The four main types—Spider Maps, Flowcharts, Hierarchy Maps, and System Maps—serve different purposes, from brainstorming to process mapping. This guide explores their structures, uses, and examples to help you choose the right one for your needs.
When it comes to professional development, using a guiding tool is beneficial as it provides clarity and direction, irrespective of which career stage you are in. This is where career concept maps comes into play. In this blog post, we focus on what a career concept map is and its benefits, while introducing you to ten templates to help you progress in your career
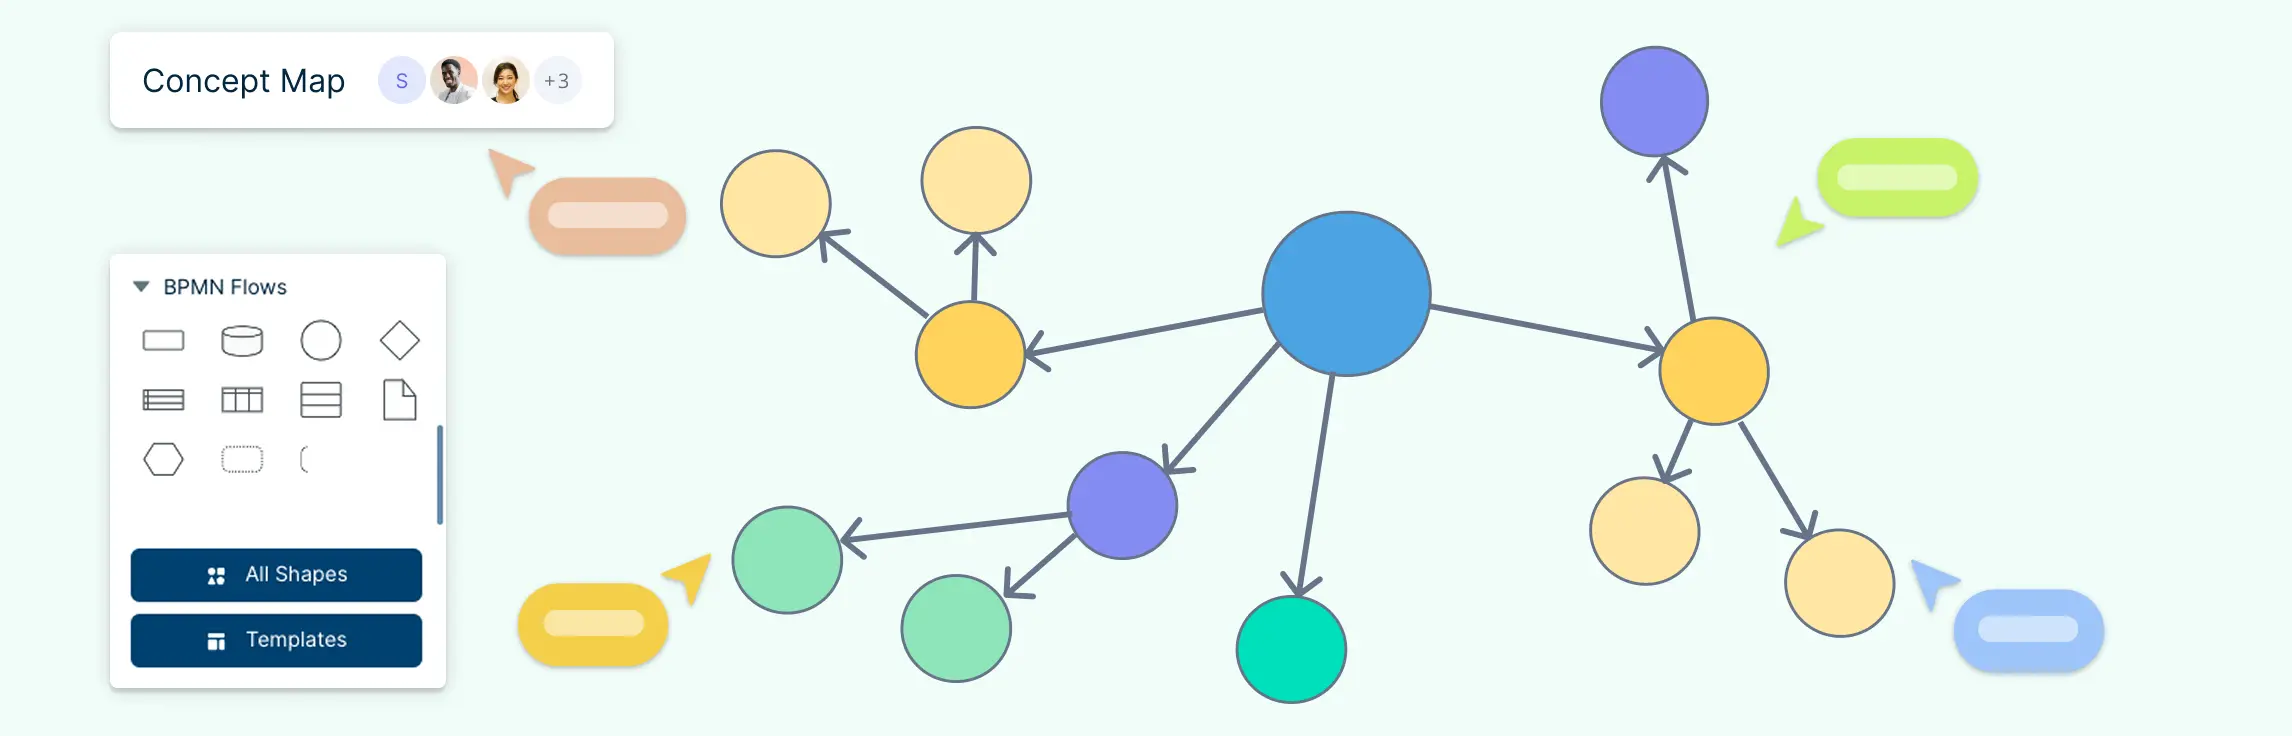
How to Draw a Concept Map? Step 1: Define Your Central Topic The first step in drawing a concept map is to choose your central topic. This could be an idea, question, or concept that you want to explore. Make sure the topic is specific enough to allow for detailed exploration.