Value Stream Mapping Tutorial
This guide explains what value stream mapping is, when to use it, and how to build current-state and future-state maps that reveal waste, bottlenecks, and improvement opportunities. It also covers the sections of a value stream map, the metrics to capture, and practical ways to turn observations into an action plan.
Value Stream Mapping Definition
Value stream mapping (VSM) is a visual method for documenting how work moves from request to delivery. It helps teams see the flow of materials, information, handoffs, delays, and waiting time so they can improve how value reaches the customer.
A value stream map is most useful when you need an end-to-end view of a process instead of isolated local metrics. Rather than optimizing one step at a time, VSM helps teams see where the whole system slows down.
Types of Value Stream Maps
Most teams create two types of value stream maps: a current-state map and a future-state map. The current-state map shows how the work happens today. The future-state map shows how the process should work after waste, bottlenecks, and unnecessary handoffs are reduced.
When to Use Value Stream Mapping
Value stream mapping works best when you want to improve an entire flow rather than one isolated task. Teams commonly use it when they are:
- diagnosing delays, queues, rework, or inventory buildup
- redesigning a production, fulfillment, service, or software delivery process
- aligning cross-functional teams around one shared view of the work
- preparing lean, Six Sigma, or continuous improvement initiatives
- deciding where automation or process standardization will have the biggest impact
Current State Value Stream Map (Current State VSM)
The current state VSM shows the current state or the ‘as-is’ state of the value stream process. It visualizes the existing processes including all steps, activities and information flow, inventory levels, lead times and other useful data. The current state VSM serves as the baseline for comparison with the future state map and helps to identify waste, bottlenecks and areas for improvements.
Future State Value Stream Map (Future State VSM)
The future VSM shows the desired or ‘to-be’ state after implementing the improvements. This includes the optimized process flow, reduced waste, improved cycle times, and other crucial improvements identified. The future state VSM visualizes the target state and helps to convey the vision of the desired process improvements.
Segments of a Value Stream Map
Most value stream maps include three readable layers:
- Production or process flow - The main sequence of work from start to finish, usually drawn left to right.
- Information or communication flow - The signals, requests, schedules, and updates that trigger or coordinate the work.
- Timelines and distance data - Lead time, cycle time, waiting time, and sometimes travel distance, usually shown at the bottom of the map.
Steps to Create a Value Stream Map
The following value stream mapping steps break down the process into clear, manageable stages, from defining the scope and mapping the current state to designing improvements and putting them into action. This will allow you to perform a value stream analysis that’s practical, accurate, and easy to improve over time.
Step 1: Assemble Team and Define Scope
Preparation lays the groundwork for effective value stream mapping. First, assemble a cross-functional team and appoint a value stream manager to guide the effort and set clear guidelines. At this stage, define the scope and objectives of the mapping exercise, anticipate potential challenges, and select the product family to map. Since a product family shares the same process steps, each value stream map should focus on a single product family to avoid unnecessary complexity.
Tip: Use a product or service matrix to identify the families of products or services.
Step 2: Create the Current State Map
Begin by gathering data directly from the real process instead of relying only on documentation or assumptions. Walk the path the product or service follows, sketch the main flow, and capture both the process steps and the information signals that move work forward.
As you observe, collect key data such as:
- available work time and planned downtime
- number of people involved
- throughput and product variation
- cycle time, wait time, and queue time between steps
Once the data is collected, build the map:
- place the customer and supplier on the map and note key requirements
- draw the entry and exit points of the value stream
- add process steps from downstream to upstream and list their main attributes
- insert inventory or queue times using consistent units
- map communication flows and note whether work is pushed or pulled
- add any remaining data needed to explain performance clearly
This sequence can be adapted to match your organization, but the goal stays the same: make the real flow visible enough that waste and delays are hard to ignore.
Step 3: Create the Future State Map
Once the current-state map is complete, use it to design a future state that removes waste and improves flow. The future-state map should reflect specific decisions such as reducing handoffs, lowering inventory, shortening wait times, balancing workloads, or changing the information flow that triggers work.
Step 4: Planning and Implementation
The final step focuses on creating an action plan to implement the future state map. Break the future state design into manageable segments and apply improvements one area at a time, with clear, measurable goals and defined checkpoints. Once implemented, the improved process becomes the new current state, allowing the cycle of continuous improvement to continue.
Tip: Hold an annual value stream review to monitor improvements.
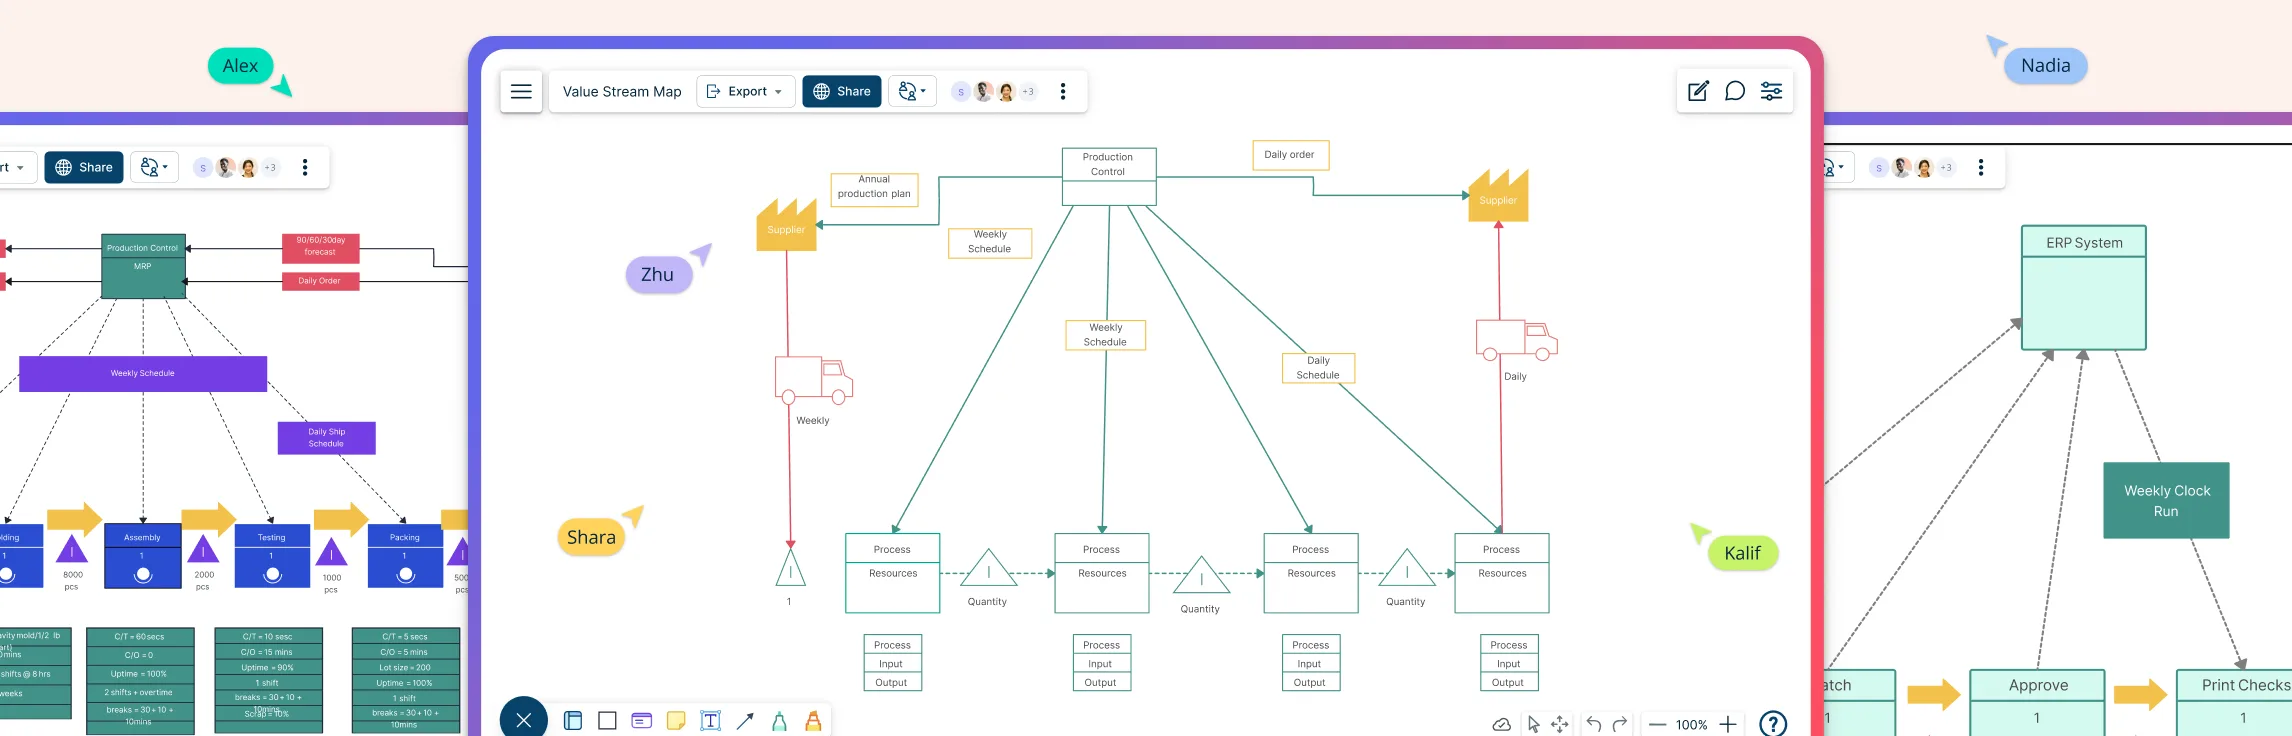
Now that you understand the value stream mapping steps, put them into action with Creately’s value stream mapping software. Build current and future state maps on an infinite canvas using standard VSM symbols, ready-made templates, and real-time collaboration.
Value Stream Mapping Tips and Best Practices
Here are some practical guidelines for creating a VSM that teams can actually use:
- Define the scope clearly: Identify the start and end points, key activities, and information flows so the map stays focused on one value stream.
- Involve cross-functional teams: Include representatives from the functions that actually touch the work so the map reflects reality instead of assumptions.
- Use standard VSM symbols: Apply consistent value stream mapping symbols so the map is easy to read and compare.
- Measure the real process: Capture cycle time, lead time, inventory, wait time, and defect or rework data from the floor or live workflow whenever possible.
- Stay focused on customer value: Distinguish clearly between value-adding work, necessary support work, and waste.
- Connect the map to action: Use the findings to prioritize specific improvements, owners, and review points rather than treating the map as a one-time exercise.
Common Value Stream Mapping Mistakes
Even experienced teams can get less value from VSM if they:
- map only one department instead of the full flow
- build the map from assumptions instead of observation
- collect symbols but skip timing and inventory data
- design a future state that is too ambitious to implement in stages
- stop after the workshop without an action plan or follow-up review
Value Stream Map Templates


More Value Stream Mapping Templates
Frequently Asked Questions About VSM
How do I develop an action plan based on the value stream map findings?
Once you have identified the required improvements from the value stream map, you can develop an action plan to address the areas. Here are some tips to follow:
- The action plan should include specific tasks, timelines and responsible parties.
- Prioritize the tasks based on their potential impact and feasibility.
- Ensure the tasks are SMART.
- Assign accountability for each task.
- Regularly review progress.
How often should I update my value stream map?
What are some common misconceptions about value stream mapping?
- It is only applicable to manufacturing.
- A one-time activity rather than a continuous process.
- Only useful for cost reduction.
- Complex and difficult to implement.
How can I effectively engage my team in the VSM process?
- Clearly communicate the purpose and benefits of the process.
- Involve team members in data collection and analysis.
- Encourage them to provide feedback and input.
- Empower the team members to identify improvement opportunities.
- Provide training and support on value stream mapping principles and tools.
Can VSM be applied in non-manufacturing or service industries?
What are the benefits of value stream mapping?
What are common value stream mapping mistakes to avoid?
Resources
Dinis-Carvalho, Jose, et al. “Waste Identification Diagram and Value Stream Mapping.” International Journal of Lean Six Sigma, vol. 10, no. 3, 16 Aug. 2019, pp. 767–783, https://doi.org/10.1108/ijlss-04-2017-0030.
Mojib Zahraee, Seyed, et al. “Lean Manufacturing Implementation through Value Stream Mapping: A Case Study.” Jurnal Teknologi, vol. 68, no. 3, 1 May 2014, https://doi.org/10.11113/jt.v68.2957.