Value stream mapping (VSM) is a lean management technique that visualizes the flow of materials, information, and tasks through a process, helping teams identify bottlenecks and eliminate waste. These value stream mapping examples help you get started faster—allowing you to map current and future states, track key metrics like lead time and cycle time, and collaborate with your team in a shared workspace. In Creately, you can quickly customize each template, add notes or data where needed, and iterate as your process evolves—without slowing down the analysis.
Examples of Value Stream Maps
These value stream mapping templates are built using standard VSM symbols, so you can map your processes the way lean teams actually do. If you find a template that fits your use case, just click to open it in Creately’s value stream mapping tool. From there, you can customize the examples of value stream mapping, add your own data, and adapt it to your current or future state. When you’re done, export it as a PDF or image (PNG, JPEG, and more) to share with your team or include in reports.
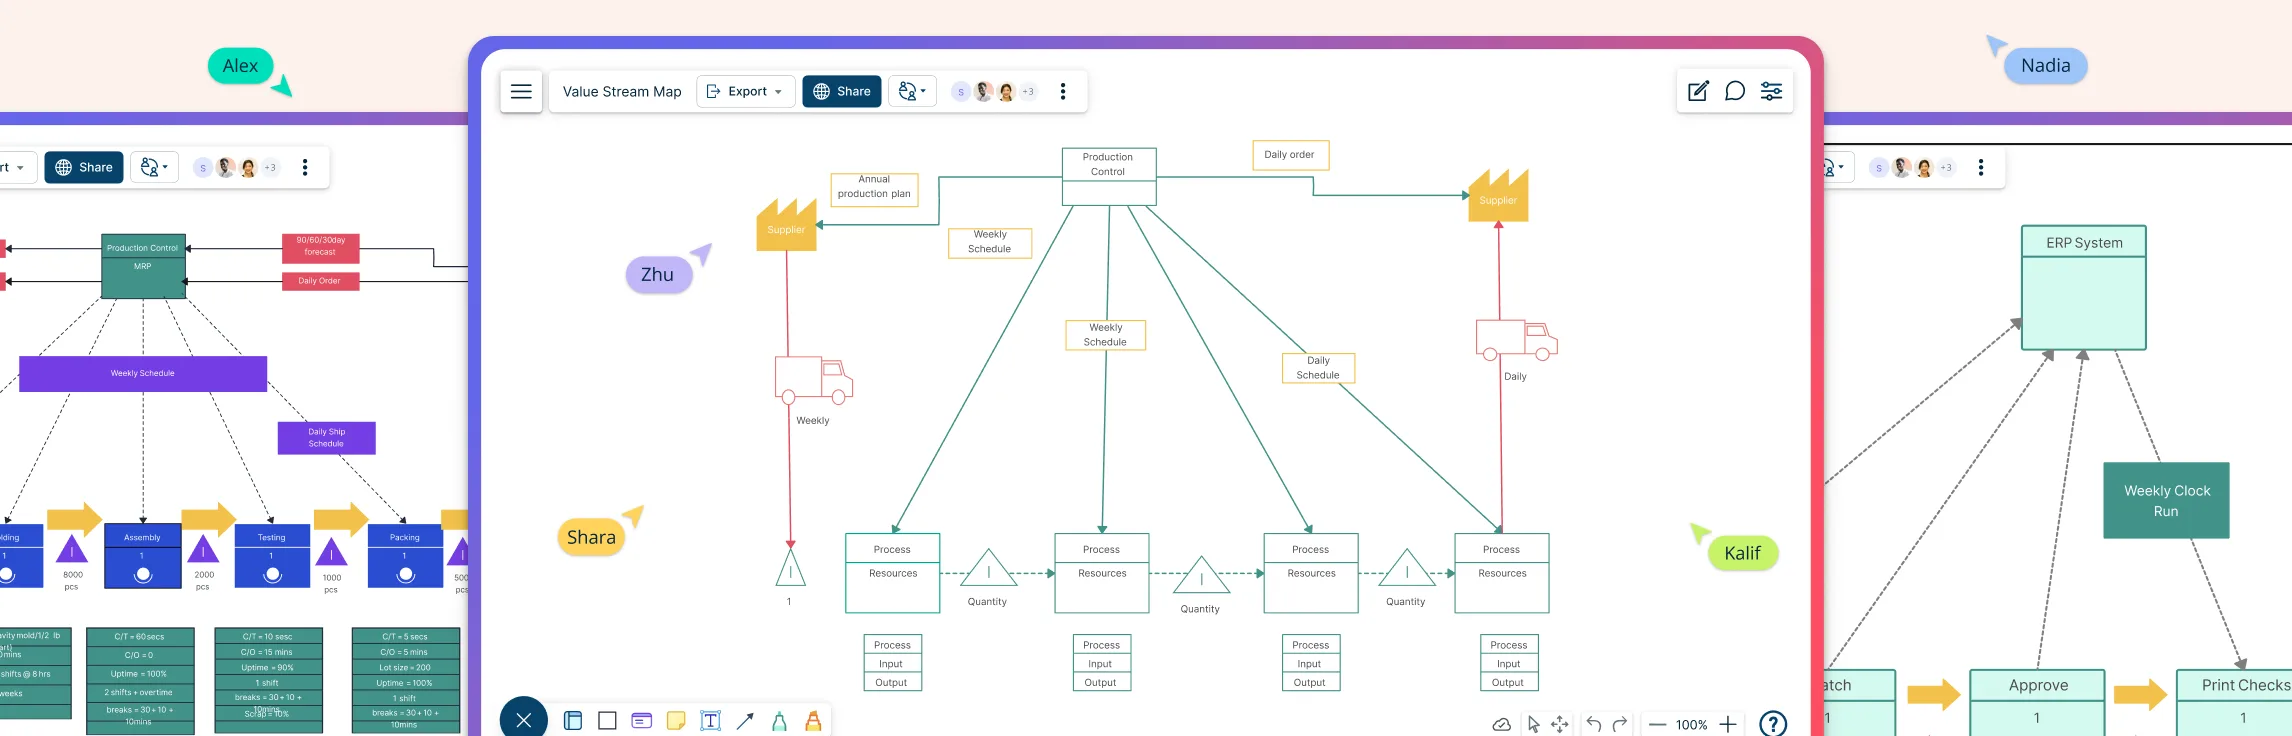
1. Production Control Value Stream Map
This value stream mapping example shows how materials and information flow from suppliers to customers. Use it to spot delays, bottlenecks, and improvement opportunities—click to customize it in Creately.


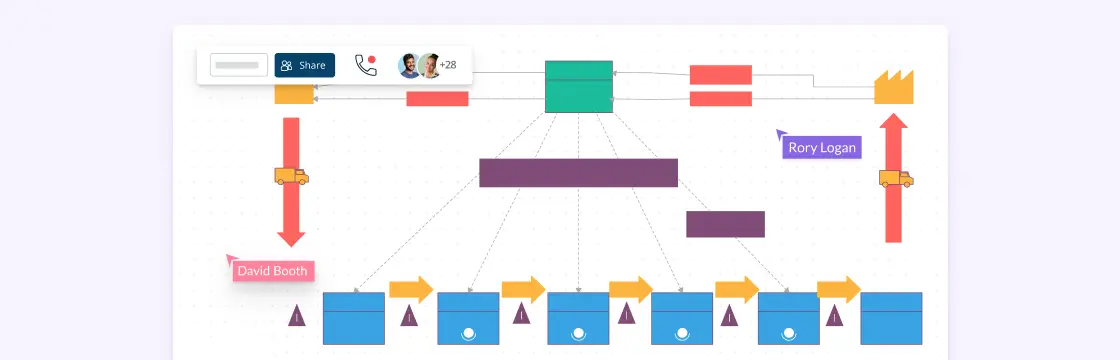
2. Current State Value Stream Map
This current state value stream map example is that of the Toyota model production system. A current state map that helps identify the bottlenecks and inefficiencies in the current system, serves as the foundation for the future state map. Click the template to edit it online.

3. Value Stream Map for Software Development Process
This value stream mapping example helps visualize the software development process, from requirements to the final product. Use it to spot inefficiencies, improve flow, and maximize value.

4. Funnel Shaped Value Stream Model
This value stream mapping example uses a funnel-shaped model to handle large incoming volumes and fast initial processing. It helps visualize flow, identify bottlenecks, and improve throughput.

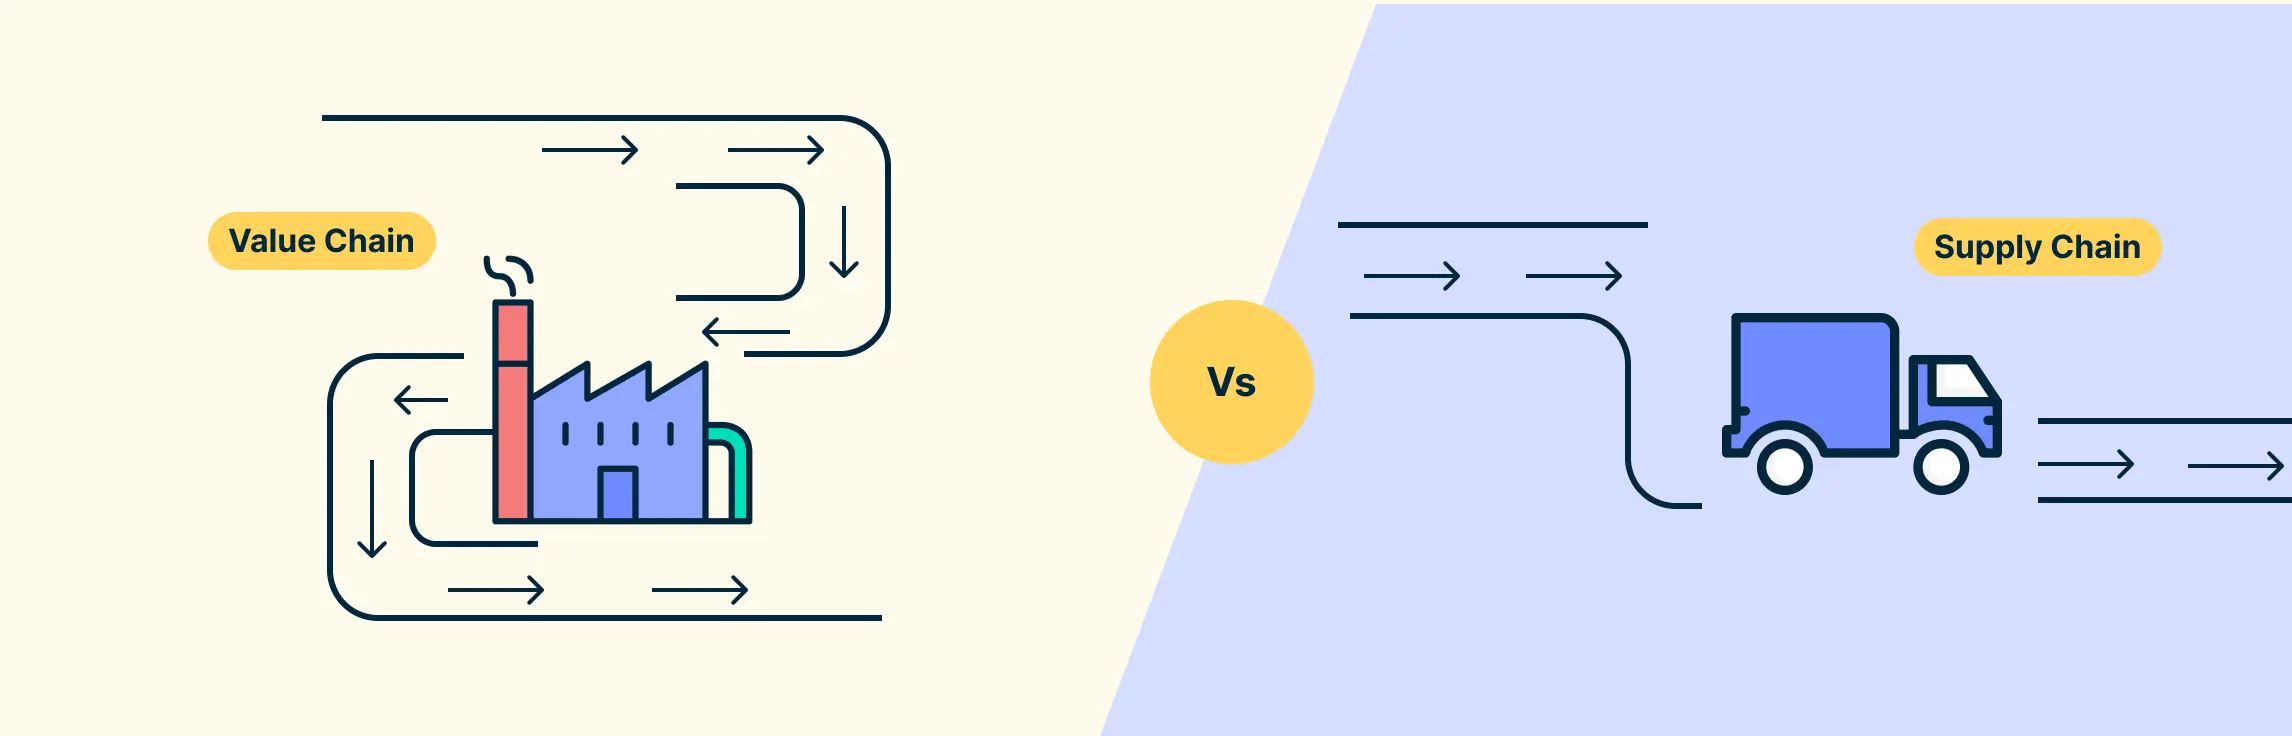
5. Value Stream Map for Supply Chain Management
This example helps visualize the flow of materials, information, and processes across the supply chain. Use it to spot inefficiencies, delays, and improvement opportunities.

6. Pyramid Shaped Value Stream Map
This VSM example uses a pyramid-shaped model, ideal when incoming materials or orders are slow but outputs are large. It helps visualize flow, spot bottlenecks, and optimize throughput.

7. Value Stream Map for Data Management
This value stream map example illustrates a simplified data management system, helping you visualize data flow, identify bottlenecks, and streamline processes.

8. Future State Value Stream Map
This example shows the ideal future state of a process. Use it to visualize improvements, eliminate waste, and design a more efficient workflow based on insights from your current state map.

9. Pipe Shaped Value Stream Map
This example uses a pipe-shaped model, ideal for processes that are already streamlined. It helps visualize flow, maintain efficiency, and identify remaining improvement opportunities.

10. Process Cartoon Value Stream Map
A common style for mapping value streams, sometimes called a Learning to See map or Process Cartoon, this example simplifies complex workflows. It makes it easy to visualize processes, spot bottlenecks, and communicate improvements across your team.