In the study of biological diversity and evolution, diagrams play an essential role in visualizing relationships among various species. Two primary types of diagrams used for this purpose are cladograms and phylogenetic trees. While they may appear similar, understanding their distinctions is crucial for accurate interpretation.
What is a Cladogram?
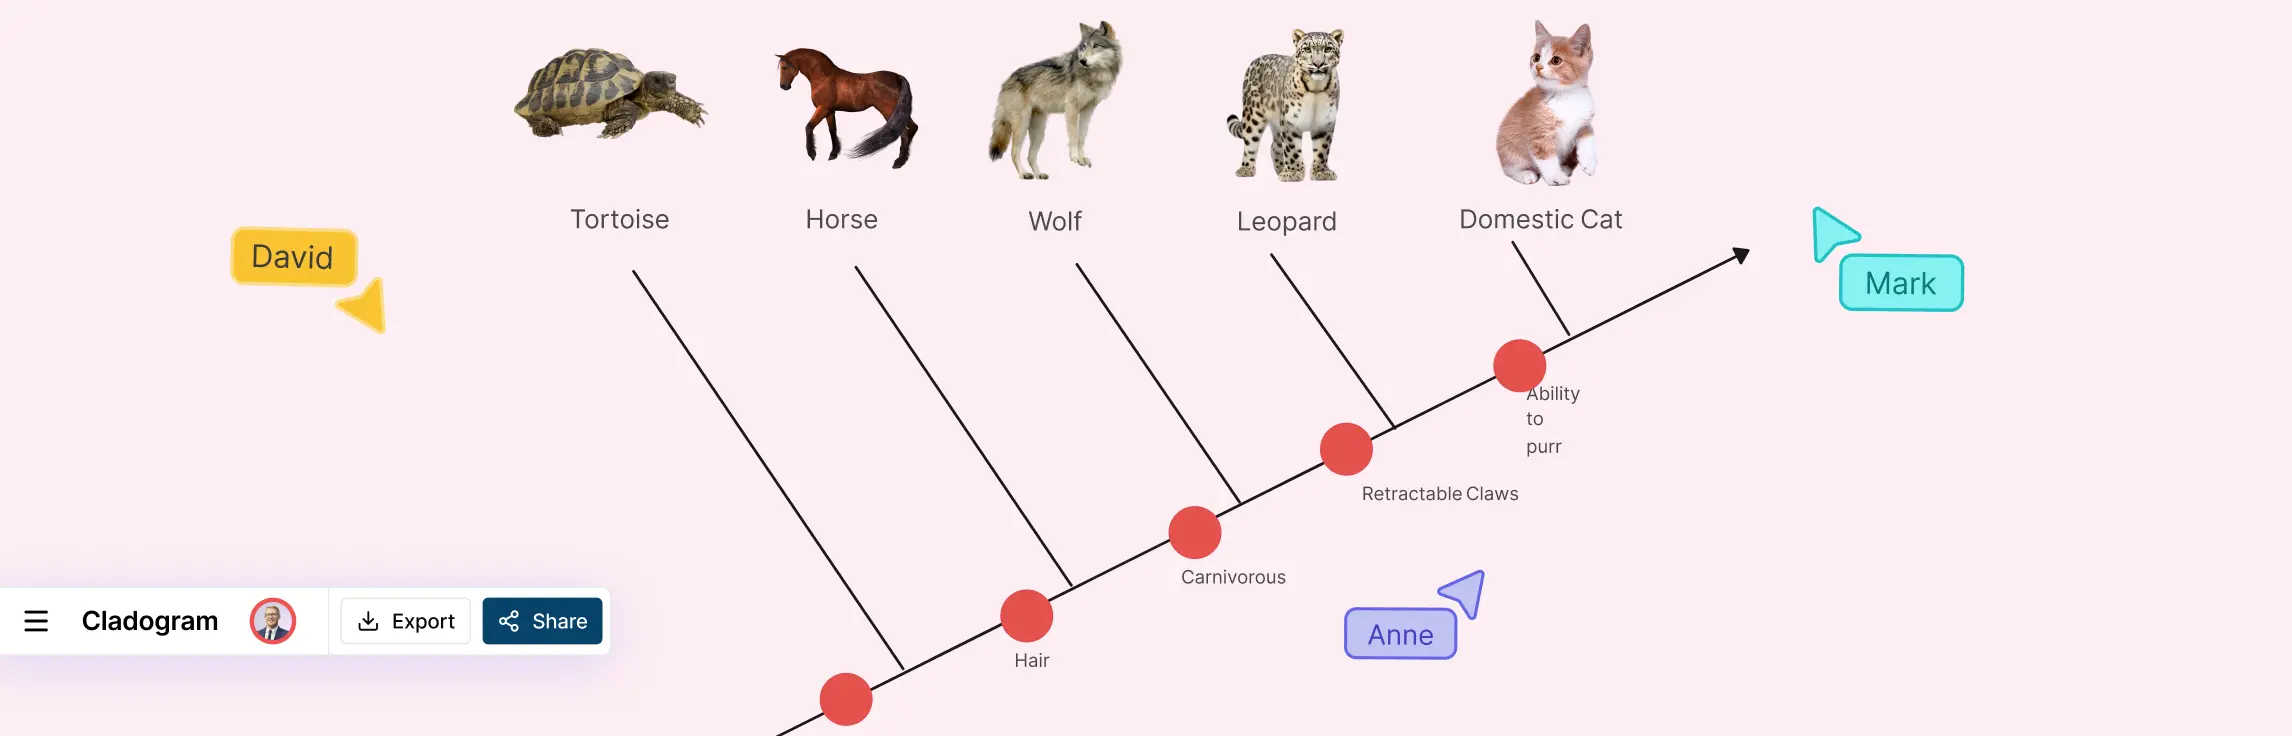
A cladogram is a branching diagram used to illustrate hypothetical relationships among various biological species based on shared characteristics. Unlike phylogenetic trees, cladograms do not indicate evolutionary time or genetic distance between groups. Instead, they focus on the sequence of branching, which represents a relative order of divergence.
Cladograms are particularly useful for identifying shared traits and hypothesized evolutionary paths. For example, a cladogram maker can help demonstrate the shared characteristics between species, emphasizing their common lineage without specifying timelines.


What is a Phylogenetic Tree?
Phylogenetic trees, on the other hand, are more detailed diagrams that showcase evolutionary relationships along with the passage of time and genetic distance. Each branch of a phylogenetic tree represents a lineage, and the points where branches intersect, called nodes, represent common ancestors. The length of the branches can provide information on the amount of evolutionary change or time elapsed. A Phylogenetic tree maker helps to visualise phylogenetic trees.
Phylogenetic trees are grounded in diverse data sources, including genetic information, which allows for a more accurate depiction of the evolutionary timeline. These trees can represent various shapes but convey the same information regarding species relationships.

Historical Context and Development
The development of cladograms and phylogenetic trees can be traced back to the 19th century, with advancements in genetics and computational biology fueling ongoing evolution of these tools. Charles Darwin’s theory of evolution laid the foundation, while modern advancements allow for a more detailed and accurate representation of species relationships.
Understanding these diagrams helps not only in studying evolutionary biology but also in practical applications, such as identifying disease pathways and conserving endangered species. Using platforms like Creately, users can create and visualize these diagrams intuitively. Creately’s visual collaboration and diagramming capabilities streamline the process from ideation to execution, making it easier for researchers, educators, and students to understand and communicate complex evolutionary relationships.
Components of Cladogram Vs. Phylogenetic Tree
Understanding the key components of cladograms and phylogenetic trees is crucial for accurately interpreting these diagrams and uncovering the evolutionary relationships they convey. In this section, we’ll delve into important elements such as branches, nodes, basal taxa, and polytomy.
Branch, Node, and Basal Taxon
Branches: In cladograms and phylogenetic trees, branches are the lines that extend from a common ancestor or a node to represent the evolutionary lineage of a species or group of species. Each branch can be visualized as a pathway that showcases how different taxa are related through various evolutionary events.
Nodes: Nodes, or branch points, are critical components as they signify the divergence of two species from their most recent common ancestor. They act as intersections where lineages split and indicate evolutionary relationships among the species.
Basal Taxon: A basal taxon refers to a lineage that diverges early from the root of the tree and doesn’t branch off again. This component offers insights into the early stages of evolutionary history and helps illustrate the primitive characteristics of ancestral species.

| Feature | Cladograms | Phylogenetic Trees |
| Purpose | Primarily used to show the relationships between species based on shared characteristics. | Used to show evolutionary relationships and the amount of evolutionary change over time. |
| Branches | Represent evolutionary lineages but do not show the amount of evolutionary change. | Represent evolutionary lineages and can show the amount of change. |
| Branch Length | Not scaled to represent time or genetic distance. | Often scaled to represent time or genetic distance, providing more information about the evolutionary process. |
| Nodes | Represent common ancestors of the descendant taxa (species or groups of species). | Represent common ancestors, and the length of the branches can indicate the time or number of changes since divergence. |
| Shape | Can be unscaled, meaning the branch lengths are arbitrary and used purely to depict the order of divergence. | Can be rooted (with a single ancestral lineage at the base) or unrooted (without a clear point of common ancestry). |
Polytomy and its Significance
Polytomy: In some phylogenetic trees, you might encounter a branch that splits into more than two species simultaneously. This phenomenon is known as a polytomy and typically arises when there is insufficient information to determine the order of branching events precisely. Polytomies highlight the limits of our current knowledge and emphasize the need for additional research to clarify evolutionary relationships.
Resolves Uncertainties: Polytomies play an essential role in representing areas of uncertainty within phylogenetic analyses.
Guides Future Research: They direct efforts towards gathering more data to refine and resolve ambiguities in evolutionary relationships.
Key Differences Between Cladogram vs Phylogenetic Tree
Understanding the distinctions between cladograms and phylogenetic trees is crucial for anyone diving into the realm of evolutionary biology. Though similar in appearance, these diagrams serve different purposes and provide varying depth of information about the relationships among species. This section will cover key differences, providing clarity on their unique features, nodes and branches, as well as the concept of rooted and unrooted trees.
Evolutionary Time and Distance
One of the most significant differences between cladograms and phylogenetic trees is how they deal with evolutionary time and distance. Cladograms primarily depict relationships between species without indicating any evolutionary time or distance. They are useful for visualizing hypothetical relationships which help in understanding how different species might be related based on shared characteristics. On the other hand, phylogenetic trees not only show these relationships but also provide information on the evolutionary distances and time spans between branching points. This makes phylogenetic trees a more detailed tool, as they can depict the rate of evolution and time scale based on genetic data.
Understanding Nodes and Branches
Nodes and branching points are integral elements in both cladograms and phylogenetic trees, each carrying significant meaning. Nodes, often referred to as branch points, represent common ancestors in both diagrams. They are like the junctions from which different lineages split and diverge. However, in a phylogenetic tree, nodes are usually accompanied by a timeline, offering a temporal perspective on when these divergences occurred.
Branches in both diagrams signify lineages. In cladograms, the branches show the relative relationships without measuring evolutionary distance. But in phylogenetic trees, the length of the branches can indicate evolutionary change or time span. This feature allows phylogenetic trees to offer more detailed insights into the lineage’s evolution.
Rooted vs Unrooted Phylogenetic Trees
Another key difference lies in rooted versus unrooted phylogenetic trees. A rooted phylogenetic tree includes a common ancestor for all the presented taxa, providing a ground baseline that sets the evolutionary sequence. This rootedness is crucial for understanding the entirety of the evolutionary pathway as it shows not only divergence but also ancestral lineage. Conversely, an unrooted phylogenetic tree does not show a common ancestor and focuses only on the relationships between the taxa, lacking an evolutionary timeline or ancestral commonality.
Using Creately, a visual collaboration and diagramming platform, can significantly enhance your understanding and creation of these diagrams. Creately’s support for data-integrated diagramming and visualization makes it an invaluable tool for constructing and interpreting both cladograms and phylogenetic trees, from adding nuanced details like evolutionary time spans to simplifying complex relationships visually. Creately’s platform aids in effortlessly bridging the gap between theoretical concepts and practical application, making it easier to visualize and analyze evolutionary relationships.
| Feature | Cladogram | Phylogenetic Tree |
| Indicates Evolutionary Time | No | Yes |
| Shows Relative Relationships | Yes | Yes |
| Branches with Temporal Information | No | Yes |
| Rooted Common Ancestor | N/A | Sometimes |
| Used for Hypothetical Relationships | Yes | No |
Understanding these key differences will allow you to select the appropriate diagram based on the level of detail required and the specific relationships you aim to study. Whether you’re a biology student, educator, or researcher, utilizing tools like Creately can make creating and interpreting these diagrams a more streamlined and sophisticated process.
Types of Data Used for Constructing Cladogram vs Phylogenetic Tree
| Feature | Cladograms | Phylogenetic Trees |
| Type of Data | Morphological data, genetic data, or molecular data | Genetic sequences (DNA, RNA), protein sequences, morphological data |
| Focus of Data | Shared derived characteristics (synapomorphies) | Both shared characteristics and evolutionary distances |
| Data Analysis | Parsimony methods (minimal evolutionary changes) | Distance-based methods (e.g., Neighbor-Joining), maximum likelihood, Bayesian inference |
| Complexity of Data | Simpler, focusing on presence/absence of traits | More complex, involving exact sequence differences, mutation rates, and evolutionary models |
| Example Data Sources | Observable traits (e.g., number of limbs, leaf shape), presence of specific genes | Genetic sequences from genomic databases, fossil record data, molecular clocks |
| Accuracy and Resolution | Generally lower resolution, providing a basic outline of relationships | Higher resolution, providing detailed information on evolutionary timelines and relationships |
Key Differences
Type of Data:
- Cladograms: Can be constructed using a variety of data types including morphological traits, genetic markers, and molecular characteristics.
- Phylogenetic Trees: Primarily constructed using genetic sequences (DNA, RNA) and protein sequences, often incorporating complex models of molecular evolution.
Focus of Data:
- Cladograms: Emphasize shared derived characteristics (synapomorphies) to group organisms.
- Phylogenetic Trees: Consider both shared characteristics and the genetic distance or evolutionary time between organisms.
Data Analysis:
- Cladograms: Often use parsimony methods that aim to find the simplest tree with the fewest evolutionary changes.
- Phylogenetic Trees: Use a variety of methods including distance-based approaches, maximum likelihood, and Bayesian inference to model evolutionary relationships more accurately.
Complexity of Data:
- Cladograms: Simpler data, focusing on the presence or absence of certain traits.
- Phylogenetic Trees: More complex data, including exact genetic sequences and detailed evolutionary models.
Example Data Sources:
- Cladograms: Observable traits such as anatomical features or the presence of specific genetic markers.
- Phylogenetic Trees: Genetic sequences obtained from genomic databases, fossil records, and molecular clock data.
Accuracy and Resolution:
- Cladograms: Provide a general outline of relationships, useful for broad comparisons.
- Phylogenetic Trees: Offer higher resolution and accuracy, providing detailed insights into evolutionary timelines and relationships.
Both cladograms and phylogenetic trees can be built using diverse types of data, including:
Morphological Data: Physical traits such as shape, size, and structural characteristics of organisms.
Molecular Data: Genetic information obtained from DNA sequencing, which provides a detailed view of evolutionary changes at the nucleotide level.
Behavioral Data: Observations of species’ behavior, which can also contribute to understanding evolutionary connections.
Using Creately’s visual collaboration and diagramming capabilities, you can effortlessly incorporate and analyze these varied data types to construct accurate cladograms and phylogenetic trees. Creately’s intuitive platform is designed to enhance your ability to visualize complex data and derive meaningful evolutionary insights from your diagrams.
How to Read and Interpret Cladogram and Phylogenetic Tree
Interpreting Branching Patterns
Understanding how to read cladograms and phylogenetic trees can provide deep insights into evolutionary relationships.

Here are some key guidelines for interpreting these branching patterns:
Identify the Root: In a rooted phylogenetic tree, the root represents the common ancestor of all the taxa in the tree. Recognizing this starting point helps in understanding the evolutionary timeline.
Follow the Branches: Each branch represents a lineage. By following a branch from the root to the tips, you can trace the evolutionary pathway of a species.
Look for Branching Points: Also known as nodes, these points represent the divergence of species from their common ancestors. These divergences reflect significant evolutionary changes.
Identifying Common Ancestors
One of the primary purposes of using cladograms and phylogenetic trees is to identify common ancestors among species.
Here’s how you can do it effectively:
Trace Backwards: By tracing the branches backward from any given point, you reach the node representing their most recent common ancestor.
Evaluate Closest Branches: Species whose branches are connected by recent nodes have a closer evolutionary relationship. The more recent the common node, the more closely related the species.
Use Comparisons: Comparing different sub-branches can help you understand evolutionary relationships among different groups.
Understanding how to use these tools can be simplified by interactive platforms like Creately. Their visual collaboration and diagramming capabilities facilitate the construction and interpretation of these complex diagrams. With support for data-integrated diagramming and visualization, Creately offers a seamless experience from ideation to execution.
Uses of Cladogram and Phylogenetic Tree
Cladogram Example
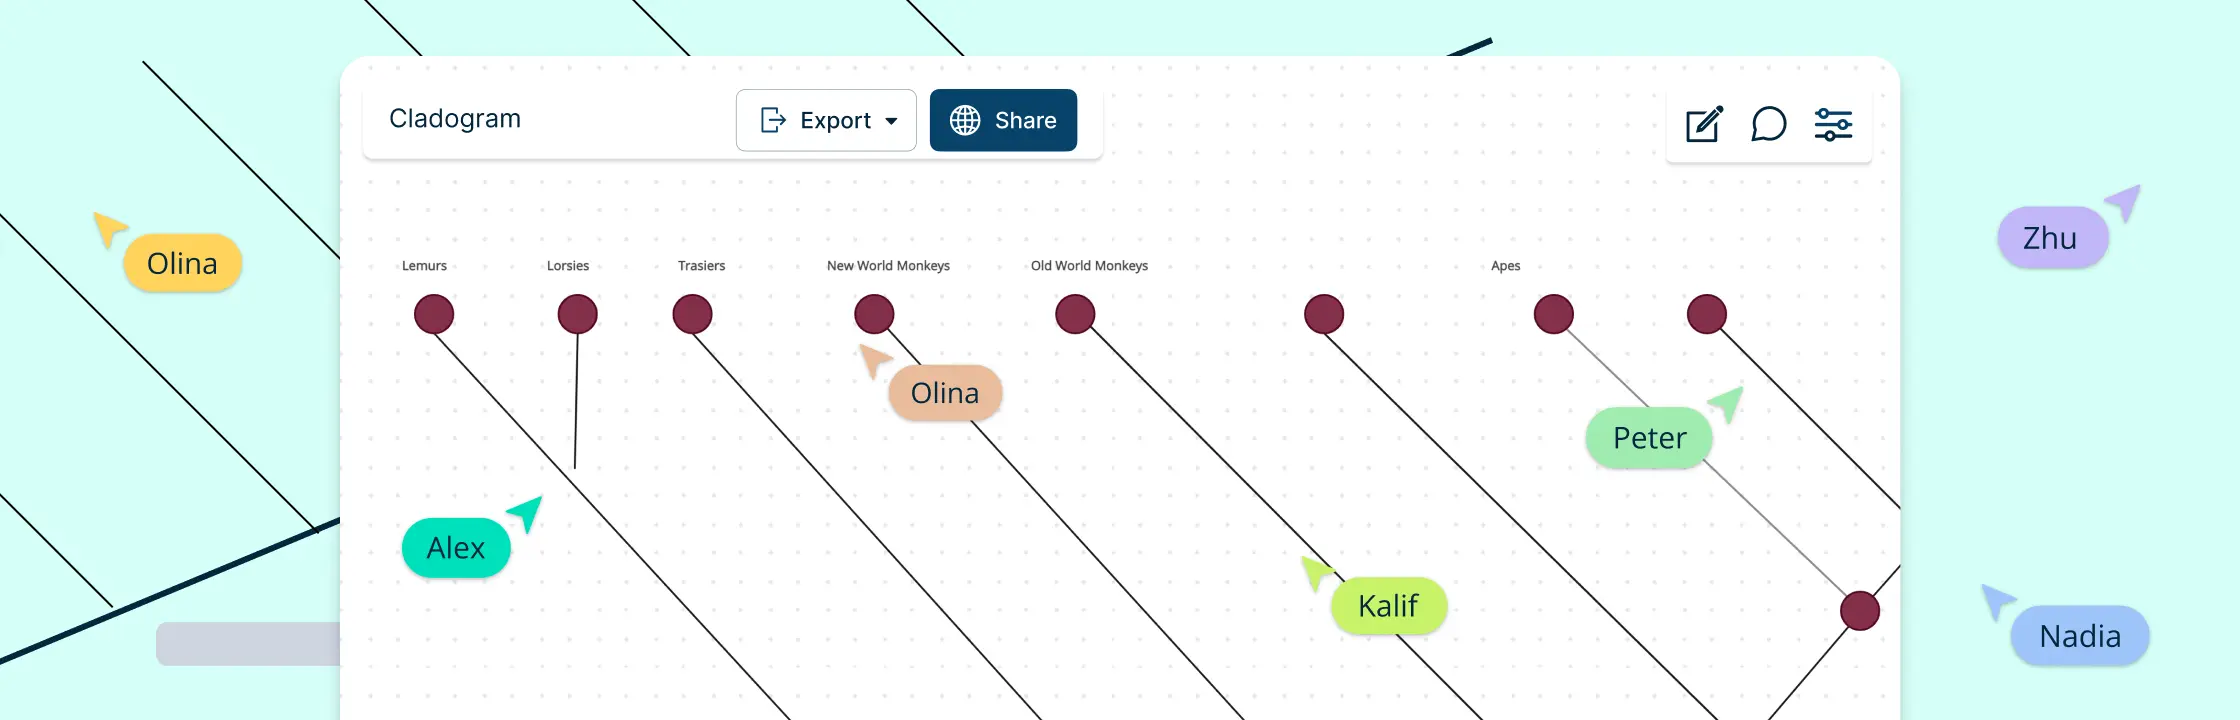
Cladograms play a vital role in various biological studies. For instance, they are frequently used to depict the evolutionary relationships among primates. By showcasing branching patterns, these diagrams help illustrate how different species are interconnected. A typical cladogram example might display the connections between lemurs, monkeys, apes, and humans, aiding in the understanding of their evolutionary lineage.
One can create and customize cladograms efficiently using tools like Creately, which offers intuitive diagramming capabilities. The platform supports visual collaboration, making it easier for students, educators, and researchers to build detailed cladograms collectively.

Phylogenetic Tree Example
A phylogenetic tree example is invaluable in demonstrating the evolutionary distances and timelines between species. For example, a phylogenetic tree illustrating the evolution of vertebrates might showcase the divergence of fish, amphibians, reptiles, birds, and mammals. These trees come in various shapes, each accurately depicting the evolutionary history and common ancestors of the taxa involved.
Using Creately can significantly streamline this process. With its data-integrated diagramming and visualization features, constructing and interpreting complex phylogenetic trees becomes much more straightforward. By incorporating extensive datasets, users can create accurate and comprehensive trees that reflect the latest evolutionary findings.

Real-World Application
The potential applications of cladograms and phylogenetic trees extend beyond academia. In the realm of conservation biology, these tools are critical for tracing the lineage of endangered species and making informed decisions about conservation priorities. Similarly, in the field of epidemiology, phylogenetic trees can help track the mutations and spread of viruses.
Creately’s platform enhances these real-world applications by providing robust tools for visual modeling. Its unified visual platform enables seamless transitions from ideation to execution, facilitating the creation of evolutionary diagrams that are both accurate and accessible.
Conclusion
Cladograms and phylogenetic trees are essential tools for visualizing evolutionary relationships among species. Cladograms illustrate hypothetical relationships and shared traits without indicating evolutionary time, while phylogenetic trees provide detailed information, including temporal and genetic distances. Both diagrams are crucial in various fields, from academic research to conservation biology and epidemiology.
The development of these tools, rooted in Darwinian theory and modern genetics, highlights their significance in studying biological diversity and evolution. Using platforms like Creately can simplify the creation and interpretation of these diagrams, enhancing accuracy and communication.
Understanding the differences and components of cladograms and phylogenetic trees allows you to choose the right diagram for your needs. These diagrams help reveal the complex web of life’s history, and tools like Creately make it easier to visualize and analyze these evolutionary relationships.