Ever feel overwhelmed trying to connect the dots between different species? Whether you’re a student or a researcher, data can feel like a scattered puzzle until you find the right lens. Enter the cladogram: the ultimate visual roadmap for the history of life. Far from a simple chart, it’s a high-level blueprint that transforms complex data into a clear story of ancestry. This guide explores what a cladogram is, how its anatomy works, and why this visual logic is the secret to understanding evolutionary biology.
Defining the Cladogram
A cladogram is a branching diagram that represents the evolutionary lineages among various biological species. It groups organisms based on shared characteristics to show how they diverged from a common ancestor. These diagrams are used extensively in the field of evolutionary biology to illustrate the point where lineages split or diverge over time, aiding in the visualization of traits shared among groups of organisms.


Historical Development
The concept of cladograms dates back to the early 20th century when biologists sought better ways to understand and visualize the evolutionary connections between different species. Cladistics, or phylogenetic systematics, was introduced by Willi Hennig in 1950. Hennig’s work provided a robust framework for the construction of these diagrams, emphasizing the importance of shared derived characteristics (synapomorphies) rather than just historical similarities.
Why Cladograms Matter: Purpose and Significance
Understanding the purpose and significance of cladograms is crucial in evolutionary biology. When you shift from a list to a cladogram, the data starts to make sense of life’s most complex connections.
1. Visualizing Evolutionary Relationships
Cladograms help visualize and interpret how species are related to each other through evolutionary history. It helps to see the ‘forks in the road’ where lineages split.
2. Clarification of Classification
By illustrating shared derived traits, cladograms strip away the superficial ‘look-alikes’ and reveal the true genetic lineage. This clarifies exactly where an organism belongs within a particular lineage based on evidence.
3. Fostering Biological Research
Cladograms are indispensable tools for researchers studying biodiversity, systematics, and evolutionary biology. They offer a clear representation of evolutionary pathways, which is critical for:
- Medicine & Epidemiology: Tracking how a virus mutates and branches out allows scientists to stay one step ahead of the next variant.
- Conservation Biology: By identifying which species are “evolutionarily unique,” teams can prioritize which habitats need the most urgent protection.
- Biotechnology: Finding related plant species can lead to the discovery of new natural compounds for drug development.
With the advent of advanced tools like Creately, constructing cladograms has never been easier. Creately’s diagramming capabilities, infinite canvas, and real-time collaboration features significantly streamline the process of creating and sharing these complex diagrams. Creately’s Cladogram maker tool makes it an ideal choice for educators, researchers, and students alike.
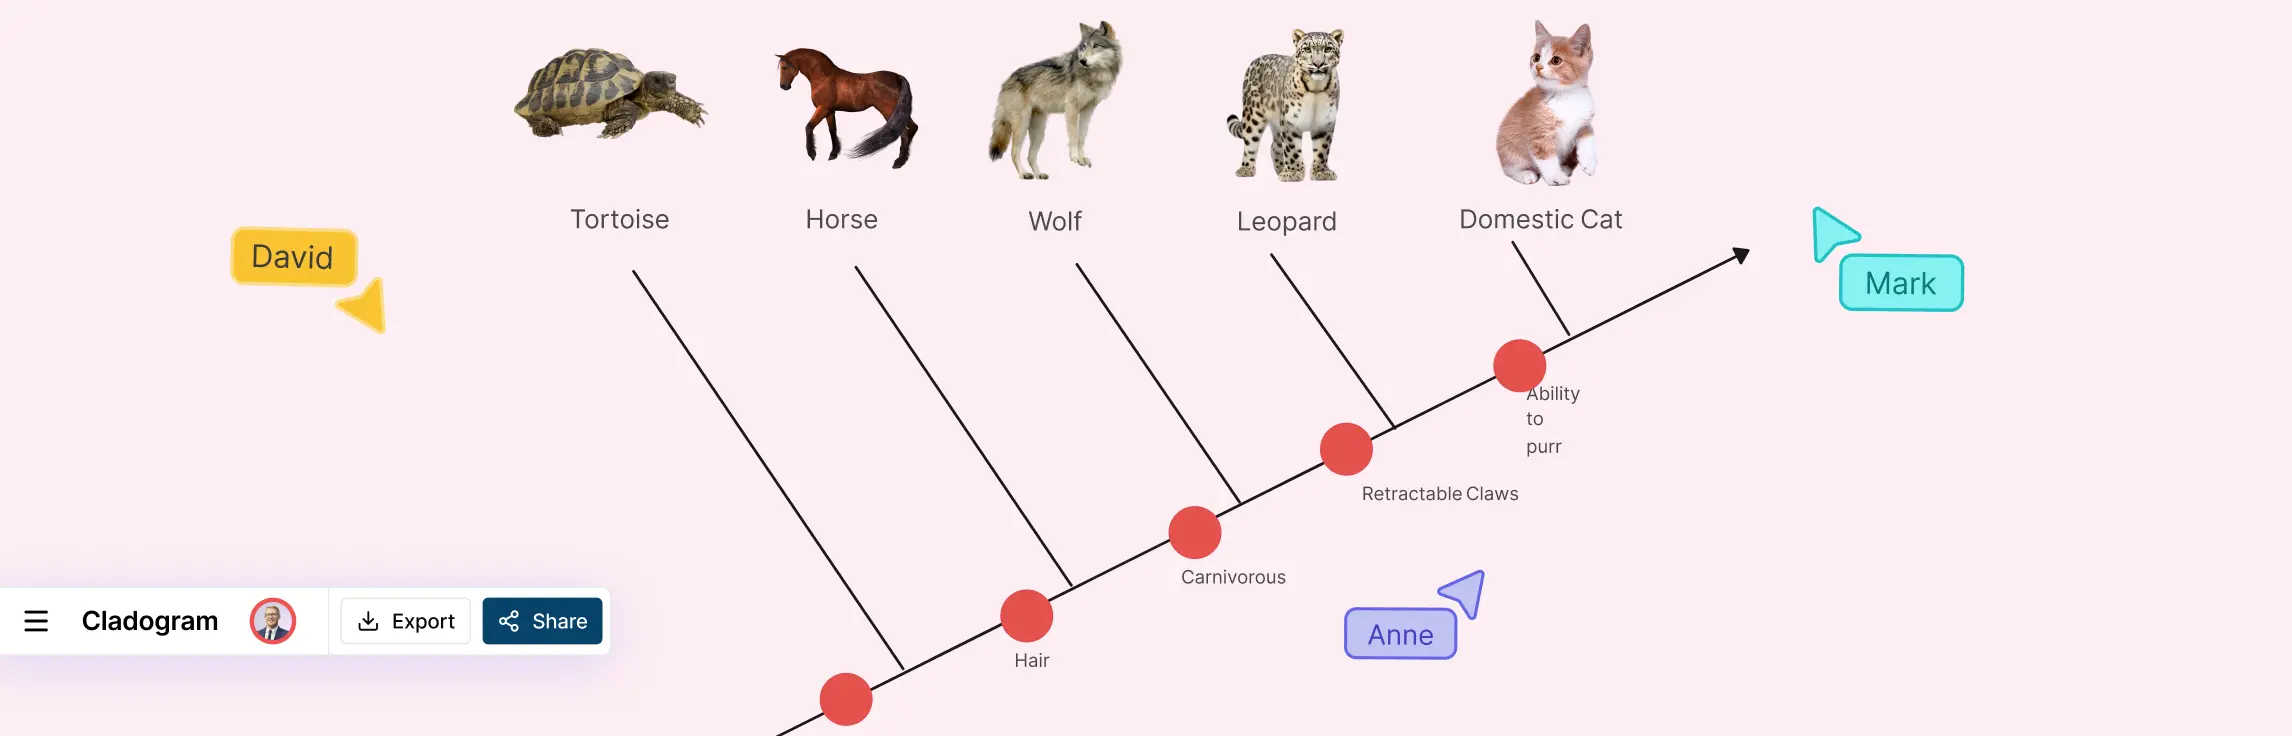
Components of a Cladogram: Understanding the Language of Lineages
To the untrained eye, a cladogram looks like a simple series of sticks. But to a visual thinker, it’s a sophisticated narrative. Each line and intersection represents millions of years of adaptation, survival, and change. Understanding the “anatomy” of these diagrams is the first step toward reading the story of life with total clarity.
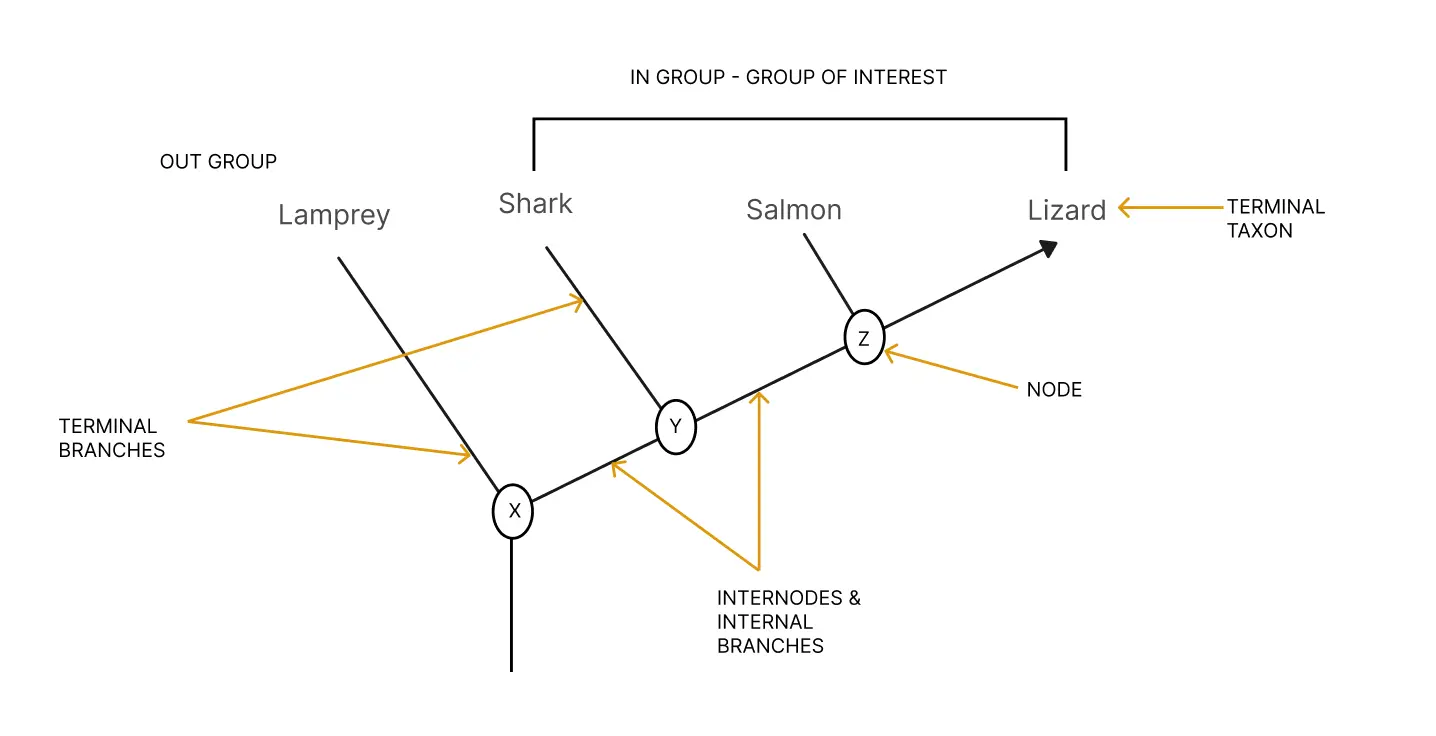
1. The Branching Logic: Every Line is a Story
In a cladogram, the branches (the lines) represent a lineage of organisms moving through time. Think of these lines as the “paths of survival.” When a line continues upward, it means that the lineage successfully adapted to its environment. When you look at a completed diagram, you aren’t just looking at a chart; you’re looking at the successful persistence of life across generations.
2. Nodes: The Evolutionary Forks in the Road
The most critical part of any cladogram is the node, the point where two branches split.
- What it represents: A node is a “common ancestor.” It marks a specific moment in history where a single population split into two or more distinct lineages.
- The “Fork” Metaphor: Imagine a fork in a hiking trail. Before the fork, everyone is walking the same path (sharing the same traits). At the node, a group develops a new trait, like growing fur or laying hard-shelled eggs, and heads off in a different direction.
3. Clades: The “Inner Circles” of Life
If you want to master cladistics, you have to understand the clade. This is the fundamental unit of evolutionary classification.
- The Rule: A clade is a monophyletic group, which means that it includes one common ancestor (a node) and every single one of its descendants.
- The Visual Test: Imagine you could “snip” a branch off the tree with a pair of scissors. Everything that falls off in that one clip—the ancestor and all the branches leading away from it—is a clade.
4. The Root and the Tips: Past meets Present
- The Root: This is the base of the diagram, representing the initial ancestor that all organisms in the chart share. It’s the “Level 1” of your visual map.
- The Tips (Terminal Nodes): These are the ends of the branches, usually representing the modern-day species we see today.
When you understand these components, the frustration of “messy data” disappears. You stop seeing a tangle of lines and start seeing a structured, logical flow of history. It’s an empowering way to organize the natural world, giving you the speed and clarity to identify relationships at a glance.
Cladistics: The Science Behind Cladograms
Cladistics, a method of classifying living organisms based on common ancestry, is the scientific foundation behind cladograms. This approach revolutionized how biologists understand evolutionary relationships, focusing on shared derived characteristics to map out the evolutionary history of species.
1. The Foundation: The Principle of Common Descent
Before we dive into the “how,” we have to look at the “why.” Cladistics is rooted in one powerful, inspiring idea: The Principle of Common Descent. This is the belief that all life on Earth is connected. It suggests that if you go back far enough in time, by identifying the traits that have been passed down through the ages, every living thing shares a common ancestor. It’s the ultimate puzzle, and the Principle of Common Descent is the logic that tells us the pieces actually fit together.
2. Synapomorphies: The “Shared Secrets” of Evolution
How do we know a whale is more closely related to a cow than to a shark? We look for synapomorphies.
- Definition: These are “shared derived characteristics”, physical or genetic traits that appeared in a common ancestor and were passed down to all its descendants.
- Evidence: Think of these as evolutionary “receipts.” If three different species all have the same unique bone structure in their inner ear, it’s not a coincidence; it’s a shared secret inherited from the same “node.” Identifying these traits is what allows us to group organisms with confidence and speed.
3. The Principle of Parsimony: The Power of Simplicity
When you’re dealing with massive amounts of biological data, it’s easy to get overwhelmed by all the possible ways species could be related. Biologists cut through this frustration using the Principle of Parsimony (often called Occam’s Razor).
- The Rule: The simplest explanation, the one requiring the fewest evolutionary changes, is usually the correct one.
- Why it works: Evolution doesn’t usually take the “scenic route.” If you have to choose between a map where a trait evolved once and a map where it evolved independently five different times, you go with the first one. It’s about finding the most efficient path, providing the clarity you need to make sense of complex lineages.
4. Modern Update: From Morphology to Molecules
For decades, cladograms were built by looking at “morphology”, such as the physical shape of bones, teeth, and feathers. But as we move deeper, the game has changed.
- The Shift: While physical traits are still vital for studying fossils, modern science has moved into Molecular Cladistics. We now look at DNA, RNA, and protein sequences to build our trees.
- The Benefit: Genetic data allows us to be incredibly precise. It can reveal relationships that are invisible to the naked eye, such as the surprising link between hippos and whales.
By combining the timeless logic of parsimony with the high-tech power of molecular data, we’ve turned the cladogram into a high-precision tool. It’s no longer just a classroom exercise; it’s a sophisticated, data-driven engine that helps modern teams visualize the very fabric of life.
From Scattered Data to Sharp Insights: Explore Cladogram Templates


Real-World Applications of Cladograms in Science and Medicine
Cladograms, which visually represent the evolutionary relationships between species, have far-reaching applications in various scientific and medical fields. Here, we’ll explore some of these applications, demonstrating how cladograms contribute to advancements in our understanding and approach to biology, ecology, and healthcare.
1. Taxonomy and Systematics
- Species Classification: Cladograms help taxonomists classify organisms based on evolutionary relationships rather than superficial similarities. This leads to a more natural and scientifically accurate classification system.
- Revising Taxonomic Groups: Cladograms often reveal that traditional taxonomic groups are not monophyletic (i.e., they do not include all descendants of a common ancestor). This leads to revisions and more accurate taxonomic groupings.
2. Evolutionary Biology
- Tracing Evolutionary Paths: Cladograms are used to trace the evolutionary history of species, showing how they have diverged from common ancestors over time.
- Studying Speciation: They help researchers understand the mechanisms of speciation by identifying when and how different species diverged.
- Examining Adaptations: Cladograms can highlight the evolution of specific adaptations and traits, providing insights into how species have evolved in response to their environments.
3. Paleontology
- Fossil Analysis: Cladograms are used to place fossil organisms within the tree of life, helping to interpret the evolutionary relationships of extinct species.
- Understanding Ancient Biodiversity: By integrating fossil data, scientists can reconstruct ancient ecosystems and understand the diversity of life in the past.
4. Ecology and Conservation Biology
- Conservation Prioritization: Cladograms help conservationists prioritize species and habitats for protection based on their evolutionary uniqueness and relationships.
- Biodiversity Studies: They aid in understanding the evolutionary relationships among species within an ecosystem, which is crucial for maintaining biodiversity.
- Invasive Species Management: Cladograms can help predict the impact of invasive species by examining their evolutionary relationships with native species.
5. Comparative Genomics and Molecular Biology
- Gene Function and Evolution: Cladograms are used to study the evolutionary history of genes and gene families, helping to understand their functions and evolutionary changes.
- Protein Evolution: Researchers use cladograms to trace the evolution of proteins and their functions across different species.
6. Medicine and Epidemiology
- Pathogen Evolution: Cladograms are crucial in tracking the evolution and spread of pathogens, such as viruses and bacteria, helping to understand their origins and mutation patterns.
- Drug Development: Understanding the evolutionary relationships of disease-causing organisms can guide the development of new drugs and treatments.
- Vaccine Development: Cladograms help identify conserved regions in pathogen genomes, which are critical for designing effective vaccines.
7. Agricultural Sciences
- Crop and Livestock Breeding: Cladograms assist in identifying genetically diverse species that can be used in breeding programs to improve crops and livestock.
- Pest and Disease Management: By understanding the evolutionary relationships of pests and pathogens, better strategies can be developed to manage and control them.
8. Biotechnology
- Gene Transfer Studies: Cladograms help trace the history of gene transfers between species, which is important for genetic engineering and synthetic biology.
- Bioprospecting: Cladograms guide the search for novel compounds and enzymes by identifying related species that might produce useful biological molecules.
Case Studies
1. Human Evolution
- Tracing Human Ancestry: Cladograms have been used to map the evolutionary relationships between modern humans, Neanderthals, and other hominins, providing insights into human evolution.
- Disease Susceptibility: Understanding the evolutionary relationships of humans with other primates helps in studying diseases that affect both humans and non-human primates.
2. Influenza Virus Evolution
- Tracking Flu Strains: Cladograms are used to monitor the evolution of influenza viruses, helping to predict which strains are likely to cause future outbreaks and informing vaccine development.
- Antigenic Shift and Drift: By studying the evolutionary changes in flu viruses, researchers can understand mechanisms like antigenic shift and drift that lead to new strains.
3. Conservation Efforts
- Protecting Endangered Species: Cladograms have been used to identify evolutionarily significant units (ESUs) within species, ensuring that conservation efforts preserve genetic diversity and evolutionary potential.
- Restoring Ecosystems: Understanding the evolutionary relationships within ecosystems helps in designing restoration projects that support the recovery of ecological balance and biodiversity.
Differences Between Cladograms and Phylogenetic Trees
Cladograms and phylogenetic trees are essential diagrams in evolutionary biology, depicting relationships among species. Despite their similarities, they differ in several key aspects. Read our comprehensive guide on Cladogram vs Phylogenetic Tree to explore the differences in depth.


Cladogram vs Phylogenetic Tree
When you’re trying to move with speed and clarity, picking the right diagram is half the battle. Here is a high-level breakdown to help you decide:
| Feature | Cladogram | Phylogenetic Tree |
| Primary Goal | To show shared ancestry and trait evolution. | To show evolutionary history and timelines. |
| Characteristics | Does not indicate evolutionary time or genetic distance. Focuses on the sequence of branching to show relative order of divergence. Useful for identifying shared traits and hypothesized evolutionary paths. | Each branch represents a lineage, with nodes indicating common ancestors. Branch length provides information on evolutionary change or time elapsed. Grounded in genetic data, allowing for accurate evolutionary timelines. |
| Branch Length | Equal/Arbitrary (does not represent time). | Scaled (represents time or genetic distance). |
| Core Question | "Who is most closely related to whom?" | "How long ago did these species diverge?" |
| Best Use Case | Classroom teaching, basic classification, and trait mapping. | Genomic research, paleontology, and tracking viral mutation rates. |
The cladogram is more than just lines on a page—it’s a powerful engine for clarity in the complex world of biology. By mastering the logic of clades and the principle of parsimony, you can move from “information overload” to sharp, visual insights. Whether you’re tracking a virus or teaching a class, the right diagram turns hidden history into a tangible structure. Ready to see the connections for yourself? Try Creately’s visual workspace to collaborate in real-time and bring your evolutionary data to life.
Helpful Resources
Learn how to build a cladogram to visualize the evolution of organisms from common ancestor.
Learn how to read and interpret cladograms for evolutionary biology, paleontology, or related fields.
Explore the distinctions between cladograms and phylogenetic trees and when to use them.
Discover what phylogenetic trees are and how they help in visualizing evolutionary relationships among species.