Struggling to turn scattered evolutionary data into a clear, professional visual? You aren’t alone. Our guide simplifies how to create a cladogram using a logical, step-by-step framework. From building character tables to using collaborative templates, discover how to move from messy notes to visual clarity by mapping complex evolutionary relationships with speed and precision.
Ever feel overwhelmed trying to connect the dots between different species? Whether you’re a student or a researcher, data can feel like a scattered puzzle until you find the right lens. Enter the cladogram: the ultimate visual roadmap for the history of life. Far from a simple chart, it’s a high-level blueprint that transforms complex data into a clear story of ancestry. This guide explores what a cladogram is, how its anatomy works, and why this visual logic is the secret to understanding evolutionary biology.
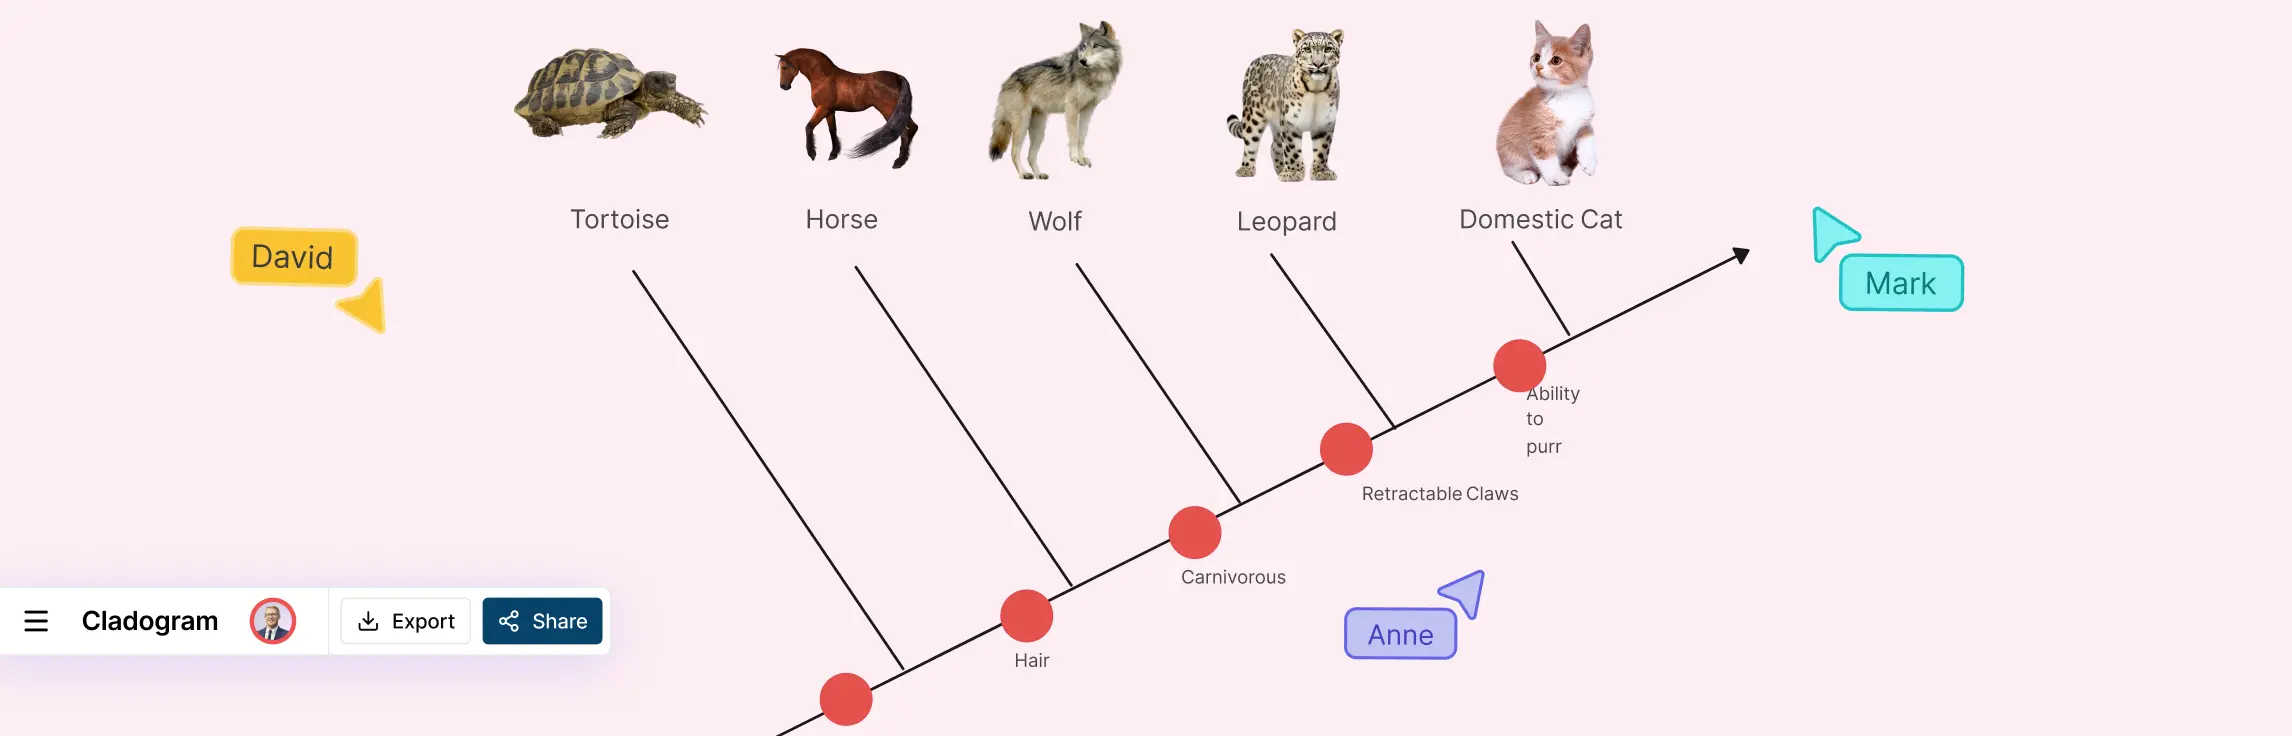
In the study of biological diversity and evolution, diagrams play an essential role in visualizing relationships among various species. Two primary types of diagrams used for this purpose are cladograms and phylogenetic trees. While they may appear similar, understanding their distinctions is crucial for accurate interpretation.
If you have ever stared at a cladogram and felt like you were trying to solve a puzzle without the instructions, you are not alone. It’s a common frustration: you see a series of lines and species, but find yourself asking, “Is a bird more closely related to a crocodile or a lizard?”